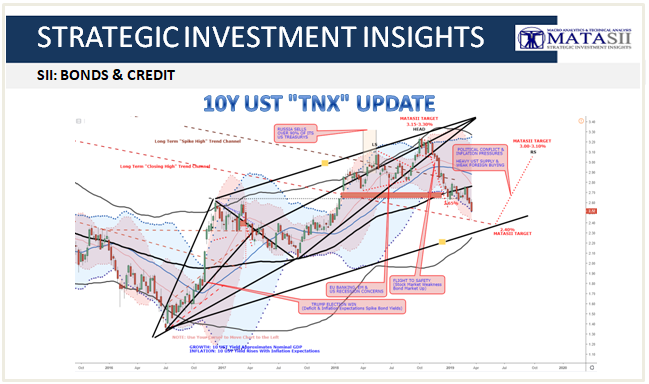
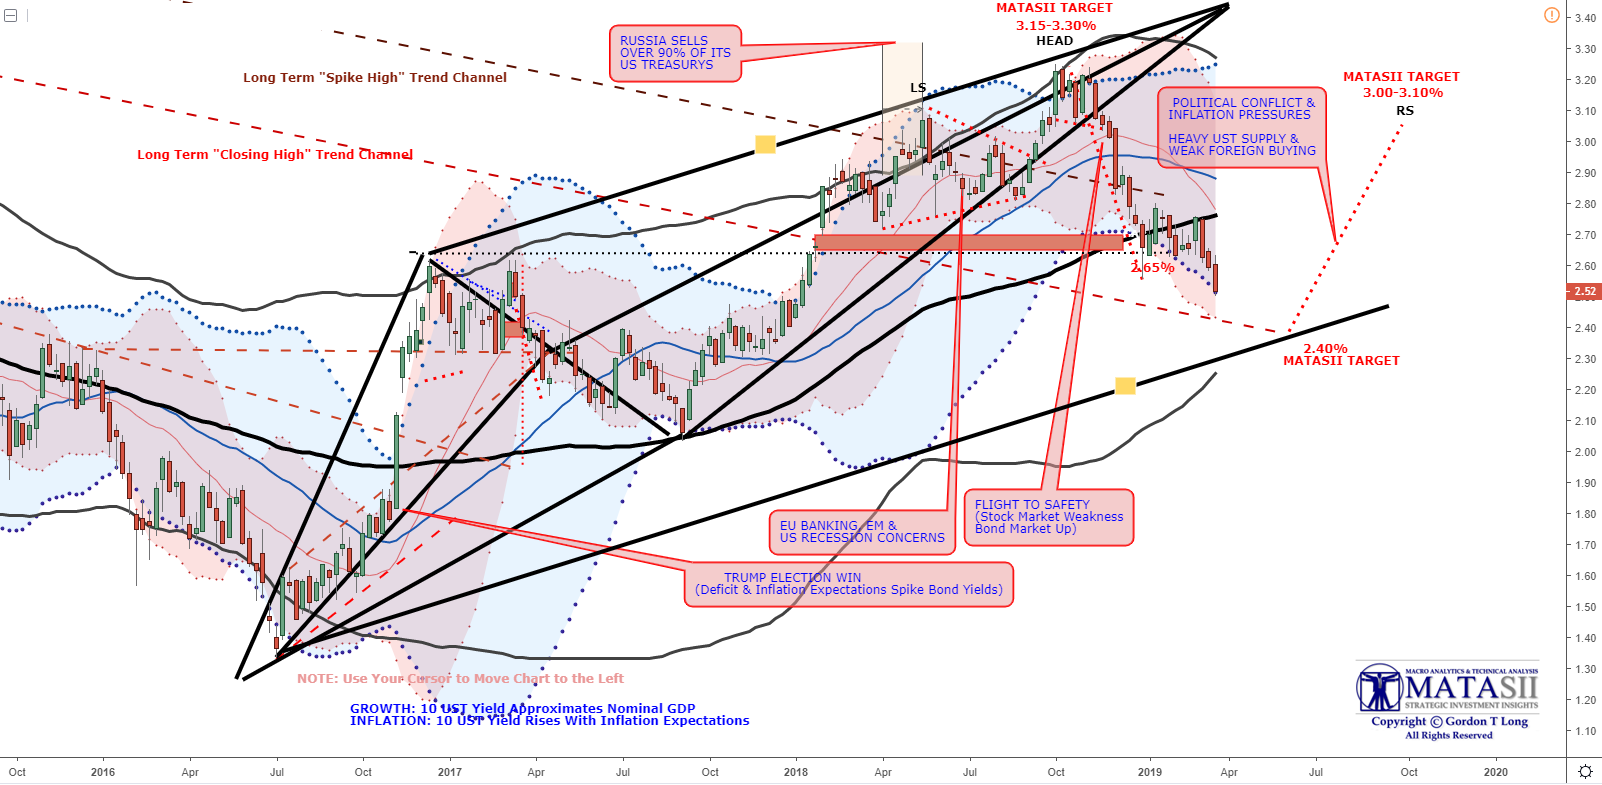
10Y UST "TNX" UPDATE
THE BREAKING NEWS STORY:
US Yields Could Still Have Quite A Bit More Downside
Thu, 21 Mar 2019
Authored by Bryce Coward via Knowledge Leaders Capital blog,
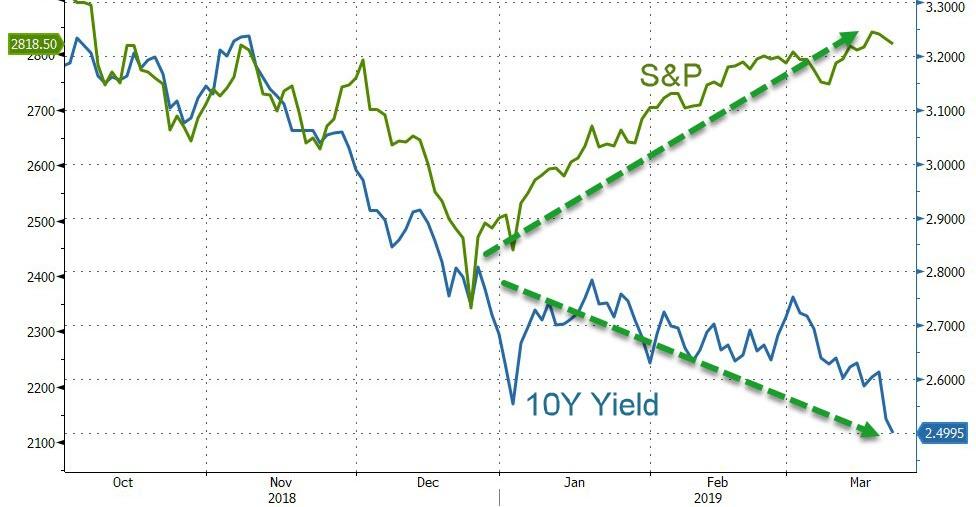
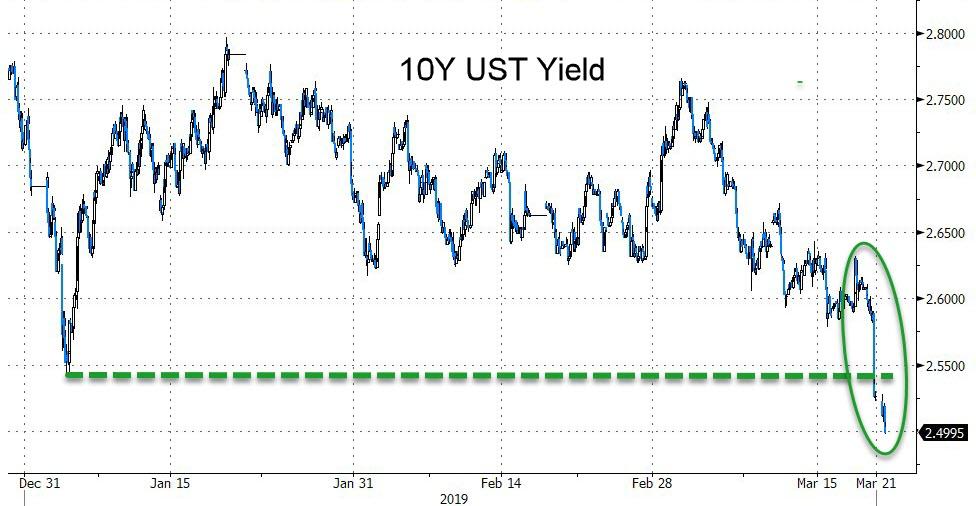
To the dismay of many observers, US treasury yields have been dead as a doorknob despite the 20% rally in stocks over the last three months. In fact, the US 10-year yield is on the verge of breaking below the 2.56% level it reached on January 4th when recession concerns were flaring. This obviously begs the question of what US yields are sniffing out that equities are not?
It’s a fair question, but the answer isn’t necessarily one that results in a binary outcome of stocks up>rates up, stocks down>rates down. In other words, rates can perfectly well head lower even as stocks chug higher if the right mix of declining growth and inflation is commingled with accommodation monetary policy.Indeed, that is exactly what we got in early 2016 when 10-year rates fell from 2.32% to 1.36% over the span of six months while stocks rallied by 17% from the February ’16 lows into July of that year. That setup looks similar to today and several leading market indicators are telling us so.
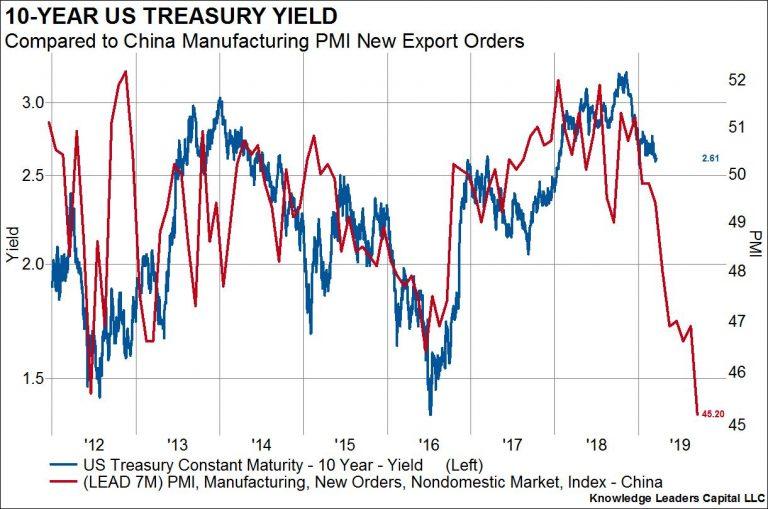
First on the docket is Chinese economic activity. Chinese economic activity is so important because changes in Chinese growth accounts for the bulk of the delta in global growth. China is also located towards the beginning of the global supply chain and so Chinese economic activity leads US economic activity by a good bit. Chinese economic activity is still falling and the most cyclical of leading indicators is saying growth in China will continue to wane for sometime. Here we show new Chinese export orders with a seven month lead overlaid against the US 10-year treasury yield. Much like 2016, this indicator is telling us that US growth, inflation, or both will be slowing for the foreseeable future and that dynamic could ultimately be reflected in much lower US rates.
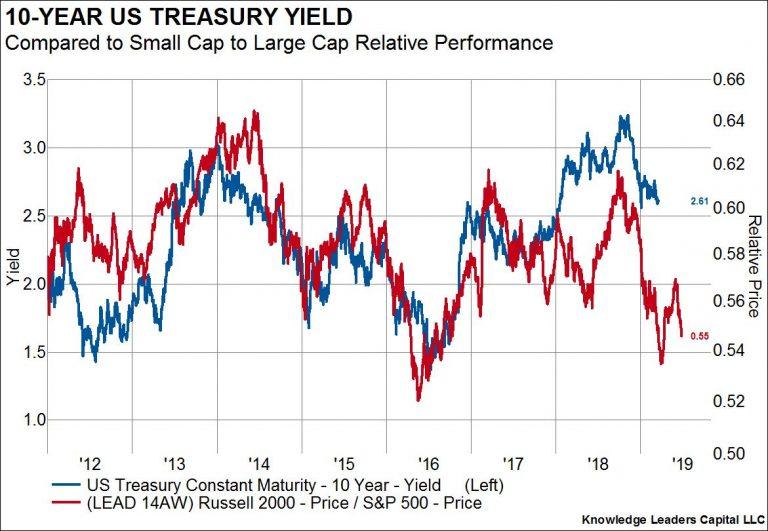
Cyclical indicators in the stock market are also telling us that US rates could head lower. Here we plot US yields against the relative performance of small cap vs large cap stocks. Small caps tend to be more sensitive to cyclical changes in the growth outlook than either large cap or interest rates. Thus, small cap relative performance to large caps often gives us a 3-4 month advanced tell on the direction of rates. Much like early 2016, small caps just can’t seem to find their footing here despite the substantial easing of forward guidance by the Fed. This suggests to us that rates could have considerable downside through the summertime at least.
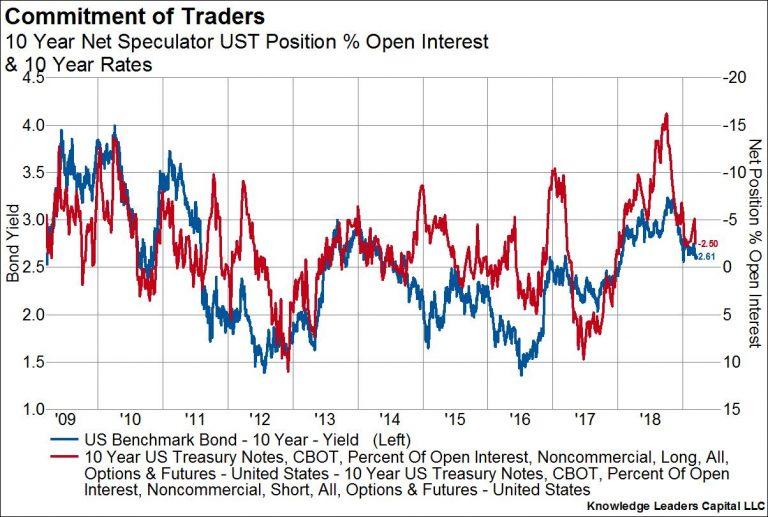
Finally, it’s useful to overlay econometric and market indicators against positioning. After all, if the whole market is on one side of the boat then the positioning effect alone could overwhelm more fundamental drivers of value. So, in the last chart we plot US yields against speculative options and futures positioning in the US 10-year note. The red line showing the net position of speculators is plotted on the right, inverted axis.
We note that at major turning points in yields the speculators tend to have accumulated extreme levels of short or long positions. For example, as rates were peaking back in the middle of 2018, the speculators were net short US bonds (betting that rates would continue to rise) by the largest amount on record. At that time, the speculators were all on the same side of the boat and that helped put a cap on rates. In contrast, speculative positioning in bonds is currently neutral, suggesting rates could continue to fall for quite awhile until the broad market positions itself for even lower rates.
FAIR USE NOTICE This site contains copyrighted material the use of which has not always been specifically authorized by the copyright owner. We are making such material available in our efforts to advance understanding of environmental, political, human rights, economic, democracy, scientific, and social justice issues, etc. We believe this constitutes a 'fair use' of any such copyrighted material as provided for in section 107 of the US Copyright Law. In accordance with Title 17 U.S.C. Section 107, the material on this site is distributed without profit to those who have expressed a prior interest in receiving the included information for research and educational purposes. If you wish to use copyrighted material from this site for purposes of your own that go beyond 'fair use', you must obtain permission from the copyright owner.
NOTICE Information on these pages contains forward-looking statements that involve risks and uncertainties. Markets and instruments profiled on this page are for informational purposes only and should not in any way come across as a recommendation to buy or sell in these assets. You should do your own thorough research before making any investment decisions. MATASII.com does not in any way guarantee that this information is free from mistakes, errors, or material misstatements. It also does not guarantee that this information is of a timely nature. Investing in Open Markets involves a great deal of risk, including the loss of all or a portion of your investment, as well as emotional distress. All risks, losses and costs associated with investing, including total loss of principal, are your responsibility.