A HIDDEN INFLATION FLAW NOW EXPOSED
Since the post inflation era of the 1970s the US government’s CPI metric has been designed primarily to hide inflation, not report it!
A critical flaw within the statistical gimmicks implemented over the years now has the government (and thereby the Fed) caught in a “stew” of its own making!
THE FLAW: Owner Occupied Equivalent Rent (OOER)
|
According to the BLS’ monthly CPI metric, rent inflation has just dropped to the lowest in a decade, just below 2% annually. This defies all reality as an exploding national housing surge is evident to everyone.
Before we discuss OOER, let’s first put it into perspective …
YEARS OF MANIPULATION NOW BECOME POTENTIALLY EXPOSED
CPI has been fraudulent for a very long time. The fact is that politicians and those behind this system created it starting in the 1980s as a way to reduce the cost of living adjustments for government payments to Social Security recipients.
The well documented statistical wizardry includes:
-
- Substitution: Uses substitution or replaces items that it measures if they become too expensive,
- Hedonics: Product Quality Adjustments,
- Imputation: Missing Price Observations due to Seasonality, Supply Shortages, Discontinuation
- Basket: Doesn’t include food or energy inflation, despite the fact those are two of the most necessary goods for consumers to survive
- Weighting: Weighs the cost of goods and services geometrically instead of by their actual price.
Evidence and occasional surveys indicate that the general public currently believes inflation is running well above official reporting. The numbers that government pumps out today are politically motivated. They are promoted under the cover of academic theories in an effort to reduce the federal deficit without anyone in Congress having to do the politically impossible, which was to register a vote that would harm the image of Social Security.
The aggregate impact of the reporting changes since 1980 has been to reduce the reported level of annual CPI inflation by roughly seven percentage points, meaning there is no question as to the understatement of inflation. If the methodological changes did not reduce CPI inflation reporting significantly, the politicians would not have pushed the changes through. The important issue is that without these changes, Social Security checks would be more than double what they are today.
|
|
|
THE BLATANT EVIDENCE OF INFLATION
In the last 40 years, the growing gap (see above) has become obvious between government reporting of inflation, as measured by the CPI, and the perception of actual inflation held by the general public.
Recent public reports compared the average price of various commodities in May 2020 under President Donald Trump to those in May 2021 under President Joe Biden. Here are some of their staggering numbers:
-
- Gasoline: $1.77 under Trump vs. $3 under Biden.
- Lumber: $332 per 1,000 board feet under Trump vs. $1,570 per 1,000 board feet under Biden.
- Home sales: $283,500 under Trump vs. $329,100 under Biden.
- Coffee: $0.96 a pound under Trump vs. $1.50 a pound under Biden.
- Wheat: $5 a bushel under Trump vs. $7.42 under Biden.
- Corn: $3.19 a bushel under Trump vs. $7.22 a bushel under Biden.
- Copper: $2.33 a pound under Trump vs. $4.76 a pound under Biden.
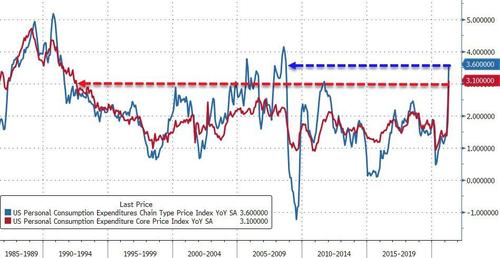
This is not an exhaustive list because I want to drive home that the rising inflation is across the board. Yes, some of the increase in prices is due to pent up demand and hamstrung supply chains. However, the sheer volume of cash that the government has poured into the economy over the last year-and-a-half is now driving rising costs. The inflation rate has tripled from 1.4 percent in January to 4.2 percent in April. The headline “PCE Deflator” rose 3.6% Y-o-Y, the fastest rate or price increase since 2008. Even more notably, the Core PCE Deflator soared 3.1% Y-o-Y (hotter than the +2.9% Y-o-Y expected) and the hottest print since May 1992…
|
|
|
THE HOUSING MARKET
When it comes to assessing real-world inflation that is having a direct impact on consumers, the Fed has recently been conspicuously absent from this important conversation, other than to assert that current inflation pressures are “Transient”. As we pointed out in the video this is not fully correct and may be intentionally misleading. Four inflation risks are completely missing from the Fed’s communications:
- RISK #1: A Sharper Rise in Wage Growth,
- RISK #2: A Multi-Year in Home Prices Which Boosts Rent (Shelter) Inflation,
- RISK #3: Temporary Price Spikes Raise Inflation Expectation Substantially,
- RISK #4: Yield Surge as a Market Inflation Reaction Inadvertently Causes Financial Tightening.
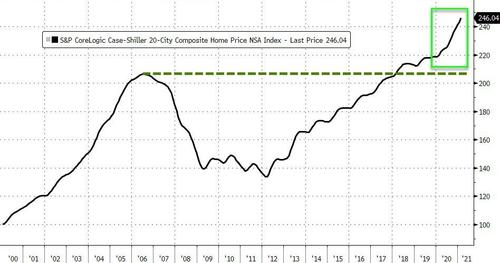
“In real terms, home prices have never been so high. My data goes back over 100 years, so this
is something,”
Nobel prize-winning economist Robert Shiller told CNBC’s “Trading Nation“ earlier this week on the chart to the right – top.
According to Case-Shiller’s latest data and as Shiller noted, “that is the highest price ever and over 19% higher than the home price index was at the peak in 2006…”
|
|
|
|
OWNER OCCUPIED RENT
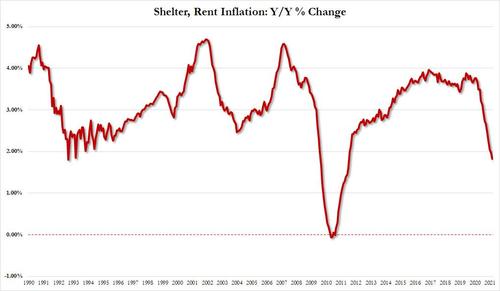
According to the BLS’ monthly CPI metric, rent inflation has just dropped to the lowest in a decade, just below 2% annually. (see chart to the right)
It is important to note that 24% of the total current CPI-U (the CPI for all urban consumers) is rooted in the category of “homeowners’ equivalent rent of residences.” This means that instead of reflecting some measure of home prices, as was the case before 1983, the BLS estimates the cost of housing based on what homeowners theoretically would pay to rent their own homes from themselves. The BLS then estimates how much homeowners raise the rent on themselves each month. Starting in 1989, the BLS skewed these estimates further by beginning to adjust that imaginary series for quality adjustments that would make the consumer feel good or better enjoy their residence.
According to the June Apartment List National Rent Report:
- The national rent index increased by 2.3% from April to May, the largest single month increase ever recorded in AL estimates, which begin in January 2017. It was also the third straight month in which that record has been broken, following a 2 percent increase last month and1.4 percent increase in March.
- In March, prices rebounded to their pre-pandemic levels. This month we hit a new milestone — our national index is now above the level where we projected it would have been if the pandemic-related price declines of 2020 had never occurred at all.
- After this recent spike, year-over-year rent growth now stands at 5.4% nationally, and prices are now above the level where rents would have been if the pandemic-related price declines of 2020 had never occurred at all.
|
|
|
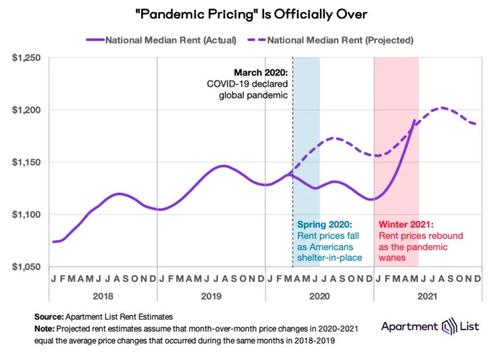
In the chart above, AL plots the national median rent from 2018 to present:
“The data for 2018 and 2019 depicts the smooth seasonality of a typical year, in which prices peak during the summer busy season and then dip slightly in the winter off-season. Overall, prices increased by 2.9 percent in 2018 and 2.1 percent in 2019. 2020 represents a clear break from this trend, with rents declining in the early months of the pandemic during what is normally peak-season. The dashed line in the chart represents a projection of how rents would have changed over the past year in the absence of the pandemic. This projection is based on an average of the growth rates that we observed in 2018 and 2019. Actual rent growth had been trailing this projection since the start of the pandemic, but this month’s record setting growth has now put actual rents ahead of the projection. Year-over-year rent growth now stands at 5.4 percent, another record.”
As Joseph Carson, former chief economist at Alliance Bernstein points out:
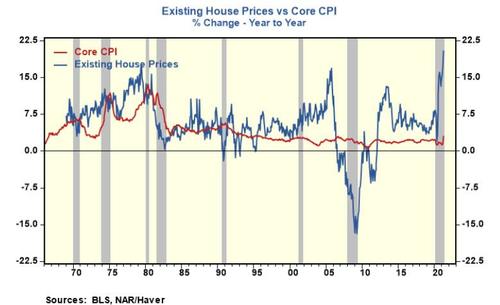
- In April, the median price for existing homes increased 20.3% in the past twelve months, a new record and far above the 1970s high-reading of 17.4%. More importantly, the increase in existing house prices is ten times greater than the 2% increase in non-market rents in the consumer price index.
- Owners rent index accounts for nearly one-quarter of the overall consumer price index and a full one-third of the widely followed core index. Inserting actual house prices in place of the non-market rents would add roughly five percentage points to 4.2% headline and 3% core inflation readings. The last time the US consumer price inflation ran that high was during the 1978 to 1982 time frame.
- Just because reported inflation statistics no longer include actual house prices does not mean a rise in house price is not a sign of increased inflation and higher inflation expectations. If an increase in house prices is not inflation, then what is it?
- One would think the current generation of policymakers would include house prices in their policy framework since it is an inflation-related outcome directly linked to monetary policy.
- Inflation cycles don’t end well. The odds of a bad outcome should be measurably higher when policymakers are unaware that monetary policy is fueling an unsustainable price cycle.
|
|
|
CONCLUSION
Surging rents, the “missing piece” from both the CPI and PCE baskets – are back with a vengeance. The result is that no matter which official inflation metric one uses, we are about to see some truly epic numbers in the coming weeks.
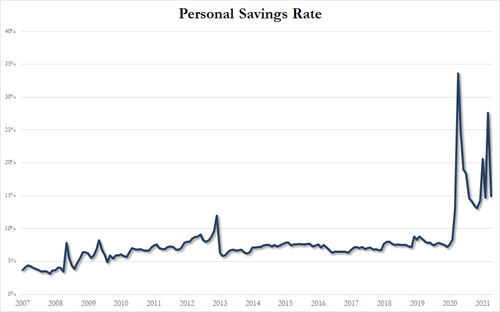
In parallel we should note that the consumer’s buffer has dissipated. The Personal Savings rate has plunged by 50% as Americans do what they do best – spend their savings.
So – let’s summarize – prices are rising at their fastest pace in almost 30 years and incomes just plunged by their most ever! This time the Fed won’t be able to rely on hiding behind false data!
|
|
|
“the pandemic created some truly “transitory” softness in the rental market last year, and in response, 2021 has seen some of the fastest rent growth we have on record in our data. Nationally, rents have now surpassed the level where they would have been if rent growth had not been disrupted by the pandemic. In markets like San Francisco where rents had been falling fastest, prices have turned a corner and are now rebounding. At the same time, booming markets like Boise continue to see prices climb. More broadly, rental inventory across the nation remains tight, and as vaccine distribution continues to gain momentum, we may be seeing even higher prices as a result of released pent up demand from renters who had been delaying moves due to the pandemic. Whereas last year’s peak moving season was halted by the pandemic, this year’s seasonal spike appears to be making up for lost time.
Apartment List ,
|
|