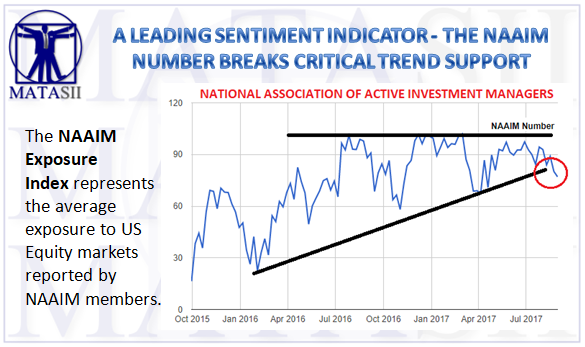
A LEADING SENTIMENT INDICATOR - THE NAAIM NUMBER BREAKS CRITICAL TREND SUPPORT
The NAAIM Exposure Index represents the average exposure to US Equity markets reported by our members.
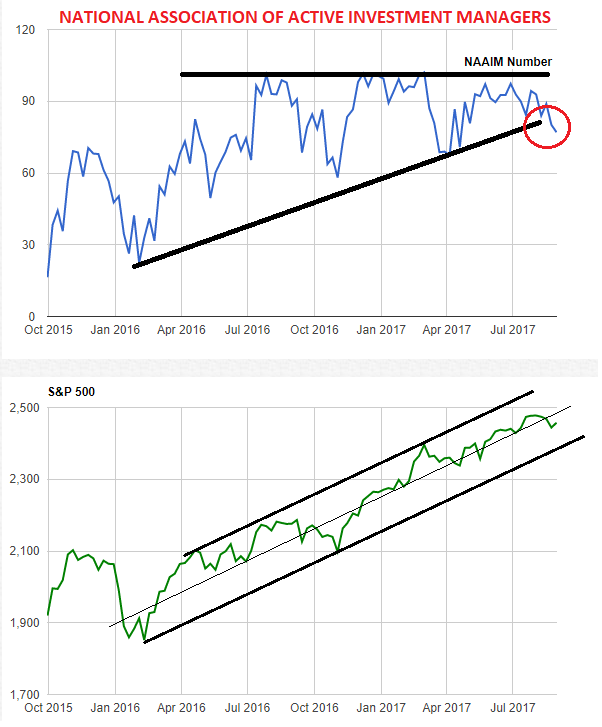
The green line shows the close of the S&P 500 Total Return Index on the survey date. The blue line depicts a two-week moving average of the NAAIM managers’ responses.
It is important to recognize that the NAAIM Exposure Index is not predictive in nature and is of little value in attempting to determine what the stock market will do in the future. The primary goal of most active managers is to manage the risk/reward relationship of the stock market and to stay in tune with what the market is doing at any given time. As the name indicates, the NAAIM Exposure Index provides insight into the actual adjustments active risk managers have made to client accounts over the past two weeks.
This week’s NAAIM Exposure Index number is:
77.04
Last Quarter Average
85.08
Download CSV file with data since inception »
| Date | NAAIM Number Mean/Average | Bearish | Quart1 | Quart2 | Quart3 | Bullish | Deviation |
| 08/30/2017 | 77.04 | 0 | 53.00 | 85.00 | 100.00 | 200 | 47.93 |
| 08/23/2017 | 80.14 | 0 | 69.00 | 85.00 | 100.00 | 190 | 42.48 |
| 08/16/2017 | 88.92 | 0 | 71.00 | 90.00 | 100.00 | 180 | 35.53 |
| 08/09/2017 | 83.95 | 0 | 61.75 | 90.00 | 100.00 | 200 | 44.30 |
| 08/02/2017 | 92.85 | 0 | 82.00 | 98.00 | 100.00 | 200 | 43.48 |
| 07/26/2017 | 94.31 | 0 | 81.25 | 97.00 | 100.00 | 200 | 52.25 |
| 07/19/2017 | 84.26 | 0 | 78.50 | 94.50 | 100.00 | 200 | 43.90 |
| 07/12/2017 | 89.90 | 0 | 81.50 | 95.00 | 100.00 | 175 | 34.93 |
| 07/05/2017 | 92.85 | 0 | 76.00 | 95.00 | 100.00 | 200 | 41.48 |
| 06/28/2017 | 97.32 | -50 | 81.00 | 100.00 | 100.00 | 200 | 56.32 |
NAAIM member firms who are active money managers are asked each week to provide a number which represents their overall equity exposure at the market close on a specific day of the week, currently Wednesdays. Responses can vary widely as indicated below. Responses are tallied and averaged to provide the average long (or short) position or all NAAIM managers, as a group.
Range of Responses:
200% Leveraged Short
100% Fully Short
0% (100% Cash or Hedged to Market Neutral)
100% Fully Invested
200% Leveraged Long
Data collection issues that may affect the statistical significance of this data include:
Use of a single, composite number for each adviser may not accurately represent the market view of a manager who has short term and long term strategies that are providing conflicting signals or a manager who uses both contra-trend and trend following strategies for different portfolios.
Investment Styles very widely among managers participating in this survey. They may include managers that trade very frequently and can switch long and short positions daily. Other managers stay fully invested at all times and only change allocations among market segments or sectors. Still others trade around core positions and only a portion of their portfolios change, but that portion could potentially go from long to short very quickly.
Sample size: Although the number of participating managers, known as NAAIM Trend Setters, is steadily growing the sample size is not large and therefore may be less reflective of actual market conditions.
NAAIM publishes this data for use in tracking only and reserves the right to the use and trademarks of the NAAIM Exposure Index and its underlying data. Express permission must be sought from NAAIM for use of this data for commercial purposes.