A MARKET MESSAGE HIDDEN IN THE CPI PATTERN
A PUBLIC SOURCED ARTICLE FOR MATASII (SUBSCRIBERS-RESEARCH & PUBLIC ACCESS ) READERS REFERENCE
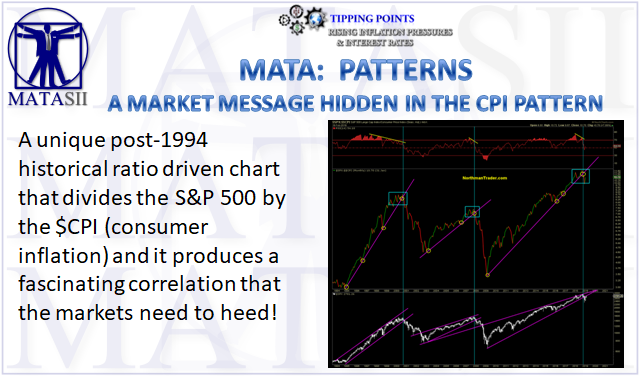
MATA: PATTERNS

SOURCE: 02-19-19 -Extracted from Northman Trader - "The Lost War"
MATASII SYNTHESIS:
- A fascinating analysis that I haven't seen anyone make public before!
- The SPX:$CPI ratio chart suggests new lows are coming
- Current market strength is an opportunity to sell, especially considering that this rally
- Remains untested,
- Technically uncorrected and
- Dovish central banks have now been fully priced in.
There’s a chart I’ve been watching for years and it’s not an index chart, rather it is a ratio driven chart that divides the S&P 500 into $CPI (consumer inflation) and it produces a fascinating picture:
For decades this ratio has followed a very repetitive pattern: During bull markets the ratio rises and then forms lows coinciding with market corrections and these lows form along a very precise trend line. When markets enter a topping process the ratio wobbles, becomes unstable in its ascent until the ratio breaks below the trend line coinciding with a bull market top. And each time the ratio breaks the break coincides with a break in the S&P 500 bull market trend. At the same time, as we’ve seen with index chart tops, the relative strength index (RSI) prints a negative divergence (a lower high) while the ratio prints a new high. All of these things have now again come to fruition.
Coincidence? Judge for yourself looking at the chart above.
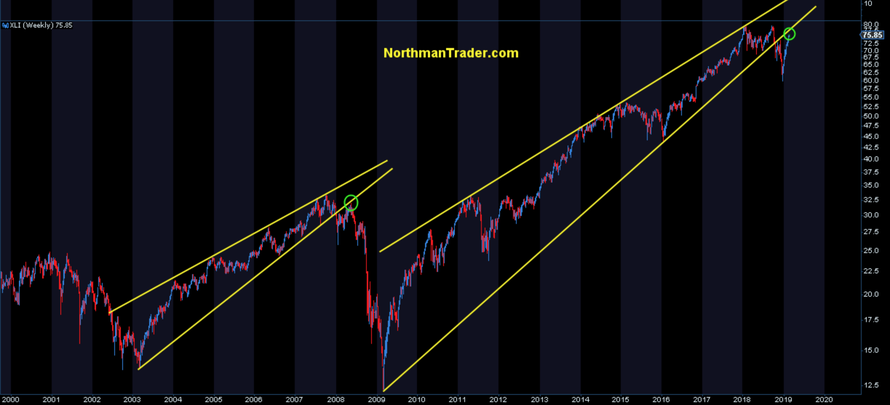
What is clear is that the ratio broke its trend line in December for the first time since 2009. The 2 previous breaks marked the end of bull markets and brought about sizable bear markets. But note also that these bear markets experienced sizable bear market rallies first and I’ll use a chart of the Industrials ($XLI) here to illustrate the point:
It sends the same message as the CPI ratio chart: The war is already lost, no matter how desperate central banks are in attempting to re-inflate asset prices. The larger message I take away from this: Market strength is an opportunity to sell, especially considering that this rally remains untested, technically uncorrected and dovish central banks have now been fully priced in. But hey, perhaps it’s different this time. It has to be, otherwise the CPI ratio chart suggests new lows are coming.