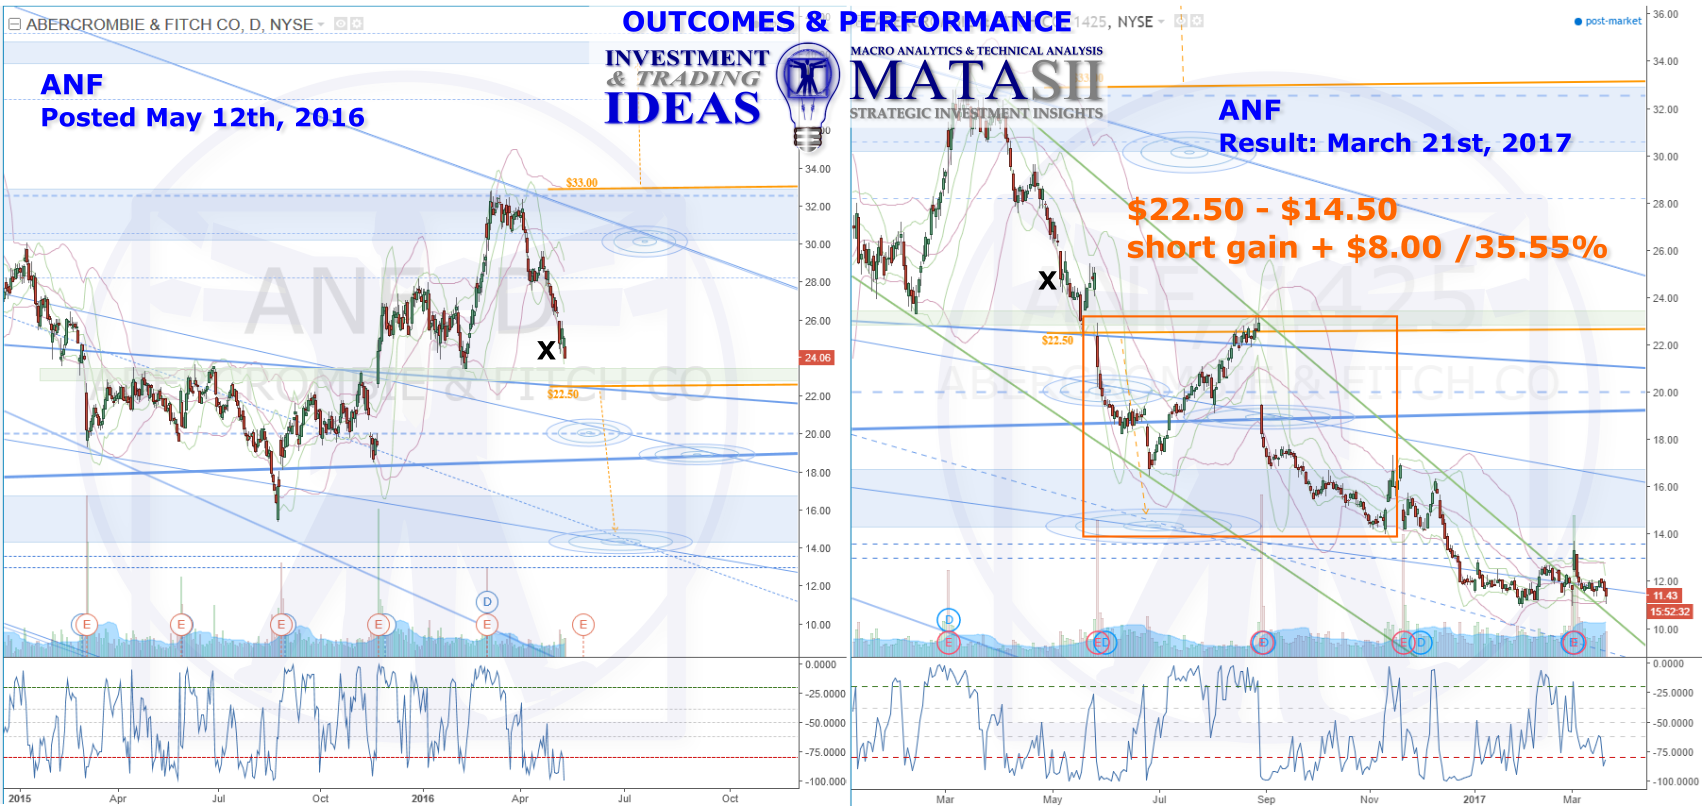
In May 2016 we posted ANF with some potential technical opportunities to consider. The left hand chart is the daily at that time; the right hand chart shows the current market as of March 21st, 2017. "X" marks the same location on both charts to help with orientation. From X we see a wiggle before a gap down that opens at the technical trigger consideration; ANF then drops through a weekly target before finding support and bouncing at the blue s/r zone. Had you held out the next lift there would have been some nervousness (but little pain) as the market moved back to the entry price level before another significant gap down in to another weekly target. From there ANF continues to fall off, reaching the target level of the bottom of the blue s/r zone in Nov.2016. Since then the market has continued to move lower, currently sitting around $11.40 (+ 49% from initial short trigger consideration).