ARE WE THERE YET??
This newsletter is focused on being a follow-on to our recent August LONGWave video and last week’s newsletter. Friday’s August Options expiration was an important event with technical patterns achieving critical levels.
Corporate earnings came in better than expected, culminating in a relatively strong earnings season for corporate America. The corporate results reported over the last weeks have been stronger than anticipated. We’ve seen a beat rate of approximately 75-80% throughout recent weeks, illustrating remarkable resilience among big businesses in America. These stronger-than-expected results have enabled stocks to push higher and higher in recent weeks.
It is our opinion that, though the market was due for a significant counter rally within this current downtrend, both the Fed and Market are presently trying to determine the degree of drawdown the recession will precipitate.
Will this be a Hard Landing (or worse) or will it be a Soft(er) Landing than most expect? We will know with Q3 Earnings & Corporate Guidance.
We have updated key charts from our last newsletter and added further supporting analytics below.
|
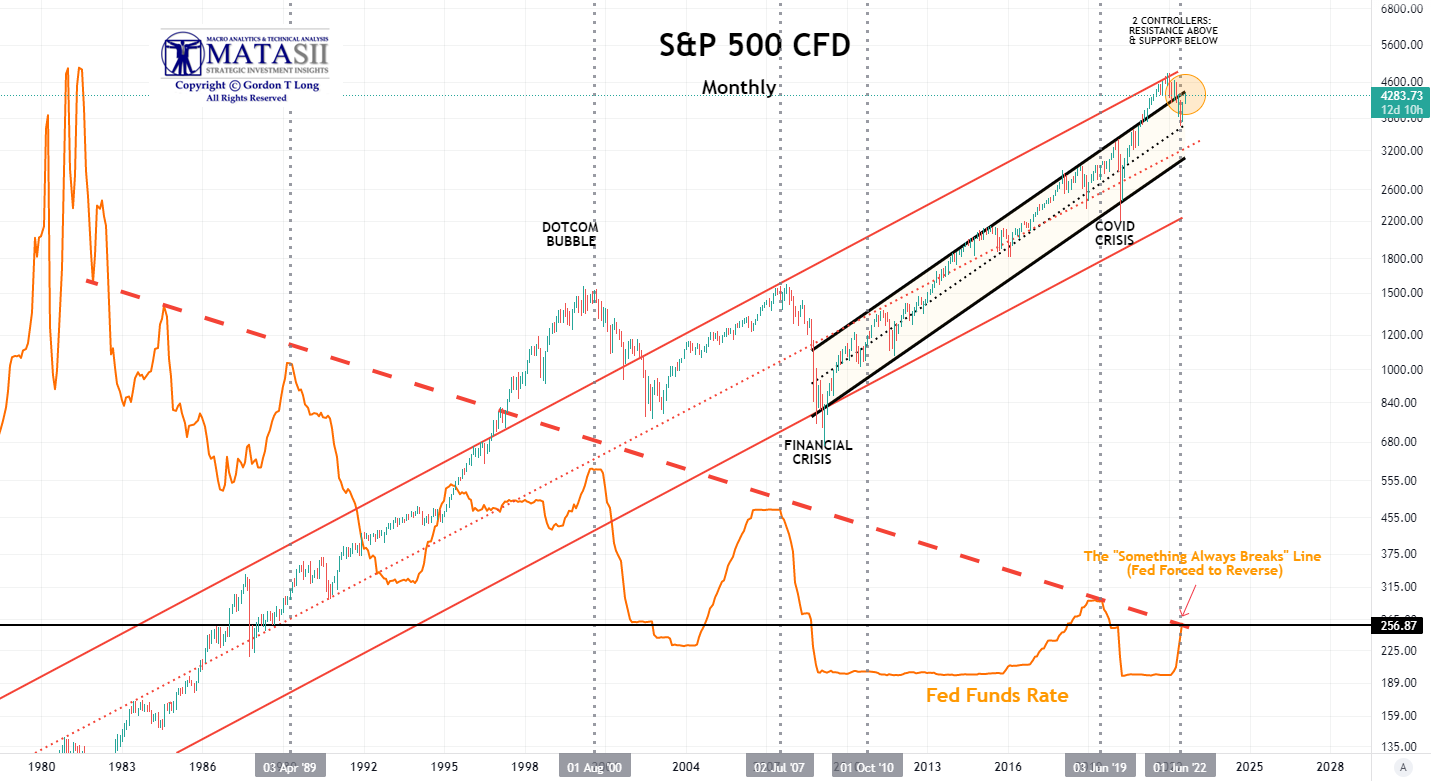
WE ARE AT CRTICAL TREND LINE RESISTANCE
- We have reached the MATASII Long Term overhead resistance trend line (Black Channel) going back to the 2008 Financial Crisis.
- The Fed Funds Rate has reached the “Something Always Breaks Line” (Heavy dotted red line plotted against declining Fed Funds Rate)!
|
|
|
YOUR ANNOTATED DESK TOP / TABLET / PHONE ANNOTATED REAL-TIME CHART
SUBSCRIBER LINK
|
|
|
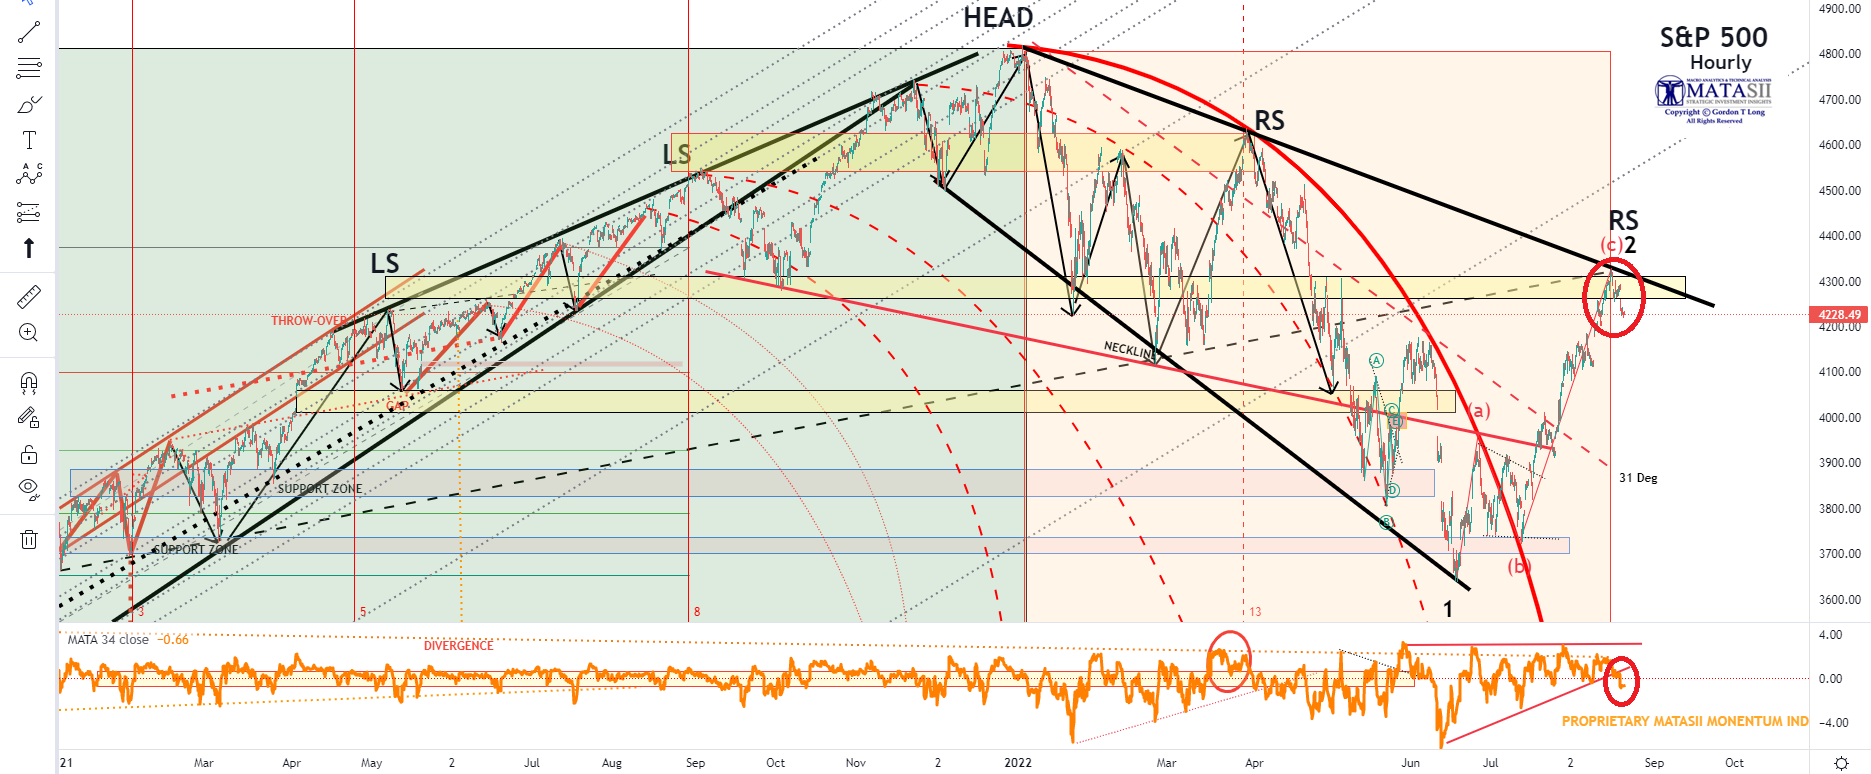
MATASII’S INTERMEDIATE TERM “WATERFALL” CHART
A Long-Term Head & Shoulders and Rounded Top Formation Patterns shown below give strong evidence that an important technical market top is now likely in.
- We have been experiencing a classic “Doomed Market Top” since the beginning of 2021.
- We appear to be completing a larger Right Shoulder of a classic “Head & Shoulders” pattern within the Doomed Top.
- This week the Right Shoulder bounced against the longer term overhead resistance labeled as “(C) 2” (Yellow resistance band shown below).
- Price completed a reversal at exactly the completion of a Trend Line shown by a descending black trend Line.
- This week the Proprietary MATASII Momentum Indicator broke its lower consolidation triangle pattern (see lower panel).
|
|
|
YOUR ANNOTATED DESK TOP / TABLET / PHONE ANNOTATED REAL-TIME CHART
SUBSCRIBER LINK
|
|
|
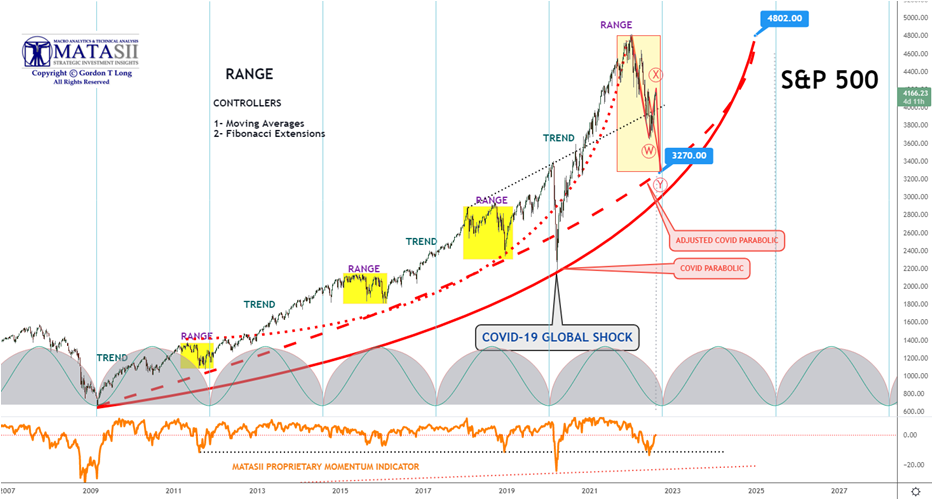
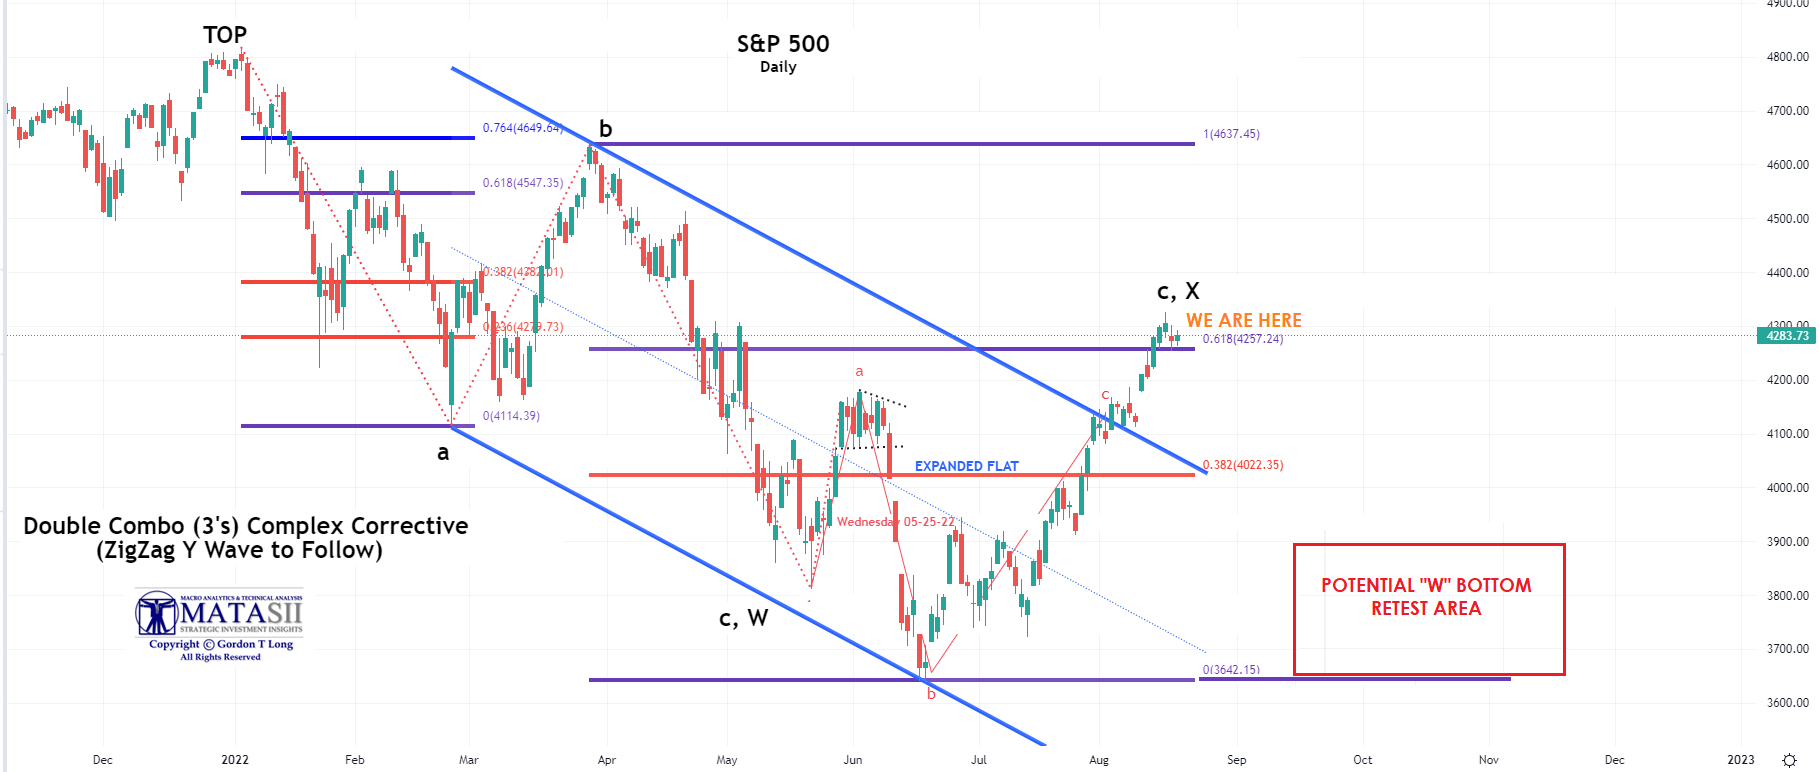
MATASII BEAR MARKET ELLIOT WAVE COUNT & RETRACEMENT EXPECTATIONS
- It is our expectations that the Intermediate Term Topping Pattern (shown above) is part of an Elliott Wave Double Combo Complex Corrective (“WXY” Zig Zag) formation.
- Long Term Parabolic market trends shown below by three red curves (one dotted, one dashed and one solid), are important boundary conditions currently in play.
- We should expect a major rally on completion of the “WXY” pattern at approximately 3270 on the S&P 500.
|
|
|
YOUR ANNOTATED DESK TOP / TABLET / PHONE ANNOTATED REAL-TIME CHART
SUBSCRIBER LINK
|
|
- We have been expecting a standard Fibonacci counter rally retracement of 61.8% which the S&P 500 has now achieved.
|
|
|
YOUR ANNOTATED DESK TOP / TABLET / PHONE ANNOTATED REAL-TIME CHART
SUBSCRIBER LINK
|
|
|
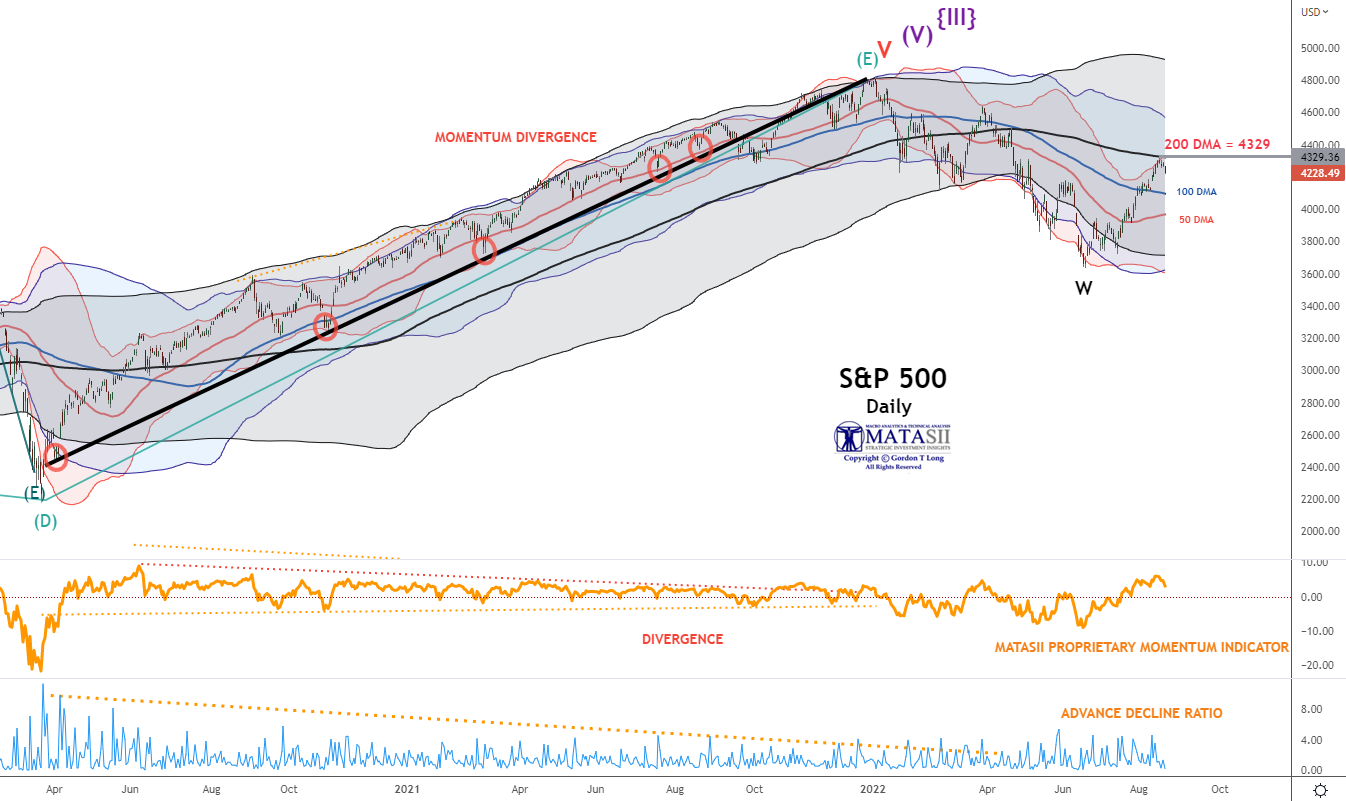
A FINAL PUSH TO THE 200 DMA OVERHEAD RESISTANCE LEVEL
|
|
|
In the last newsletter we anticipated that the bear market counter rally will end with a retest of the underside of the 200 Day Moving Average at approximately 4329 on the S&P 500 (shown below). So far this appears to be what occurred.
|
|
|
YOUR ANNOTATED DESK TOP / TABLET / PHONE ANNOTATED REAL-TIME CHART
SUBSCRIBER LINK
|
|
|
NOTE: Watch for a possible final retest of the prior lows with a classic “W” bottom formation. This will tell you we are wrong with our assessment that the Bear Market is still in play and we are no longer heading for a S&P 500 low of 3270.
|
|
|
NOTICE Information on these pages contains forward-looking statements that involve risks and uncertainties. Markets and instruments profiled on this page are for informational purposes only and should not in any way come across as a recommendation to buy or sell in these assets. You should do your own thorough research before making any investment decisions. MATASII.com does not in any way guarantee that this information is free from mistakes, errors, or material misstatements. It also does not guarantee that this information is of a timely nature. Investing in Open Markets involves a great deal of risk, including the loss of all or a portion of your investment, as well as emotional distress. All risks, losses and costs associated with investing, including total loss of principal, are your responsibility.
|
|
|
FURTHER SUPPORTING ANALYTICS
|
|
|
 CONVERGENCE SIGNALS! CONVERGENCE SIGNALS!
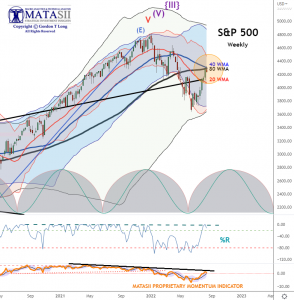
THE 40:80 WMA DEATH CROSS (BEAR MARKET CROSS)
- The 40 WMA is now crossing the longer term 80 WMA.
- This is an important longer term death cross signaling a potential longer term Bear Market.
- The % Williams Number (upper of the two lower oscillators) is at a high. This could stay at this level for a period of time to more closely align with the cycles at work shown at the bottom of the price bar chart.
- The MATASII Proprietary Momentum Indicator is at an overhead resistance level (as shown on lower of the two oscillator grafts).
YOUR ANNOTATED DESK TOP / TABLET / PHONE ANNOTATED REAL-TIME CHART
SUBSCRIBER LINK
|
|
|
S&P 500 TREND LINES CONVERGE WITH 200 DMA
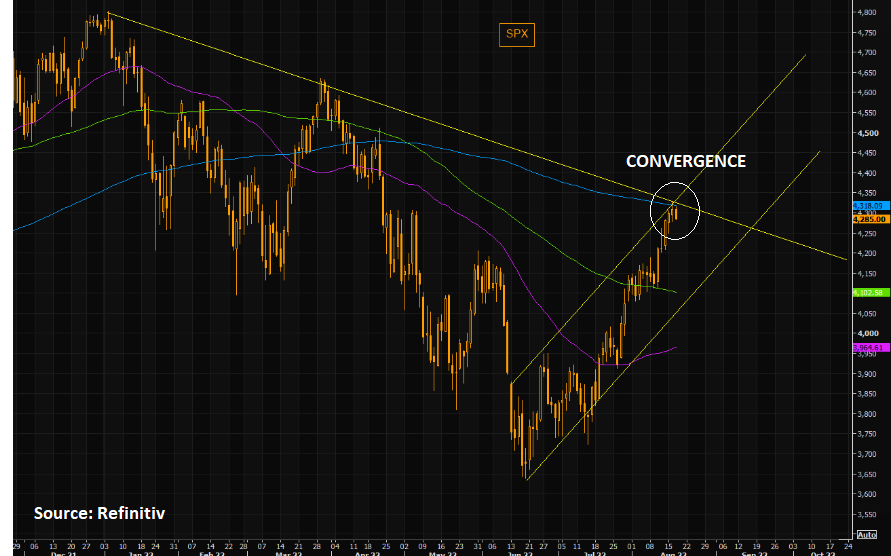 We have seen the SPX Futures reflect the first negative candle in a long time. As shown in the chart to the right, we tried the longer term trend line as well as the 200 day moving average. We have seen the SPX Futures reflect the first negative candle in a long time. As shown in the chart to the right, we tried the longer term trend line as well as the 200 day moving average.
- A reversal here would be almost too perfect, but let’s see how things develop from here.
- The SPX could retrace 150 points from here and still be inside the shorter term trend channel that has been in place since June lows.
- Note the 100 and 200 DMA are still negatively sloping, while the 50 DMA is sloping upwards…but is far down.
|
|
|
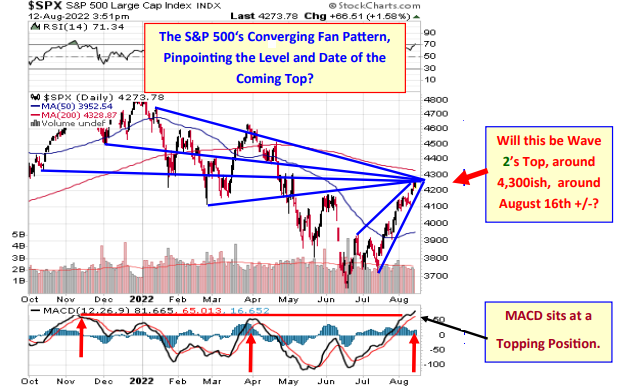
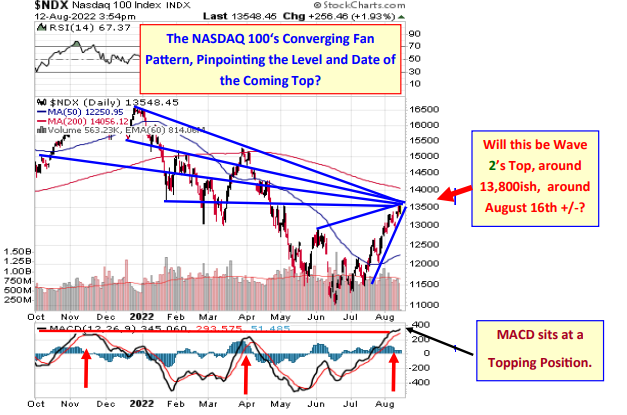
CONVERGING FAN PATTERN – S&P 500, NDX & DJIA
In the years I have been doing Technical Analysis, i don’t recall seeing such a dominant Fan Pattern on all major indexes at the same time. Below we show five trend-lines with touch points of prior tops or bottoms that fan in convergence to a singular point in time and price.
- Could this be telling us the coordinates of price and date for the coming Intermediate degree wave top? We know this coming top will be significant.
- The Converging Fan pattern of trend-lines may be evident now because of this approaching turn’s significance.
- What is also interesting is that the MACD (Moving average Convergence Divergence) Indicator sits at a place where previous notable tops have occurred during 2022’s crash.
|
|
|
Indicates at Top in the S&P at ~4300 around August 16 +/-
|
|
|
|
Indicates at Top in the NDX at ~13800 around August 16 +/-
|
|
|
|
THE FINANCIALCONDITIONS INDEX CONTINUES TO BE KEY TO WATCH
 In the last newsletter we suggested we should expect near term Financial Conditions Index to increase, thereby pressuring the market lower. This is exactly what we saw in last week’s lead up to the August option expiration. As predicted in the last newsletter, the Financial Conditions Index tightened this week. This was a direct result of: In the last newsletter we suggested we should expect near term Financial Conditions Index to increase, thereby pressuring the market lower. This is exactly what we saw in last week’s lead up to the August option expiration. As predicted in the last newsletter, the Financial Conditions Index tightened this week. This was a direct result of:
- The Fed Minutes released on Wednesday,
- Fed speakers reconfirming 75 bases point increase in the Fed Fund Rate in September and
- Expectations coming out of next week’s Jackson Hole Monetary Summit.
|
|
|
LAST NEWSLETTER WE SAID:
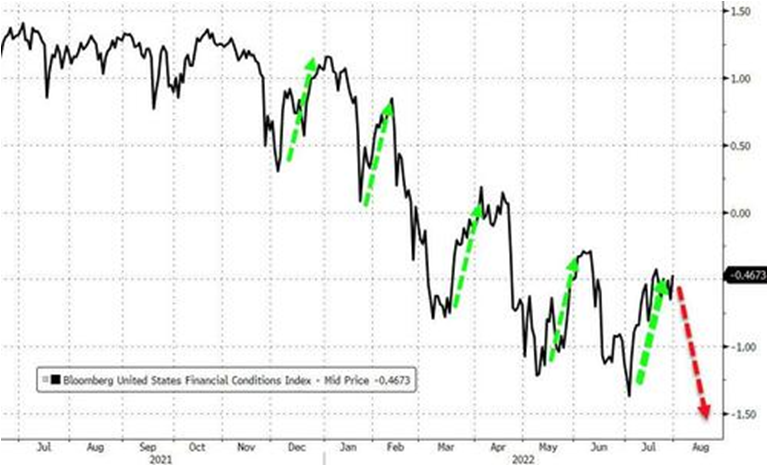
We expect the Financial Conditions Index to reach previous 2008-2010 levels (see chart to right) before rebounding to prior market highs (see “What You Need to Know” at top of newsletter).
The rally in everything has ‘eased’ financial conditions again – almost exactly the same amplitude of easing we have seen 4 other times during this tightening cycle. (chart right)
We have seen this cyclical shift before with lower highs (tighter peaks to each easing sub-cycle) and lower lows (tighter tights) … suggesting perhaps The Fed is well aware that tightening aggressively in one big batch will crush the market (and the economy). So perhaps a ‘gently does it’ approach is more palatable… and judging by the amplitude of this ‘easing sub-cycle’, we should be facing another tightening leg down…
We believe the current lift shown here will extend further than indicated before heading towards 3270.
As Nomura’s Charlie McElligott recently noted:
“The trick here is this next few weeks window, where the resumption of Fed-speak could begin to lean back into the market’s impulse EASING of Financial Conditions Index.”
WHAT WE SUBSEQUENTLY WITNESSED:
Comments from Richmond Fed president Barkin today summed a week of hawkish prompts from the central bank that a pivot ain’t coming soon and there’s more pain to come (for the economy and the market):
“The Fed must curb inflation even if this causes a recession,” adding that The Fed “needs to raise rates into restrictive territory.”
All of which sent rate-cut expectations plunging on the week while rate-hike expectations remained high…
FINANCIAL CONDITIONS “CYCLICALLY” TIGHTENED AGAIN THIS WEEK
|
 |
|
|
“The Fed would, in order to get inflation down to the 2% target, have to crush the economy. In order to bolster growth, the Fed will at some point “accept to live with inflation. This dovish pivot is not likely in the very near term, in contrast to what markets seem to be expecting right now, but this dovish pivot may come in 2023”.
Ann-Katrin Petersen, a senior investment strategist at BlackRock Investment Institute.
The hawkish nudge finally hit the YOLO/MOMO crowd sending stocks reeling going into Options Expiration after a significant options expiration. Nasdaq and Small Caps were clubbed like a baby seal (down over 2% Friday) and all the US Majors ended the week lower (with The Dow the prettiest horse in the glue factory this time as ‘growthy’ tech was hammered with rising rates)…
|
|
|
WATCH FOR A POSSIBLE “W” REVERSAL RETEST PATTERN IN SEPTEMBER
Watch for a possible classic “W” bottom formation with September earnings to signal if this Intermediate 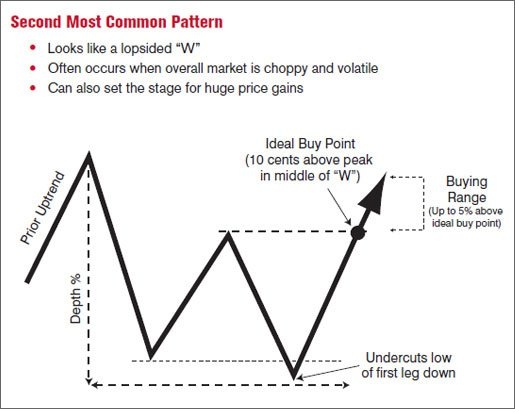 Term Bear Market is in fact really over. Term Bear Market is in fact really over.
- The double bottom looks like the letter “W”.
- The twice-touched low is considered a support level.
- The advance of the first bottom should be a drop of 10% to 20%, then the second bottom should form within 3% to 4% of the previous low, and volume on the ensuing advance should increase.
If this does in fact occur, it signals the market is expecting and beginning to price in a “Soft(er) Landing” for the developing US Recession.
|
|
|
CONCLUSION
Last week was the lead up to Friday’s $2 Trillion Monthly Options Expiration.
 CHART RIGHT TOP: We just witnessed the largest net buying in 7 weeks driven mostly by risk unwinds – short covers outpacing long sales 3 to 1. Last week’s $ short covers were the largest since Dec ’21. CHART RIGHT TOP: We just witnessed the largest net buying in 7 weeks driven mostly by risk unwinds – short covers outpacing long sales 3 to 1. Last week’s $ short covers were the largest since Dec ’21.
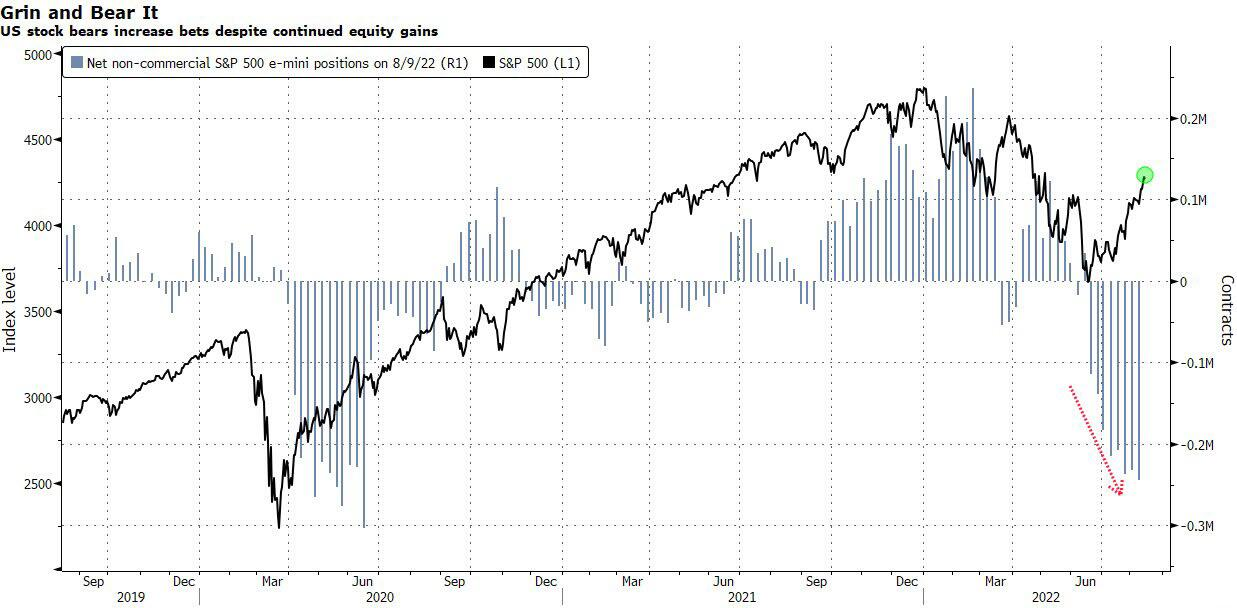
CHART RIGHT BOTTOM: With stubborn bears refusing to capitulate to this “most hated rally”, and in fact making it even more hated by the minute as they dig in their heels and add even more shorts, the higher stocks rise…
 CHART BELOW: September historically has been a challenging month from a seasonal perspective. Statistically it is the second worst month of the year for stocks! CHART BELOW: September historically has been a challenging month from a seasonal perspective. Statistically it is the second worst month of the year for stocks!
|
|
|
|
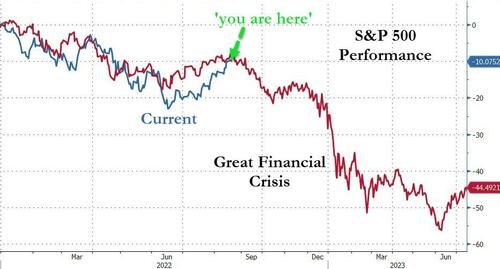
CHARTS BELOW: The recent market counter rally is not out of line with prior bear market counter rallies in degree and time.
|
|