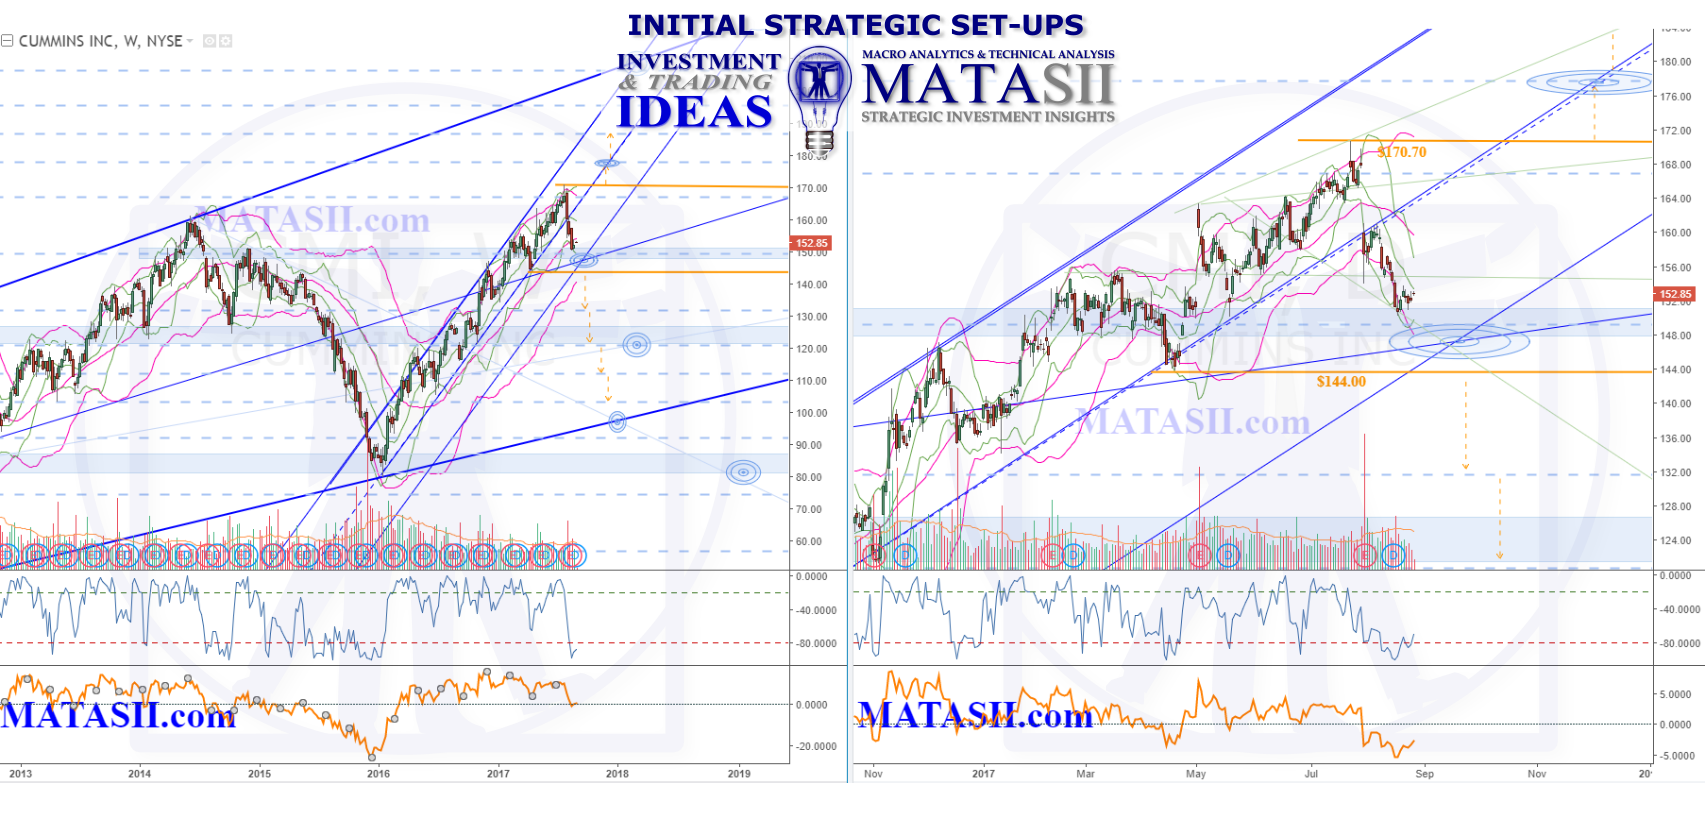
CMI has recently broken through a long term weekly channel that had contained the market during its lift through 2016-17. This may be the warning or the start of a bigger move down or just a correction to the large lift since 2016. Significant supports are near by and we will be watching to see […]
Andrew J.D. Long, MFTA
About Andrew J.D. Long, MFTA
Posts by Andrew J.D. Long, MFTA:
MLM Martin Marietta Materials IDEA
The weekly chart on the left shows a potential double top for MLM. The latest drop has moved the market to the s/r of the previous pattern, where we can see on the daily chart (right) that it has just broken through. Watching to see if support is found here, or if it will continue […]
USCR U.S. Concrete IDEA
USCR has recently pulled back and and is approaching the weekly 34ma (left chart, pink ma). This offers potential opportunity for the market to bounce from the 34ma and lift to the UBB, or break through and drop to the LBB. Note that these BB’s are roughly aligning with recent market highs and the lows […]
JCI Johnson Controls International IDEA
The weekly view of JCI shows the market has reached previous high levels (left edge of left chart), and may be putting in a potential double top (left chart, current). The lift from JCI sine 2003 has done so in a contracting wedge: a break of the pattern could offer opportunity. IF we do see […]
MGA Magna International Inc. IDEA
Watching for expected weakness in the auto sectors, the current technical set-up for MGA is below. A potential double top can be seen on the weekly chart (left), with the market then dropping off in to 2016. Since then a slightly contracting wedge consolidation has developed: breaking this structure offers potnetial opportunities. Solid orange […]
COL Outcomes & Performance +18.6%
Back in January we posted a few ideas in our Defense SII; below is the original post for COL and the current market (2017/08/13). A break out of the long term weekly channel (solid orange highlight) shows a possible gain of 18.6%. More could have been possible from a break of the riskier orange dashed […]
ORLY IDEA: Outcome & Performance
Below you can see the original post for ORLY’s technical set-up on May 6th, 2017; and the current market as of July 24th, 2017. The significant technical break around the $227 level occurred; and a low of $170 (+25%) was reached. While we had identified the $227 level as one of significance, there were also […]
VC Visteon Corporation IDEA
Our weekly view shows VC in the middle of a long term channel; at the beginning of this year we can see the recent lift starting in earnest as it makes its final push off channel support. The daily chart (right) shows the current market lifting within a smaller blue channel and bouncing between […]
AXL American Axle & Manufacturing IDEA
Our long term weekly perspective (left chart) shows AXL in a potential contracting wedge pattern. Solid orange highlights the patterns support & resistance; breaking these offers potential opportunities for the next significant move from the market. Along with the patterns support & resistance, blue s/r zones can be seen to have held the market, both […]
LEA Lear Corporation IDEA
The weekly view for LEA (left chart) shows a large lifting expanding wedge, with the market now at the top resistance of the pattern. The daily chart on the right gives us a closer look at the recent consolidation pattern since the market has reached the weekly pattern resistance. Solid orange lines highlight significant technicals […]