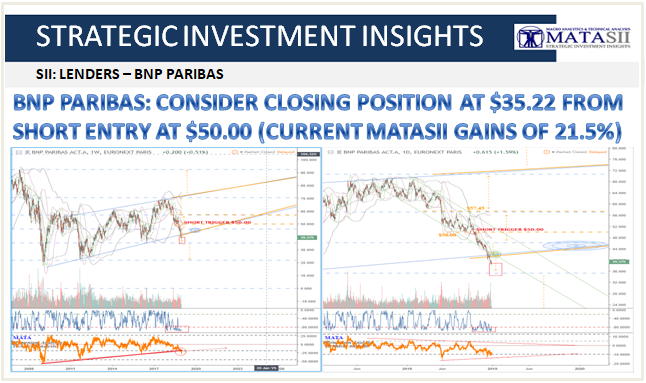
BNP PARIBAS: CONSIDER CLOSING POSITION AT $35.22 FROM SHORT ENTRY AT $50.00 (CURRENT MATASII GAINS OF 21.5%)
Business Summary (yahoo Finance)
![]() Paribas SA provides a range of banking and financial services in France and internationally. The company operates through two divisions, Retail Banking and Services; and Corporate and Institutional Banking. It offers long-term corporate vehicle leasing, and rental and other financing solutions; and digital banking and investment services, cash management, and factoring services to corporate clients, as well as wealth management services. The company also provides credit solutions for individuals under the Cetelem, Cofinoga, and Findomestic brand names; savings and protection solutions, including insuring individuals and their personal projects and assets; and asset management, private banking, and real estate services. In addition, it offers global market services, including investment, hedging, financing, and research across asset classes; security services comprising clearing, custody, and asset and fund services, as well as corporate trust, and market and financing services; and corporate trade and treasury, debt financing, specialized financing, strategic advisory, mergers and acquisition, and equity capital market services for institutional and corporate clients. The company was formerly known as Banque Nationale de Paris and changed its name to BNP Paribas SA in May 2000. BNP Paribas SA was founded in 1848 and is headquartered in Paris, France.
Paribas SA provides a range of banking and financial services in France and internationally. The company operates through two divisions, Retail Banking and Services; and Corporate and Institutional Banking. It offers long-term corporate vehicle leasing, and rental and other financing solutions; and digital banking and investment services, cash management, and factoring services to corporate clients, as well as wealth management services. The company also provides credit solutions for individuals under the Cetelem, Cofinoga, and Findomestic brand names; savings and protection solutions, including insuring individuals and their personal projects and assets; and asset management, private banking, and real estate services. In addition, it offers global market services, including investment, hedging, financing, and research across asset classes; security services comprising clearing, custody, and asset and fund services, as well as corporate trust, and market and financing services; and corporate trade and treasury, debt financing, specialized financing, strategic advisory, mergers and acquisition, and equity capital market services for institutional and corporate clients. The company was formerly known as Banque Nationale de Paris and changed its name to BNP Paribas SA in May 2000. BNP Paribas SA was founded in 1848 and is headquartered in Paris, France.
BNP CHART AS OF CLOSE 12-28-18
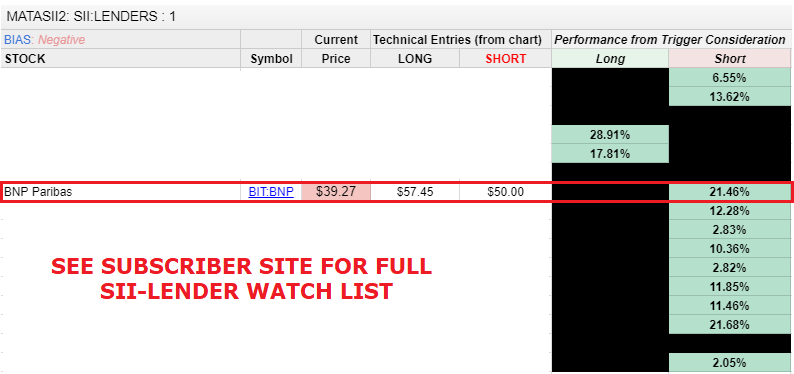
 MATASII WATCH LIST TRIGGERS / GAINS: 21.46%
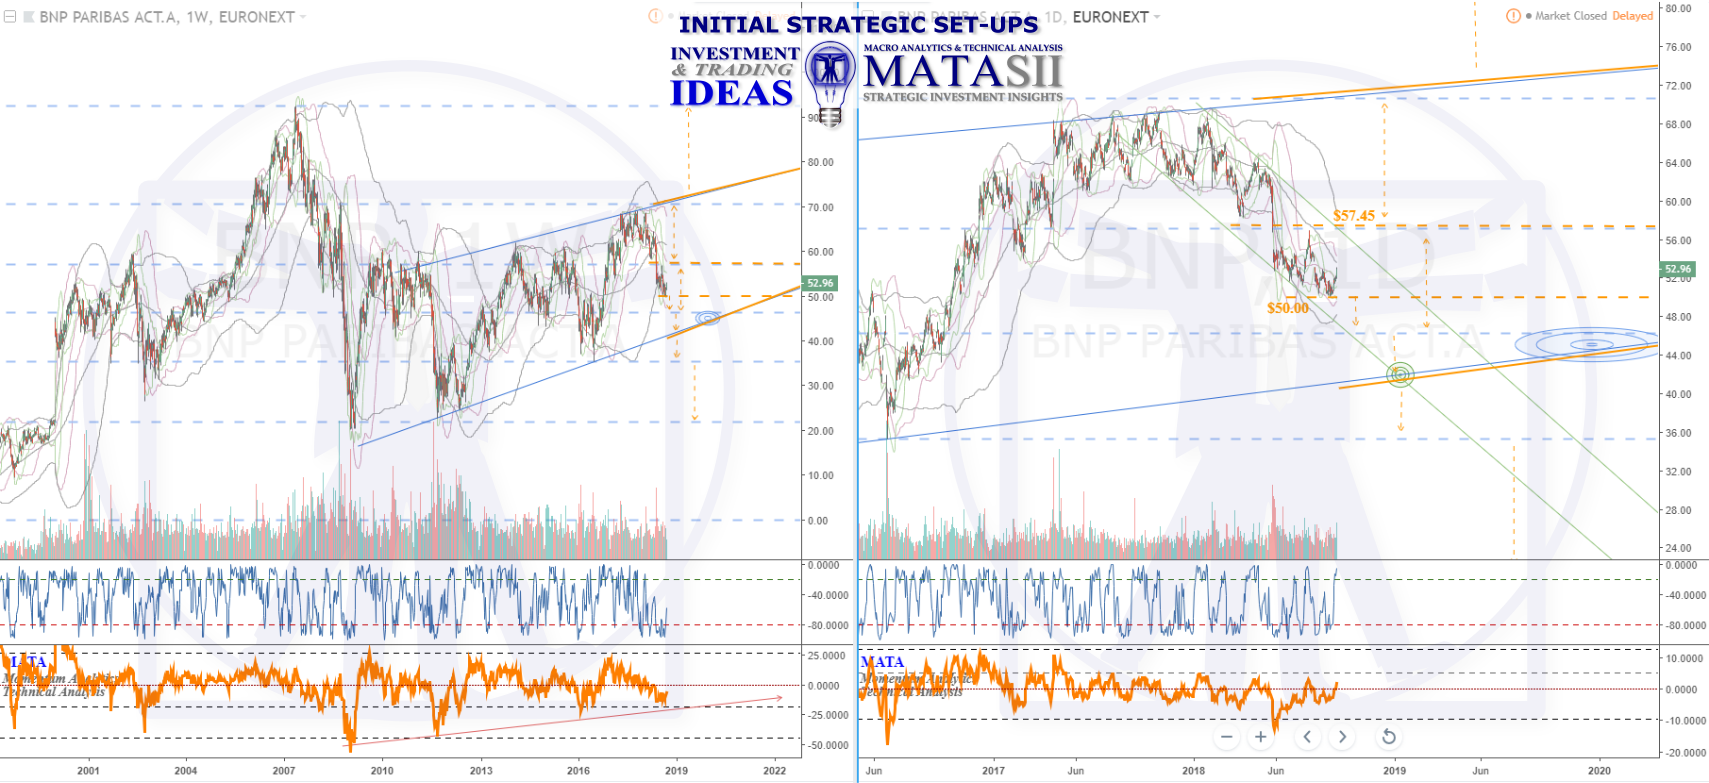
INITIAL BNP Paribas IDEA: September 20th, 2018
The long term weekly chart (left) shows BNP in a large sideways consolidation that is tilted to the positive. Solid orange highlights the support & resistance for the pattern, identifying them as significant technicals and potential trigger considerations if broken. Note the Fibonacci levels (horizontal blue dashed) and how the market has respected them fairly well. Once the pattern has been broken (up or down) we can look to the Fib levels as the next potential target level considerations.
The daily chart (right) gives us a closer look at more recent market action. The market can be seen coming off the patterns resistance in Jan of this year, and has been steadily falling since. Recent lows and the last Fib level above the market offer riskier technical opportunities: the market could continue to bounce around inside the blue weekly pattern. However if the technicals are broken, we can look to the next for potential opportunities. Dashed orange arrows highlight potential moves from one technical to the next.
In general we are watching for the larger pattern to hold or break; shorter term opportunities may also exist as the market bounces around inside the pattern. Both the blue weekly pattern s/r's as well as the Fibonacci levels should be watched for market reactions.