BoAML: EXCLUDING FAANG STOCKS THE S&P 500 WOULD BE NEGATIVE

-- SOURCE: 07-16-18 "BofA: Excluding FAANG Stocks, The S&P Would Be Negative" --
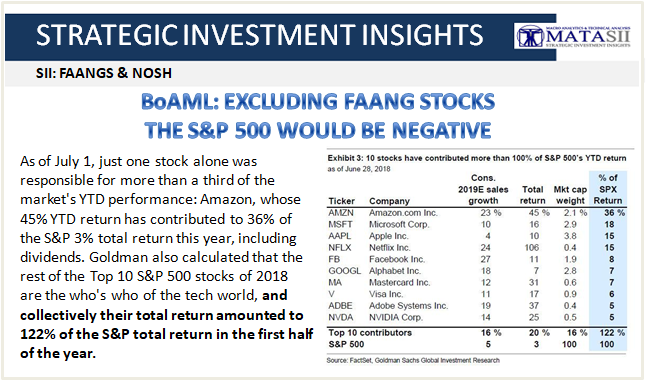
Two weeks ago, Goldman made a surprising finding: as of July 1, just one stock alone was responsible for more than a third of the market's YTD performance: Amazon, whose 45% YTD return has contributed to 36% of the S&P 3% total return this year, including dividends. Goldman also calculated that the rest of the Top 10 S&P 500 stocks of 2018 are the who's who of the tech world, and collectively their total return amounted to 122% of the S&P total return in the first half of the year.
And another striking fact: just the Top 4 stocks, Amazon, Microsoft, Apple and Netflix have been responsible for 84% of the S&P upside in 2018 (and yes, these are more or less the stocks David Einhorn is short in his bubble basket, which explains his -19% YTD return).

Now, in a review of first half performance, Bank of America has performed a similar analysis and found that excluding just the five FAANG stocks, the S&P 500 return in H1 would have been -0.7%.

FAANGs aside, here are the other notable sector observations about a market whose leadership has rarely been this narrow:
- Only three sectors outperformed in the 1H (Discretionary, Tech and Energy). Meanwhile, Staples and Telecom were the worst-performers in the 1H.
- Energy staged the biggest comeback in 2Q to become the quarter's best-performing sector after turning in among the worst returns in 1Q.
- Industrials and Financials notably underperformed in June, the 2Q, and the 1H while Discretionary and Energy outperformed in all three.

Looking at the entire first half performance, tech predictably was the biggest contributor to the S&P 500's 1H gain, contributing 2.6ppt or 98% of the S&P 500's 2.6% total return.

The broader market did ok: trade tensions, negative headlines, and the slow withdrawal of Fed liquidity contributed to volatility's return in June and earlier in February, but the S&P 500 still ended 2Q +3.4% and the 1H +2.6%, outperforming bonds and gold.
The Russell 2000 led the Russell 1000 by 4.9ppt in the 1H as small caps may have benefitted from expectations of a stronger US economy, a strong USD and the sense that smaller more domestic companies are shielded from trade tensions (where we take issue with this notion). However, mega-caps also did well: the "Nifty 50" largest companies within the S&P 500 beat the "Not-so-nifty 450" in the 2Q and the 1H. Non-US performed worst.
Some additional return details by asset class:
- US stocks outperformed most other asset classes in the 1H, including bonds, cash, and gold.
- Within equities, the US was the only major region to post positive returns, outperforming non-US equities by 6.1ppt in US dollar terms in the 1H.
- Amid concerns over global growth, a stronger dollar and trade, coupled with a strong US economic backdrop, small caps outperformed large caps in the 1H.
- Megacaps also did well: the "Nifty 50" mega-caps within the S&P 500 beat the "Other 450" stocks in 2Q and the 1H.

Performance by quant groups:
- Growth factors were the best-performing group in the 1H (+6.7% on average), leading Momentum/Technical factors (the second best-performing group) by 1.7ppt while Value factors were among the weakest.
- Despite the macro risks, the best way to make money was to stick to the fundamentals and own stocks with the highest Upward Estimate Revisions (+12.4% in the 1H), a Growth factor.
- Low Quality (B or worse) stocks beat High Quality (B+ or better) stocks in June, 2Q and the 1H. But both the lowest and highest quality stocks outperformed the rest of the market in all three periods.

The Russell 1000 Growth Index beat the Russell 1000 Value Index by 9ppt in the 1H, on track to exceed last year's 17ppt spread. Growth factors were the best-performing group in the 1H (+6.7% on avg.), followed by Momentum factors. But Momentum broke down in June, and June saw the 56th worst month out of 60, -1.4 standard deviations from average returns.

What about alpha?
Unfortunately for active managers, BofA notes that while pair-wise correlations remain lows, alpha remained scarce. The average pairwise correlation of S&P 500 stocks rose sharply in 1Q with the increased volatility which typically hurts stock pickers, but quickly came down below its long-term average of 26% in 2Q. However, performance dispersion (long-short alpha) continues to trail its long-term average.

What does this mean for active managers? According to BofA, never has the herding been this profound: since the bank began to track large cap fund holdings in 2008, managers have been increasing their tilts towards expensive, large, low dividend yield and low quality stocks. And today, their respective factor exposure relative to the S&P 500 is near its record level.

This is a risk because as we discussed recently, the threat is that as a result of an adverse surprise, "everyone" would be forced to sell at the same time. As BofA notes, "positioning matters more than fundamentals in the short-term, and this has been especially true around the quarter-end rebalancing. Since 2012, a long-short strategy of selling the 10 most overweight stocks and buying the 10 most underweight stocks by managers over the 15 days post-quarter-end would have yielded an average annualized spread of 90ppt, 15x higher than the average annualized spread of 6ppt over the full 90 days."

Keep an eye on the first FAANG today when Netflix reports after the close.