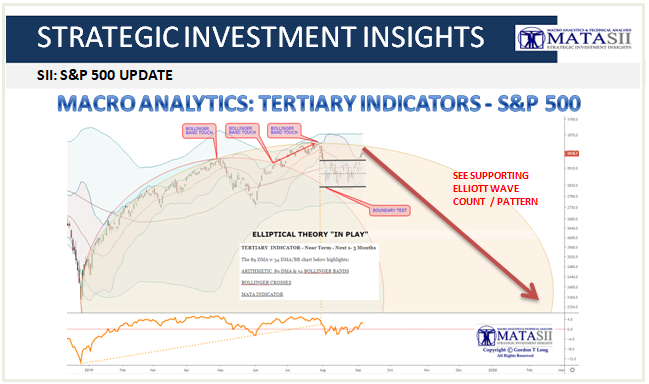
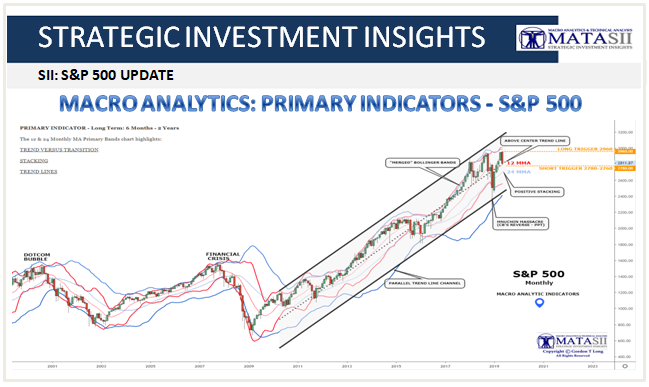
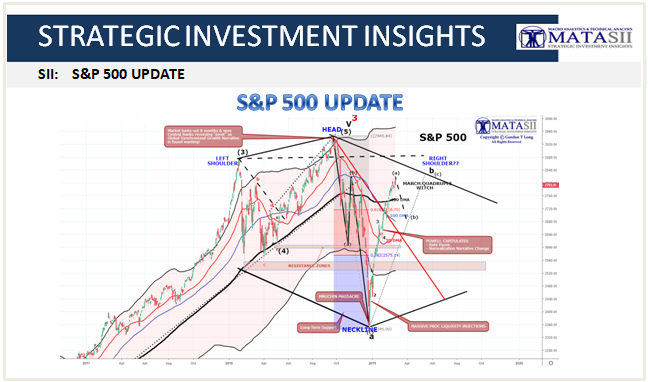
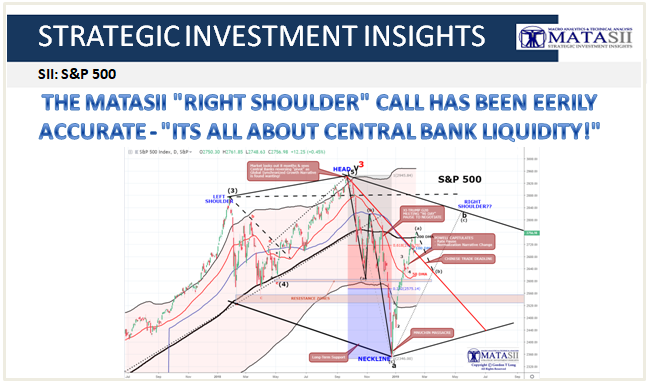
MACRO ANALYTICS: TERTIARY INDICATORS – S&P 500 TERTIARY INDICATOR CHARTS – S&P 500 The Tertiary Indicators use a 50 / 100 / 200 Daily Moving Average (DMA); The moving averages are reflect the 50 DMA above both the 100 and 200 with the 100 DMA approaching a “possible positive cross of the 200 DMA. The […]
MM Major Indices-SPX
MACRO ANALYTICS: SECONDARY INDICATORS – S&P 500
MACRO ANALYTICS: SECONDARY INDICATORS – S&P 500 The Secondary Indicators for the S&P 500 are still giving a positive market bias despite market turbulence and Monday’s largest sell-off since January 4th. SECONDARY INDICATOR CHARTS – S&P 500 The Secondary Indicator uses a 20 /40 / 80 Week set of Weekly Moving Averages. The first chart […]
MACRO ANALYTICS: PRIMARY INDICATORS – S&P 500
MACRO ANALYTICS: PRIMARY INDICATORS – S&P 500 The MATASII Macro Analytic Primary Indicators are still in an upward trend and as of 09-09-19 no violations have as yet occurred. The Primary Indicators for the S&P 500 are still giving a positive market bias despite market turbulence. We have broken our 2960 Trigger to the upside […]
IS THE S&P 500 SETTING US UP FOR A NEAR-TERM “REVERSE HEAD & SHOULDERS”?
IS THE S&P 500 SETTING US UP FOR A NEAR-TERM “REVERSE HEAD & SHOULDERS”? Below are some MATASII charts we will be discussing in this months LONGWave video which will be released to subscribers by mid-week. We have intentionally left the narrative for them to the video – Hope you watch for it! […]
MACRO ANALYTICS: PRIMARY INDICATORS – S&P 500
MACRO ANALYTICS: PRIMARY INDICATORS – S&P 500 The Primary Indicators for the S&P 500 are still giving a positive market bias despite market turbulence and Monday’s largest sell-off since January 4th. The MATASII Macro Analytic Primary Indicators are still in an upward trend and as of 05-13-19 no violations have as yet occurred despite a […]
ENDING DIAGONAL TERMINATION WAVES EVERYWHERE!
ENDING DIAGONAL TERMINATION WAVES EVERYWHERE! Elliott Wave’s “Ending Diagonals” The ending diagonal is a special type of wave that occurs in Wave 5 of an impulse, or the last wave of a correction pattern – Wave C of an A, B, C correction. This wave often occurs when the preceding move of the trend has […]
S&P 500 & DJIA ACHIEVES MATASII “RIGHT SHOULDER” PRICE TARGETS
S&P 500 & DJIA ACHIEVES MATASII “RIGHT SHOULDER” PRICE TARGETS The S&P 500 achieved the MATASII “Right Shoulder” target price and a critical overhead resistance level (shown by the black parallel) channel. We posted this chart with the right shoulder initially on December 24, 2018 along with a larger scale Elliott Wave Analysis There is a […]
MAJOR INDICES UPDATE: S&P 500
SII – S&P 500 UPDATE
SII – S&P 500 UPDATE A PUBLIC SOURCED ARTICLE FOR MATASII (SUBSCRIBERS-SII & PUBLIC ACCESS) READERS REFERENCE SII – S&P 500 UPDATE MATASII SYNTHESIS: We have achieved our expected price level for our Right Shoulder, however it is faster than expected, We suspect there will be “consolidation” movement to move ti further in time to the right […]
THE MATASII “RIGHT SHOULDER” CALL HAS BEEN EERILY ACCURATE – “ITS ALL ABOUT CENTRAL BANK LIQUIDITY!”
THE MATASII “RIGHT SHOULDER” CALL HAS BEEN EERILY ACCURATE – “ITS ALL ABOUT CENTRAL BANK LIQUIDITY!” Our SPX “Right Shoulder” call: For reference, we posted the chart below on December 18th, 2018 showing our initial positioning of the Right Shoulder: Here is what we saw in the way of Central Bank Liquidity