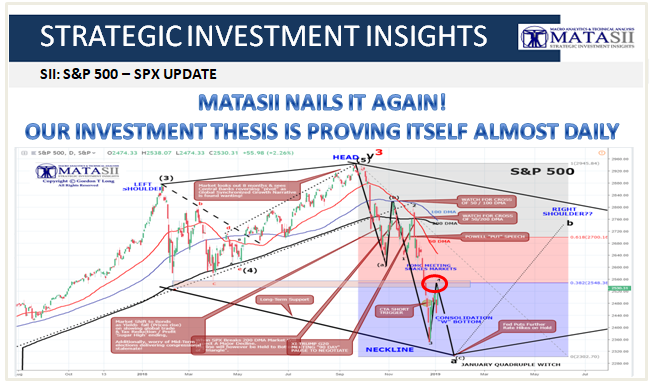
MATASII’S MACRO INVESTMENT THESIS IS PROVING ITSELF CORRECT (ALMOST DAILY) MATASII INVESTMENT THESIS The market problem is liquidity. Meaning global money (including collateral flow), Current Financial Market Actions all Correlate with this supposition and additionally correlate from the start of the crash on Oct 4th: CORRELATION 1: The ungodly Repo rate spike, CORRELATION 2: The drop […]
MM Major Indices-SPX
SEARCHING FOR LONGER TERM SUPPORT: MATASII SPX UPDATE
SEARCHING FOR LONGER TERM SUPPORT: MATASII SPX UPDATE NEAR TERM: MACRO ANALYTIC VIEW LONG TERM: ELLIOTT WAVE VIEW The longer term Elliott Wave Analysis below) is suggesting that the Right Shoulder may be higher than shown above. NOTE: The Wave 5 lift from the Neckline is not shown below. It requires a larger scale which […]
A LONG TERM QUARTERLY VIEW OF THE S&P 500 – NEARING MARKET SUPPORT
S&P 500 UPDATE: MATASII CHART HAS PERFORMED SURPRISINGLY WELL DURING VOLATILE WEEK
S&P 500 UPDATE: MATASII CHART HAS PERFORMED SURPRISINGLY WELL DURING VOLATILE WEEK On Nov 26th we published our updated S&P 500 chart. Here is the latest version as of 12-11-18 – Near perfect hits based on the MATASII process
S&P 500 SHOWING SIGNS OF A POTENTIAL REVERSE HEAD & SHOULDERS PATTERN
S&P 500 SHOWING SIGNS OF A POTENTIAL REVERSE HEAD & SHOULDERS PATTERN MATASII ANALYSIS A potential Reverse Head & Shoulders patterns is emerging in the S&P 500. It appears to logically fit when we connect the various convergence signals: The Upward Trend Line going back to the reversal bottom in the early spring, The Head […]
MATASII S&P 500 CALLS IN CHARTS – IT DOESN’T GET ANY BETTER THAN THIS!
MATASII S&P 500 CALLS IN CHARTS – IT DOESN’T GET ANY BETTER THAN THIS! THIS MORNINGS MATASII S&P 500 CHART MATASII SPX CALLS IN CHARTS As posted on May 10th, 2018 As posted on June 13th, 2018 As posted on September 6th, 2018 As posted on October 10th, 2018 THIS MORNINGS MATASII S&P 500 CHART […]
PATTERNS: ALL MAJOR INDICES TESTING POST-2016 TRENDLINE SUPPORT
SPX Technical Update 2017 02 25
Last update we were looking for a lift to 2300 for the SPX, where we were watching for potential resistance. This was based on Fibonacci extensions, and we can see the market has followed them well. Resistance did occur and the market held at the 2300 level for 2 weeks before finally breaking through. The […]