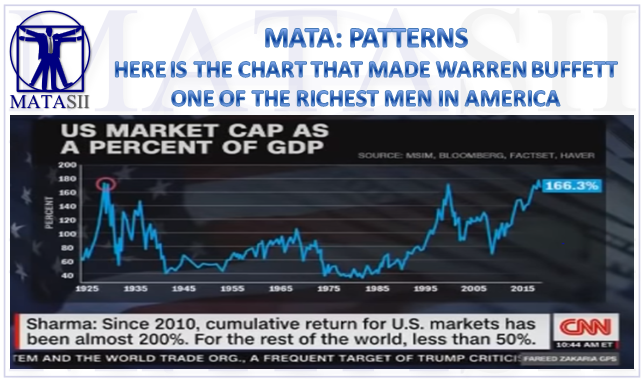
HERE IS THE CHART THAT MADE WARREN BUFFETT ONE OF THE RICHEST MEN IN AMERICA A PUBLIC SOURCED ARTICLE FOR MATASII (SUBSCRIBERS-RESEARCH & PUBLIC ACCESS ) READERS REFERENCE MATA: PATTERNS 12-03-18 – Extracted from: Global Macro Monitor – “The S&P Levels You Need To Know” The S&P Levels You Need To Know The chart is Warren Buffet’s favorite stock […]
MM Highlights Key charts
S&P 500 SHOWING SIGNS OF A POTENTIAL REVERSE HEAD & SHOULDERS PATTERN
S&P 500 SHOWING SIGNS OF A POTENTIAL REVERSE HEAD & SHOULDERS PATTERN MATASII ANALYSIS A potential Reverse Head & Shoulders patterns is emerging in the S&P 500. It appears to logically fit when we connect the various convergence signals: The Upward Trend Line going back to the reversal bottom in the early spring, The Head […]
GLOBAL MARKETS AT CRITICAL TECHNICAL INFLECTION POINT
GLOBAL MARKETS AT CRITICAL TECHNICAL INFLECTION POINT A PUBLIC SOURCED ARTICLE FOR MATASII (SUBSCRIBERS-RESEARCH & PUBLIC ACCESS ) READERS REFERENCE MATA: PATTERNS 11-02-18 – Dana Lyons
THE LAST TIME YIELDS ROSE THIS FAST THE MARKET DROPPED DOUBLE DIGITS
THE LAST TIME YIELDS ROSE THIS FAST THE MARKET DROPPED DOUBLE DIGITS “We are at some sort of critical moment, a crossroads, for bond and equity markets,” Marie Owens Thomsen, global head of economic research at Indosuez Wealth Management, said noting that while U.S. 10-year yields at 2% unequivocally favored equity investment, this was not […]
ON TRACK FOR $1 TRILLION IN STOCK BUYBACKS IN 2018 – CORRELATION INTACT
ON TRACK FOR $1 TRILLION IN STOCK BUYBACKS IN 2018 – CORRELATION INTACT According to TrimTabs, $827 billion in stock buybacks have been announced so far this year. Furthermore, if stock buyback activity continues to rise in the fourth quarter, it is likely that we will reach $1 trillion in stock buybacks in 2018. The […]
THE GLOBAL DIVERGENCE DRIVING THE US$ HIGHER
THE GLOBAL DIVERGENCE DRIVING THE US$ HIGHER — SOURCE: 09-28-18 Authored by Ritesh Jain via WorldOutOfWhack.com, — “Trump’s Imperial Circle (Or The Most Important Chart In The World)” — Macrostrategy Partnership writes about perhaps the most important chart of the decade… Policy divergence is now set to accelerate the US$ rally. The Fed is in a battle […]
EXPECT PROFIT MARGINS BEGINNING IN 2019 TO BE A PROBLEM
EXPECT PROFIT MARGINS BEGINNING IN 2019 TO BE A PROBLEM — SOURCE: 08-19-18 – “Tech Firms Account For 60% Of Profit Margin Growth In The Past 20 Years” — It’s official: with the best earnings season since 2010 now essentially over, the numbers are in and S&P500 profit margins are at an all time high […]
WHO DO YOU TRUST??
WHO DO YOU TRUST?? Who do you trust? US Macro Data, The Nasdaq (and its 4 or 5 stock driver), or The NYSE Composite of over 2000 stocks and $23 trillion in market cap… NOTICE THAT THE NYSE COMPOSITE IS BASICALLY FLAT SINCE YEAR BEGINNING
IG BOND SPREADS SENDING A CLASSIC BEARISH STOCK SIGNAL
IG BOND SPREADS SENDING A CLASSIC BEARISH STOCK SIGNAL — SOURCE: 07-02-18 Seeking Alpha – “A Bearish Stock Signal From IG Spreads” — KEY MESSAGE As the corporate bond market goes, so goes the stock market Over the past three decades, the directionality of investment grade corporate bond spreads has been strongly related to equity […]
BoAML: 40% OF THE LAST 20 YEARS OF MARGIN EXPANSION WAS FROM GLOBALIZATION
BoAML: 40% OF THE LAST 20 YEARS OF MARGIN EXPANSION WAS FROM GLOBALIZATION — SOURCE: 06-21-18 ZeroHedge – “BofA: 40% Of Margin Expansion In The Last 20 Years Is From Globalization” — Roughly around the time David Rosenberg “calculated” the contribution of the Fed’s unprecedented monetary policy on the S&P (which he estimated at roughly […]