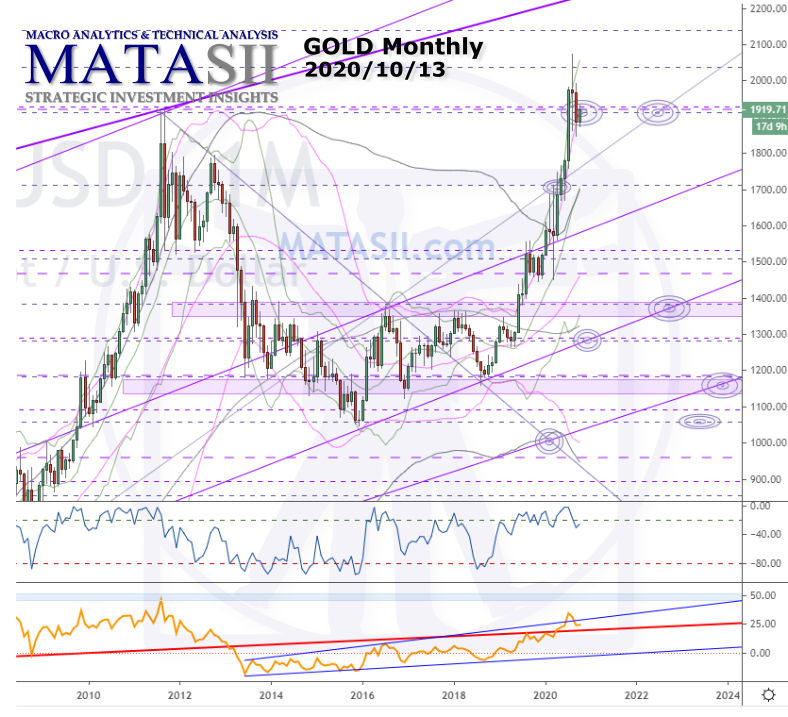
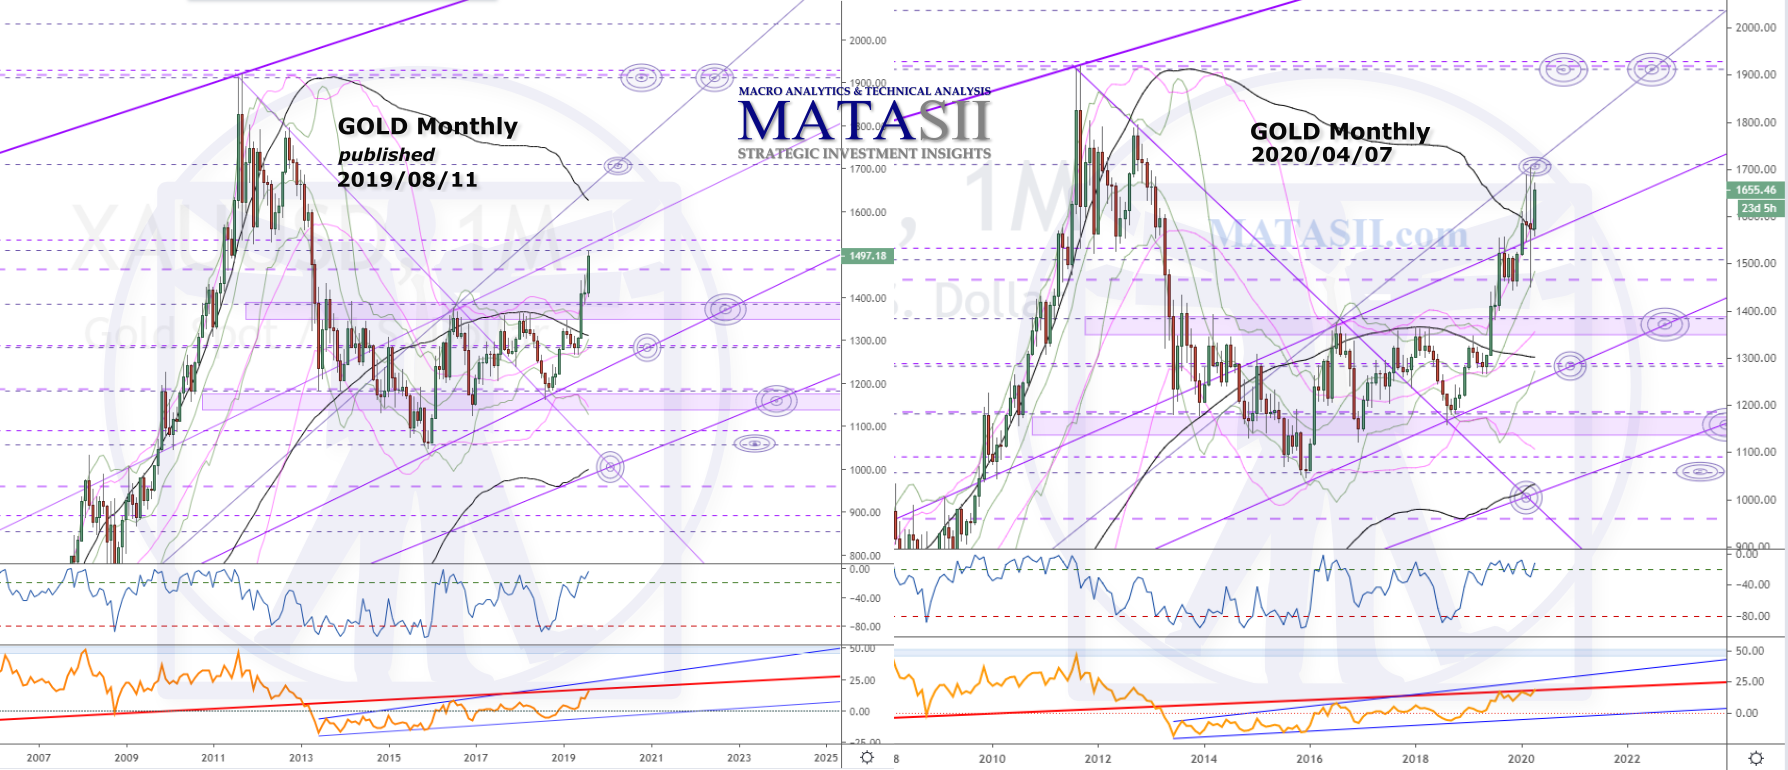
TRIGGER$ Technical Analysis Market Road Maps | HPTZ Methodology COMMODITIES Gold Previous Monthly Previous Monthly Updates: Chart initially created 2019/08/11. Below you can see previous updates as we followed the market; last image below is the current market as of 2020 10 13. Previous Weekly We also offered a weekly perspective, with potential market moves […]
Trig TA
SPX Update – Technical Alert
Economic & Technical Analysis for the Active Trader Technical Analysis Market Road Maps | HPTZ Methodology Extensive Technical Analysis and Market Road Maps for major indexes, commodities, and FOREX. The High Probability Target Zones Methodology (HPTZ) is used to locate significant supports / resistances, patterns, break-out opportunities and other technicals of importance. The method creates a market “road […]
GOLD Hits 8 Month Target
TRIGGER$ Technical Analysis Market Road Maps | HPTZ Methodology COMMODITIES Gold Previous Monthly Our last technical update for Gold (Aug 11th, 2019) offered the monthly chart below (left) for consideration. The current view (right) shows the market holding and bouncing around between significant technicals previously identified; then breaking resistance and lifting in to a target […]
OIL Dump Captured, What’s Next?
TRIGGER$ Technical Analysis Market Road Maps | HPTZ Methodology COMMODITIES Oil OIL DUMP CAPTURED: Our previous oil update (Aug 5th/2019) can be seen on the left, with the current market on the right. At that time, the market was sitting on a significant Fib ratio, inside an obvious wedge or triangle pattern. There were only […]
S&P 500 SHOWING SIGNS OF A POTENTIAL REVERSE HEAD & SHOULDERS PATTERN
S&P 500 SHOWING SIGNS OF A POTENTIAL REVERSE HEAD & SHOULDERS PATTERN MATASII ANALYSIS A potential Reverse Head & Shoulders patterns is emerging in the S&P 500. It appears to logically fit when we connect the various convergence signals: The Upward Trend Line going back to the reversal bottom in the early spring, The Head […]
SPX Update 2018 08 06
Last update we gave you this chart, identifying significant technical supports, resistances, and levels. Here is the current view of the same chart. The market has lifted, remaining within the two orange dashed highlighted technicals. No significant changes or moves occurred, this chart remains valid and we continue to watch it. Note the addition of […]
VIX BACK TO 13 & BREAKS BELOW KEY 200 DMA TECHNICAL SUPPORT
VIX BACK TO 13 & BREAKS BELOW KEY 200 DMA TECHNICAL SUPPORT — SOURCE: 05-10-18 ZeroHedge – “VIX Breaks Below Key Technical Support” — Despite the world’s elites decrying President Trump’s decision to withdraw from the Iran nuclear deal – fearful of the kind of Middle East instability already witnessed last night between Israel and […]
PATTERNS: ALL MAJOR INDICES TESTING POST-2016 TRENDLINE SUPPORT
SPX Update 2018 03 26
Last update (2017 10 17) we noted a large expanding wedge pattern bounding the markets lift since 2009 and the increasing potential for extreme volatility. The S&P has since lifted significantly, slightly breaking up through the wedge patterns resistance and touching the next Fibonacci level. After a quick run to new highs the market has […]