Economic & Technical Analysis for the Active Trader Technical Analysis Market Road Maps | HPTZ Methodology Extensive Technical Analysis and Market Road Maps for major indexes, commodities, and FOREX. The High Probability Target Zones Methodology (HPTZ) is used to locate significant supports / resistances, patterns, break-out opportunities and other technicals of importance. The method creates a market “road […]
Trig TA SPX
SPX Update 2018 08 06
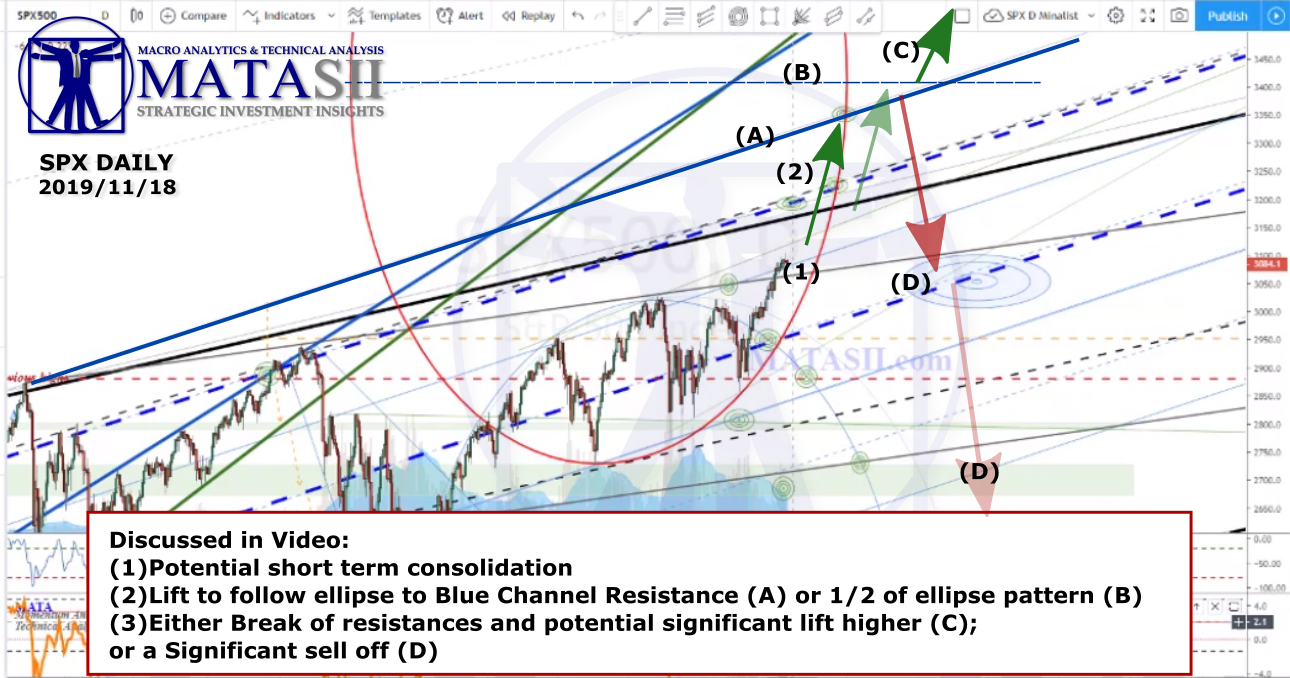
Last update we gave you this chart, identifying significant technical supports, resistances, and levels. Here is the current view of the same chart. The market has lifted, remaining within the two orange dashed highlighted technicals. No significant changes or moves occurred, this chart remains valid and we continue to watch it. Note the addition of […]
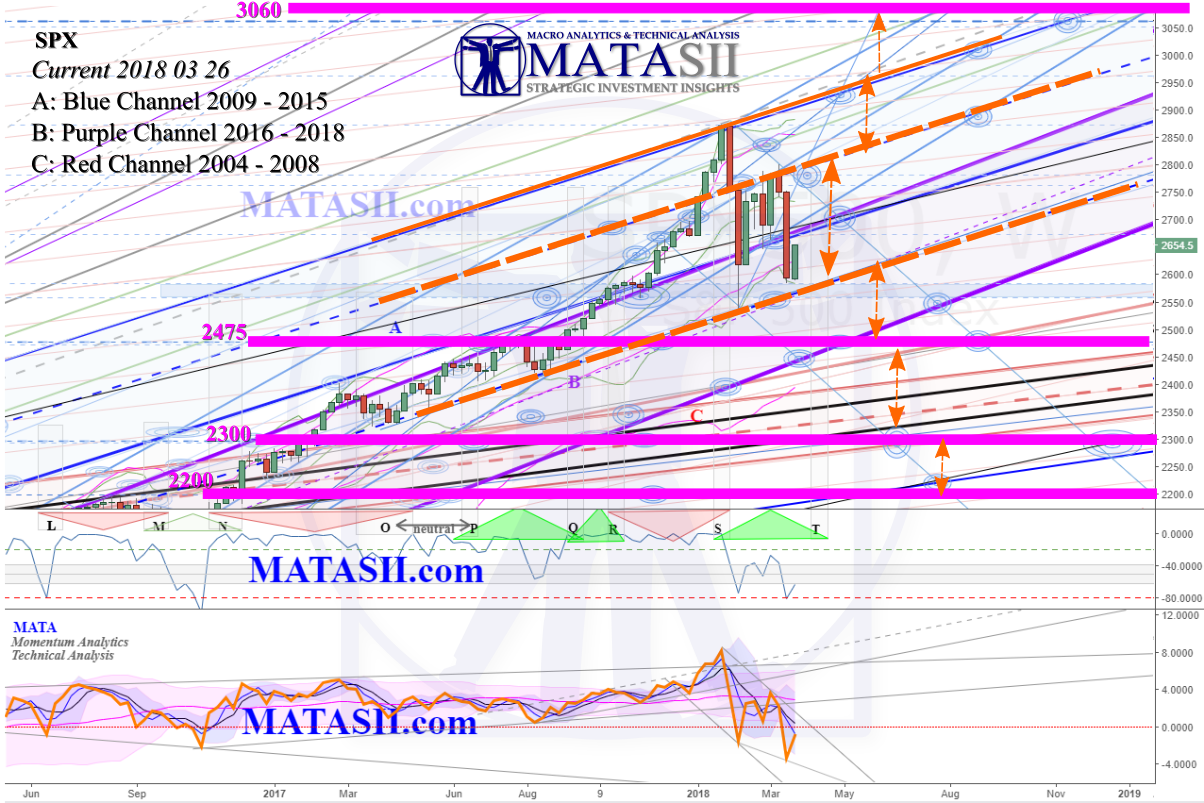
SPX Update 2018 03 26
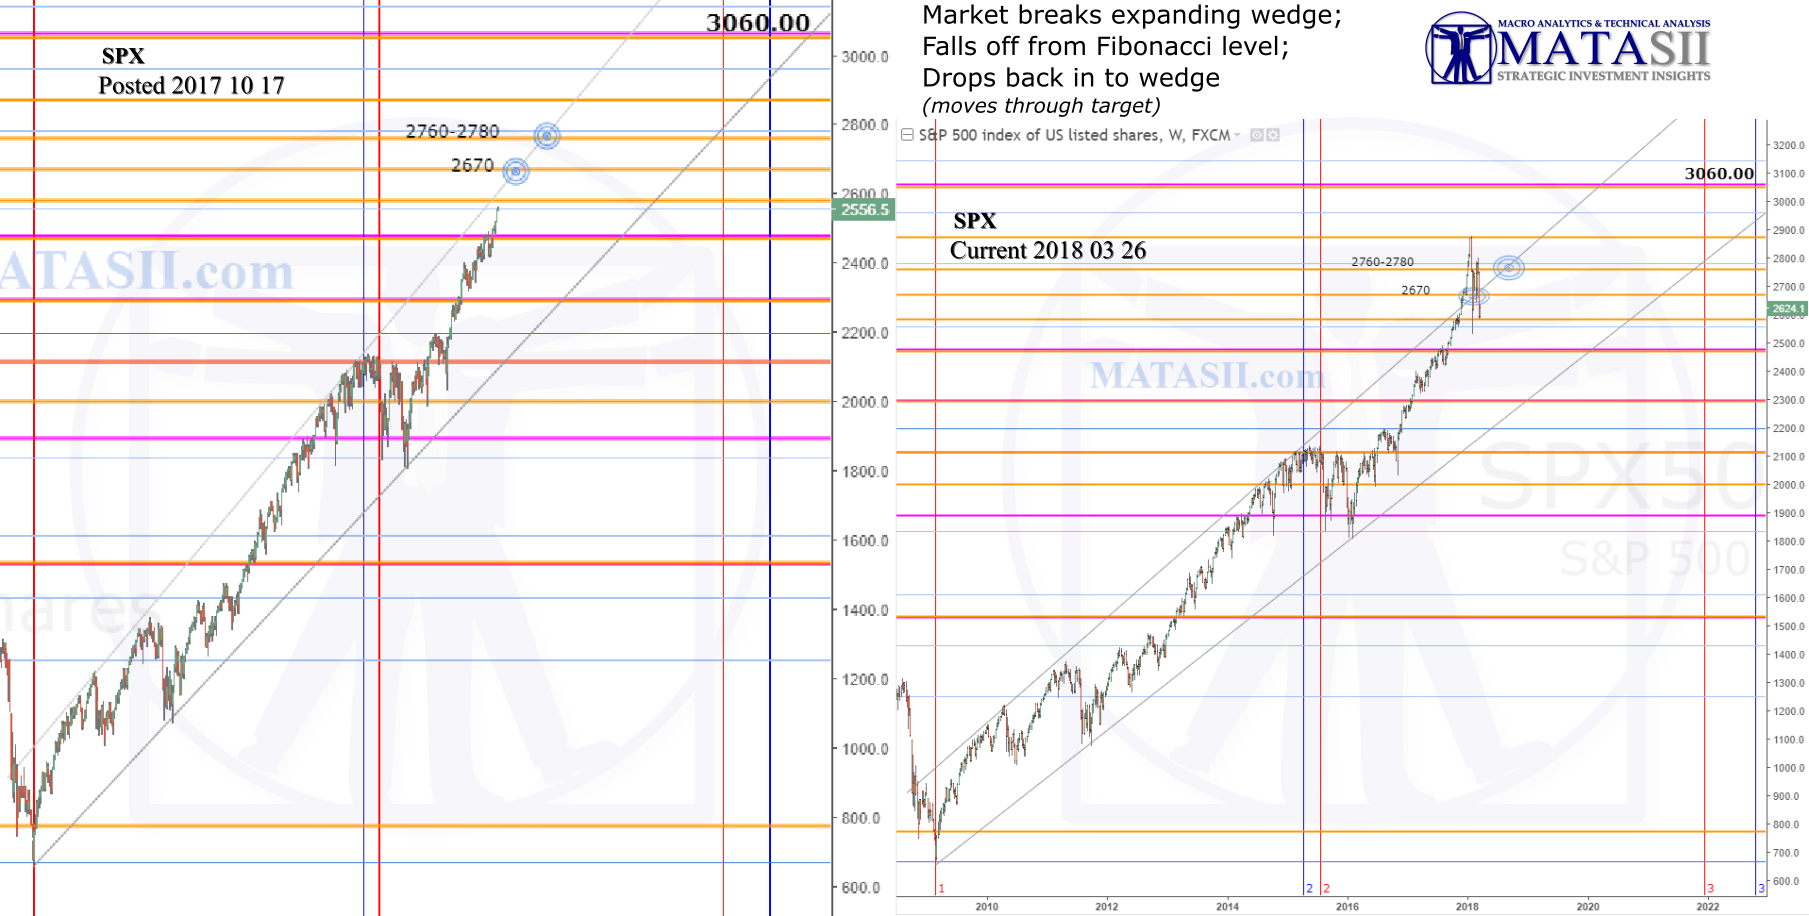
Last update (2017 10 17) we noted a large expanding wedge pattern bounding the markets lift since 2009 and the increasing potential for extreme volatility. The S&P has since lifted significantly, slightly breaking up through the wedge patterns resistance and touching the next Fibonacci level. After a quick run to new highs the market has […]
SPX Technical Update 2017 10 17
If you have been following any of Gordon’s Macro work then you are aware that there is a disconnect between the current market and reality. One of the many issues associated with this is trying to determine how high the market(s) will go. With respect to the S&P, it is also making new market highs: […]
SPX Technical Update 2017 06 19
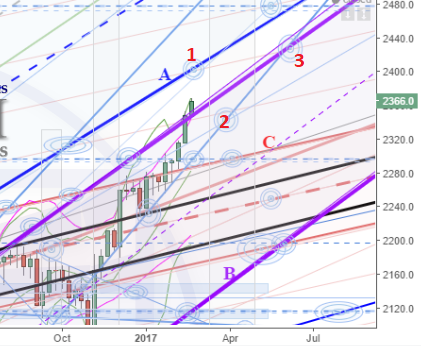
Weekly: the chart to the right shows what we had given last update, the red numbers 1-3 have been added and highlight the targets the market moved through. You can see these in the current weekly chart below, with the market sitting at target 3. Since last update the market lifted in to HPTZ1; pulled […]
SPX Technical Update 2017 02 25
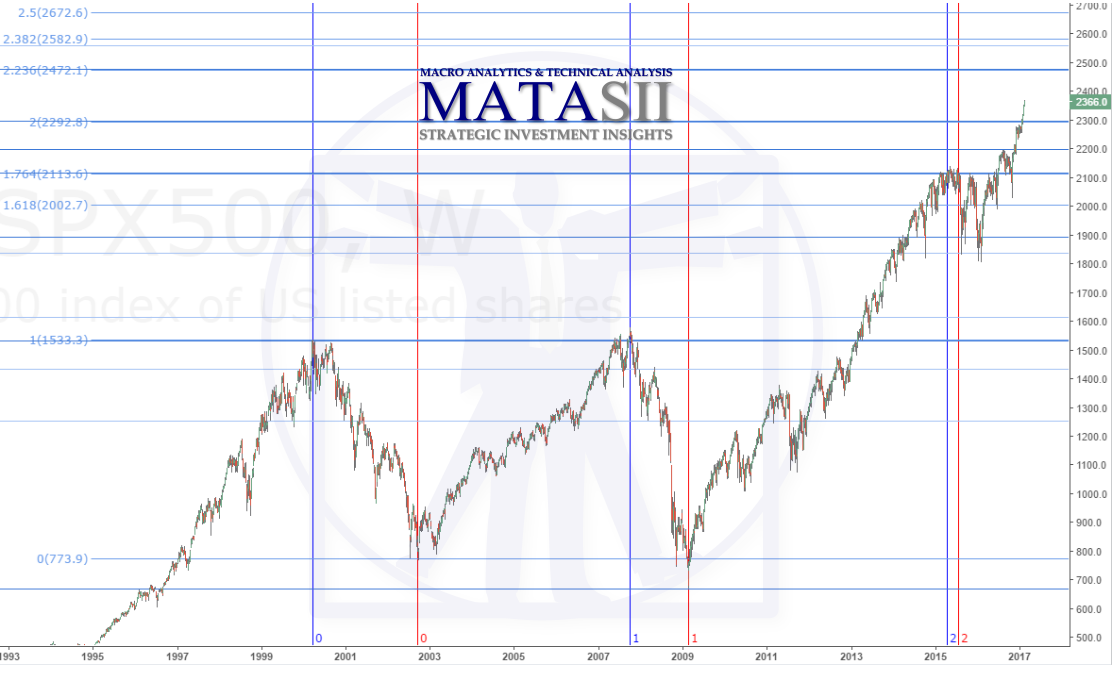
Last update we were looking for a lift to 2300 for the SPX, where we were watching for potential resistance. This was based on Fibonacci extensions, and we can see the market has followed them well. Resistance did occur and the market held at the 2300 level for 2 weeks before finally breaking through. The […]
SPX Nov 27 2016
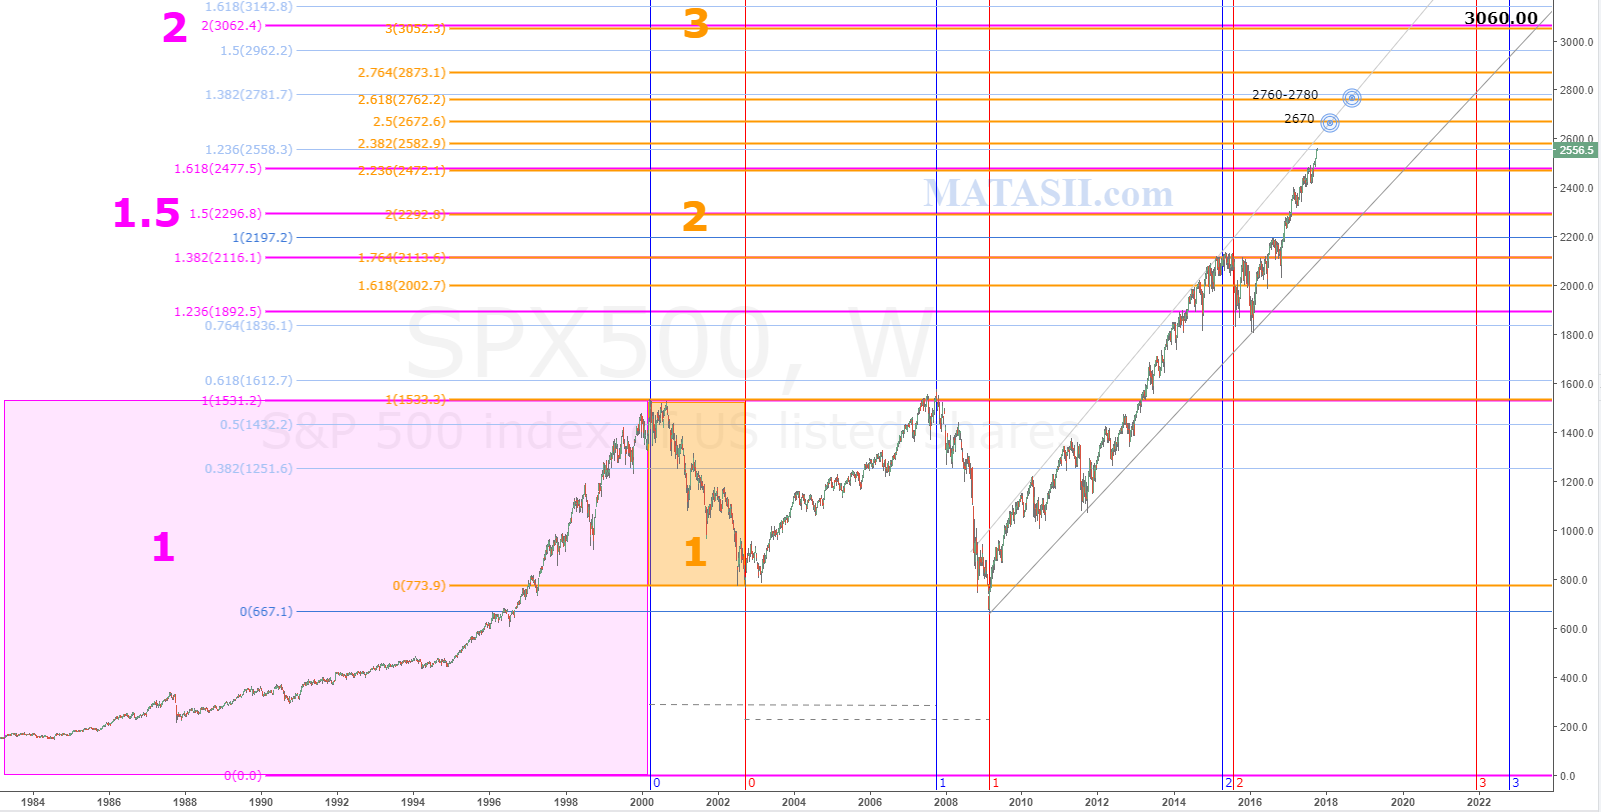
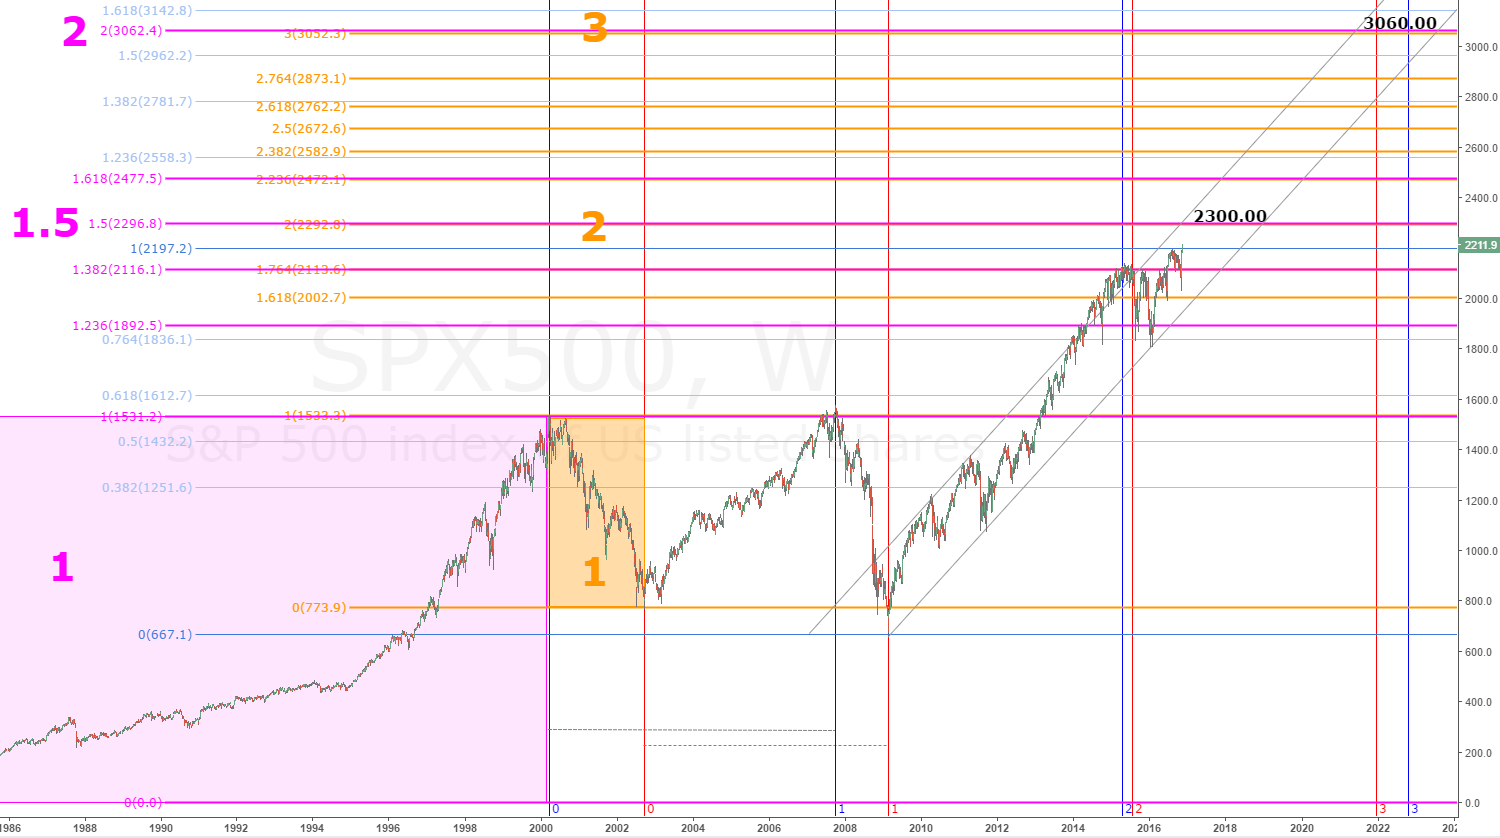
SPX FIB PRICE & TIME ANALYSIS Our fist chart for SPX is taking a look at some Fibonacci price & time objectives. We’ve seen this chart before: take a look at the previous post where I explain the current Fib level we have reached and how it was derived. If the market continues to lift […]
SPX Update 2016 08 28
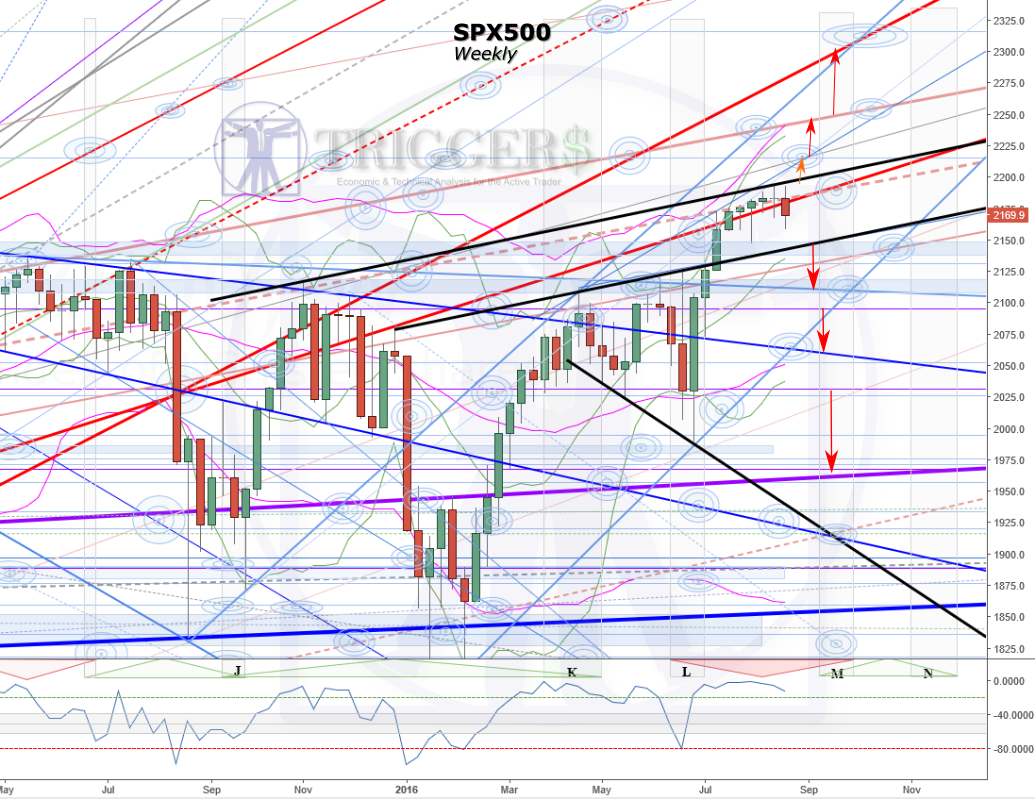
Last update I had said “Strong and quick lift that has occurred since the end of June will need to have a correction soon to make up time.” The market was just coming up to the red-dashed s/r at that time and we can see that it has consolidated at this since. Black trend lines […]