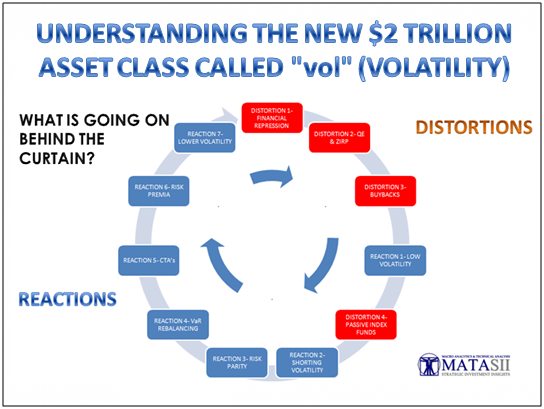
IN DEPTH: TRANSCRIPTION – REPRICING OF RISK BEGINS COVER AGENDA SLIDE 5 We started warning of the huge problems we saw with volatility as measured by the VIX as part of our October LONGWave video entitled “Powering the ‘ETF Dynamo'”. To us, the once “cottage industry” of shorting the VIX was becoming so pronounced […]
Trig TA
UNDERSTANDING THE NEW $2 TRILLION ASSET CLASS CALLED “vol” (VOLATILITY)
UNDERSTANDING THE NEW $2 TRILLION ASSET CLASS CALLED “vol” (VOLATILITY) MONETARY MALPRACTICE I put this schematic together not long after the 2008 Financial Crisis as we were witnessing the emerging approach the Federal Reserve was taking to its resolution. The last update of the diagram was in 2012 (note the 2012 copyright at the bottom) […]
USD & Market Correlations
Our recent USD technical update showed a potential for the drop since the beginning of 2017 to come to an end. Several significant technicals can be seen near the current market location and there is a possibility for the USD to find support some time in the near future. Here is a look at a […]
“SELLING VOLATILITY”- VIX SHIFTS FROM A FEAR INDEX TO A GREED INDEX
“SELLING VOLATILITY”- VIX SHIFTS FROM A FEAR INDEX TO A GREED INDEX –SOURCE: 11-29-17 Peter Tchir, Forbes.com, – “VIX – From Fear Index To Greed Index” — We have all heard the VIX or volatility index referred to as the Fear Index or Fear Gauge. Rising VIX was meant to signal fear in the markets. That is how most […]
WHAT THE CAPE/VIX RELATIONSHIP TELLS US IS LOOMING AHEAD
WHAT THE CAPE/VIX RELATIONSHIP TELLS US IS LOOMING AHEAD We were in the process of writing about the technical pattern in the VIX when we came across some research by Peter Schiff of Euro Pacific Capital illustrating the historical correlation of the CAPE/VIX Ratio to US Recessions go back to 1990. We have been warning about a […]
SPX Technical Update 2017 10 17
If you have been following any of Gordon’s Macro work then you are aware that there is a disconnect between the current market and reality. One of the many issues associated with this is trying to determine how high the market(s) will go. With respect to the S&P, it is also making new market highs: […]
USD Technical Update 2017 10 16
Long Term View Last update we reviewed a perspective we have been following for a number of years : Of note are the two large ellipses: these are identical, with the ellipse on the right being a copy of the ellipse on the left, shifted over and moved down slightly. Also to note is the […]
SPX Technical Update 2017 06 19
Weekly: the chart to the right shows what we had given last update, the red numbers 1-3 have been added and highlight the targets the market moved through. You can see these in the current weekly chart below, with the market sitting at target 3. Since last update the market lifted in to HPTZ1; pulled […]
TNX 10yr Technical Update
Weekly: The last time we updated the TNX we were watching for a potential move lower to fill a gap (yellow highlight). This occurred, and the market now sits at several significant technicals. The pattern for the lift since June 2016 could be seen as a potential expanding wedge, with the market currently sitting at […]
USD Technical Update
Long Term Weekly View This is a perspective we have been following for a few years now. Both blue ellipses are identical, the second a copy & paste of the 1st, moved over and down slightly. Although the lift from 2009 is no longer riding the ellipse edge, this edge is still a significant technical […]