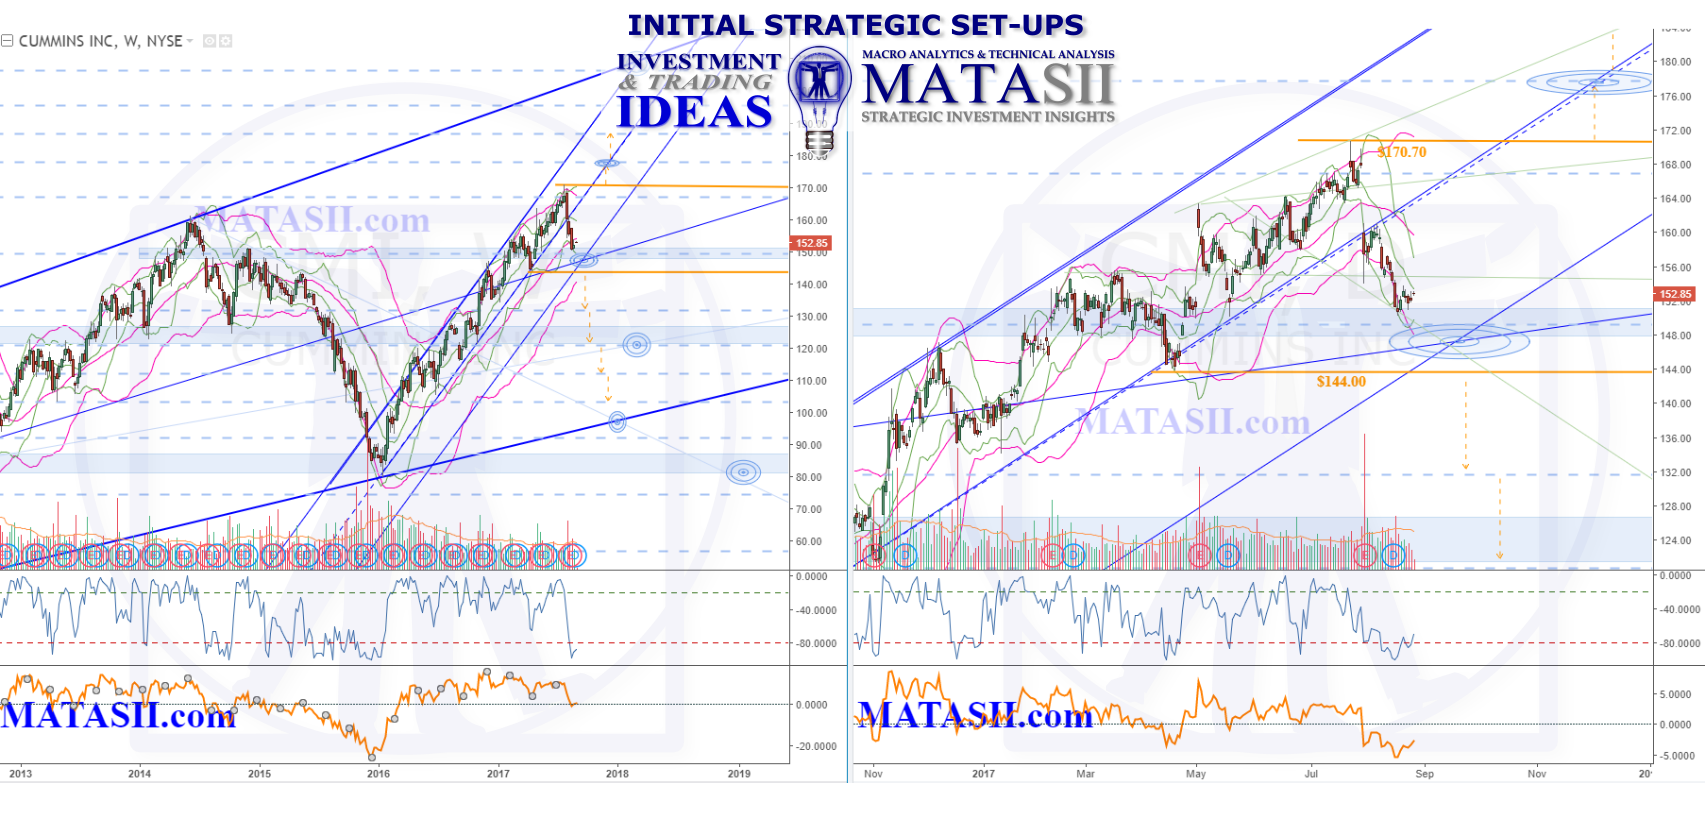
CMI has recently broken through a long term weekly channel that had contained the market during its lift through 2016-17. This may be the warning or the start of a bigger move down or just a correction to the large lift since 2016. Significant supports are near by and we will be watching to see how the market reacts. Breaking through these and below the orange highlight offer potential opportunities for a move lower. From there we would be looking towards the next blue s/r zones and the blue dashed Fibonacci levels for market reactions. Technically this could move back to the larger weekly pattern's bottom s/r or the lows of 2016.
IF support is found, waiting for the previous highs to be moved over offers potentially less risk: other markets have given us double tops. It could be said that the weekly may be giving us a double top right now, we should keep this possibility in mind for the daily time frame as well. IF the current weakness is a correction to the lifting from 2016, then more lift, technically to weekly patterns expanding wedge top resistance is possible.
Note the horizontal blue dashed Fibonacci levels throughout the markets movements, they have been a good guide in the past and can be used again for possible trigger and target level considerations. (More effective when combined with other technicals and technical methods).