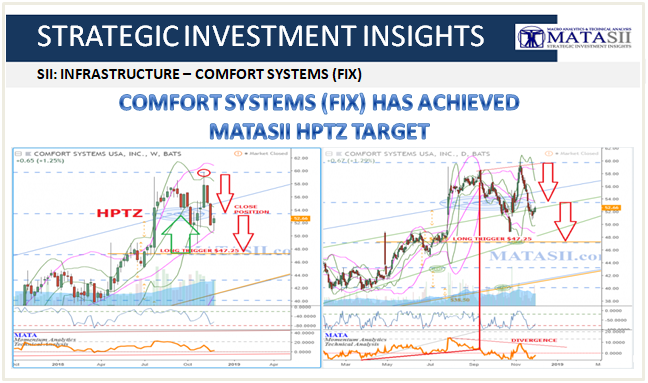
COMFORT SYSTEMS (FIX) HAS ACHIEVED MATASII HPTZ TARGET
FIX CHART AS OF CLOSE 11-30-18

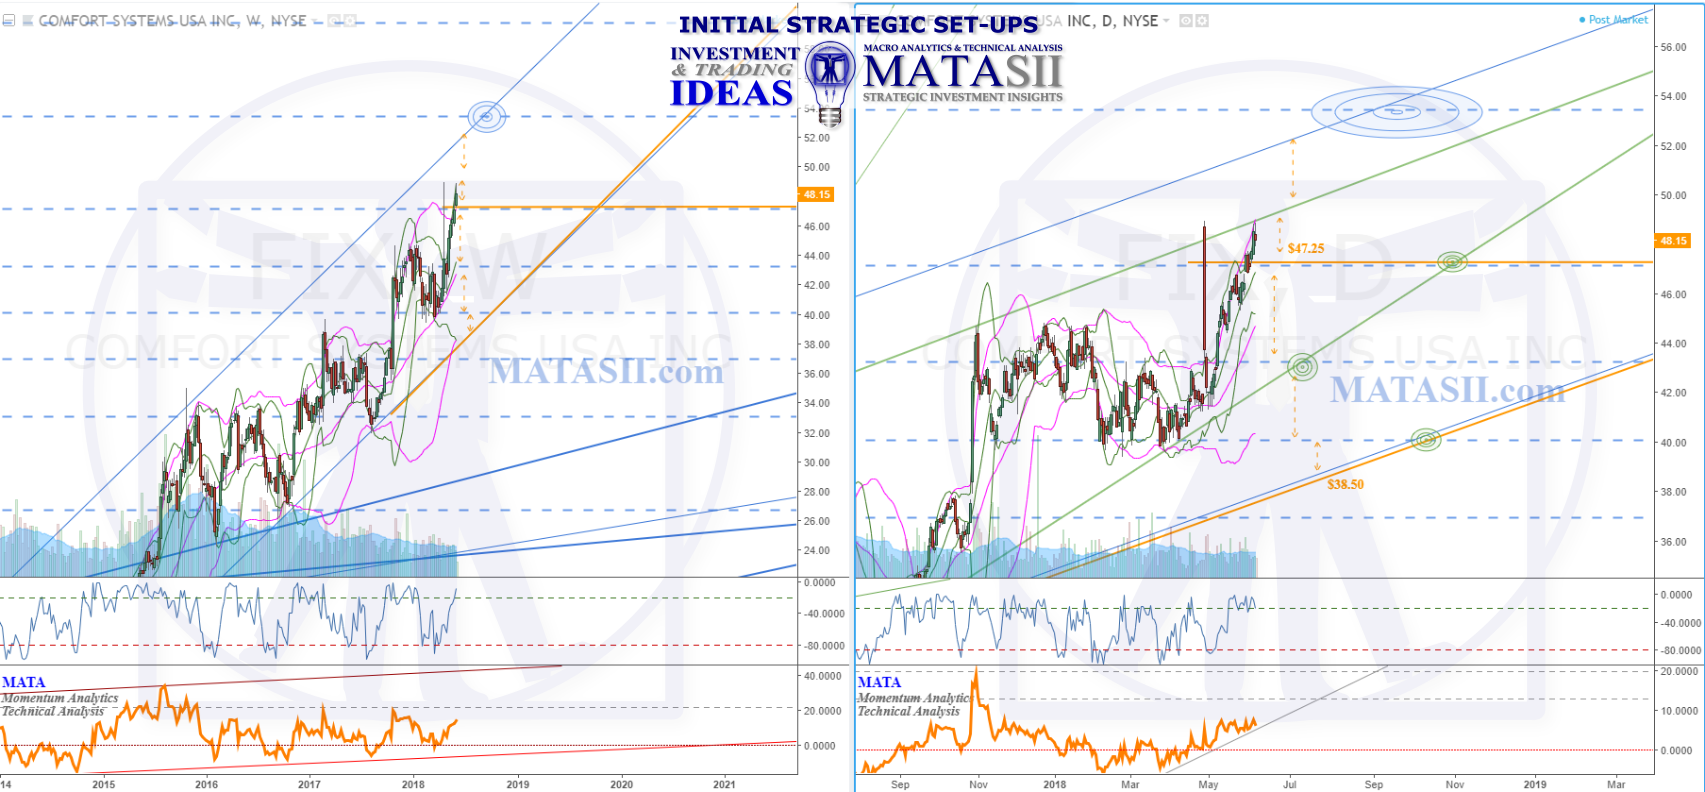
INITIAL FIX Comfort Systems USA IDEA: June 6th, 2018
FIX has been in a steady lift since 2012; the weekly chart (left) shows a channel and Fibonacci levels it has been respecting on the way up. A closer look on the daily chart (right) shows a green wedge bounding recent market action.
Note the market has been respecting Fibonacci levels: these can be used as guidelines and potential trigger considerations for longer term moves. The market has also recently been moving within a green wedge and we need to consider this as well as we look for potential market moves. While FIX has just broken above a Fib level, indicating we can look to the next for a target level, it is also at the resistance for the wedge pattern, suggesting we could see a pullback first, potentially back to the previous Fib level and the support of the wedge pattern. BOTH are occurring - Fib levels and the wedge pattern; and both need to be considered as we weigh the possibilities.
A break above the green wedge would indicate strength and more likely lift; otherwise we can watch for the pattern to continue within the wedge until it is broken (up or down). Long term short considerations would have less risk if we were to wait until the blue weekly trend support is moved under.