CRACKS IN CREDIT AND POTENTIAL CASCADING VaR CONSEQUENCES
We warned in last months UnderTheLens video “
The Crowd Will Be Wrong About The Coming Market Top!” that it was important to watch the Credit Markets for early warnings and confirmations. Traditionally, this has been where the cracks first appear. Below we show this once more appears to be the case.
This month’s “
China Contagion” video only compounds the problems outlined in our recent three part series on a potential near term Market Top!
|
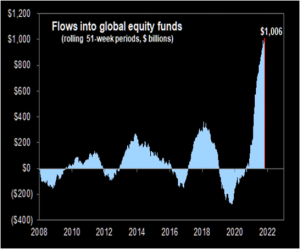 HARD TO IMAGINE THIS INFLOW STREAK BEING REPEATED! HARD TO IMAGINE THIS INFLOW STREAK BEING REPEATED!
As thew chart to the right shows, Global Equities logged over $1 Trillion dollars worth of inflows during the last 51 weeks and the start of positive vaccine news.
For context, the prior best rolling 51 week record was +$250 Billion. 2021 is 4x larger than the next best yearly inflow.
WELL IT WON’T!
The vast majority Global Central Banks have already shifted tightening with the Federal Reserve and ECB noticeably lagging as they are only now beginning to slow their rate of liquidity injections (out of fear of igniting another “Taper Tantrum” as occurred in 2013).
The Bottom Line: The peak level on the chart to the right is going to fall precipitously!
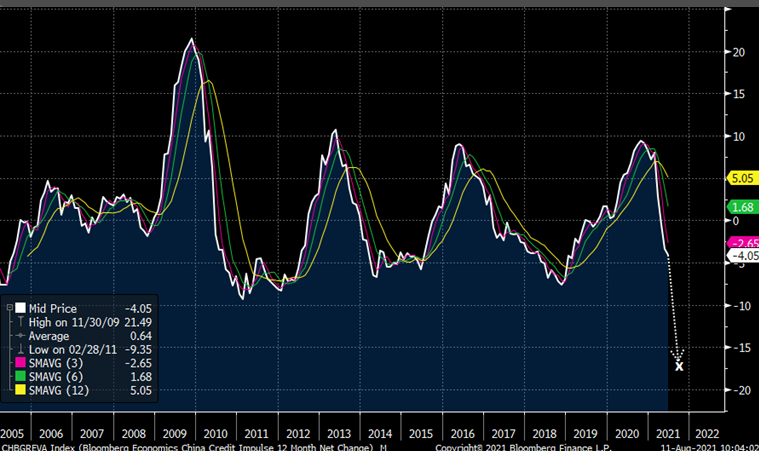
As this month’s video on “China Contagion” illustrated, the world can not count on China to save global credit growth as it did in 2008 and on a number of instances over the last decade. Matter of fact it may be a drag!
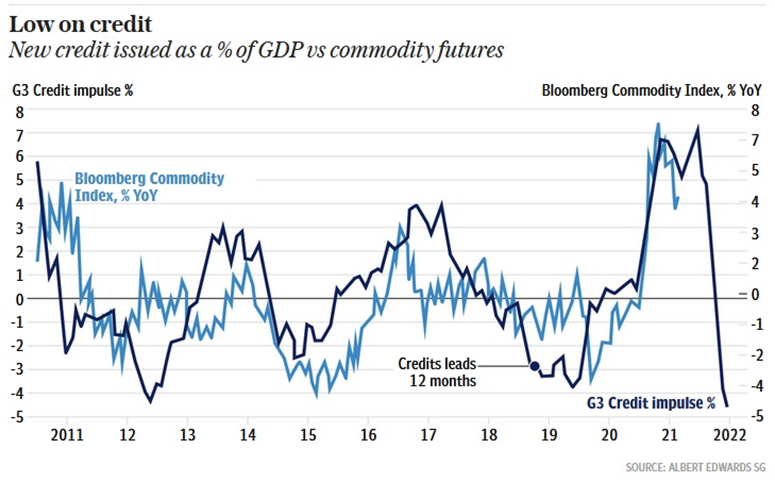
The Chinese Credit Impulse show below, which leads the US by 12 months, says its impact is only now being felt and will be for the next year (minimally). The G3 credit impulse says credit contraction has already arrived!
|
|
|
NOW AT OUR “END OF OCTOBER” TARGET ZONE
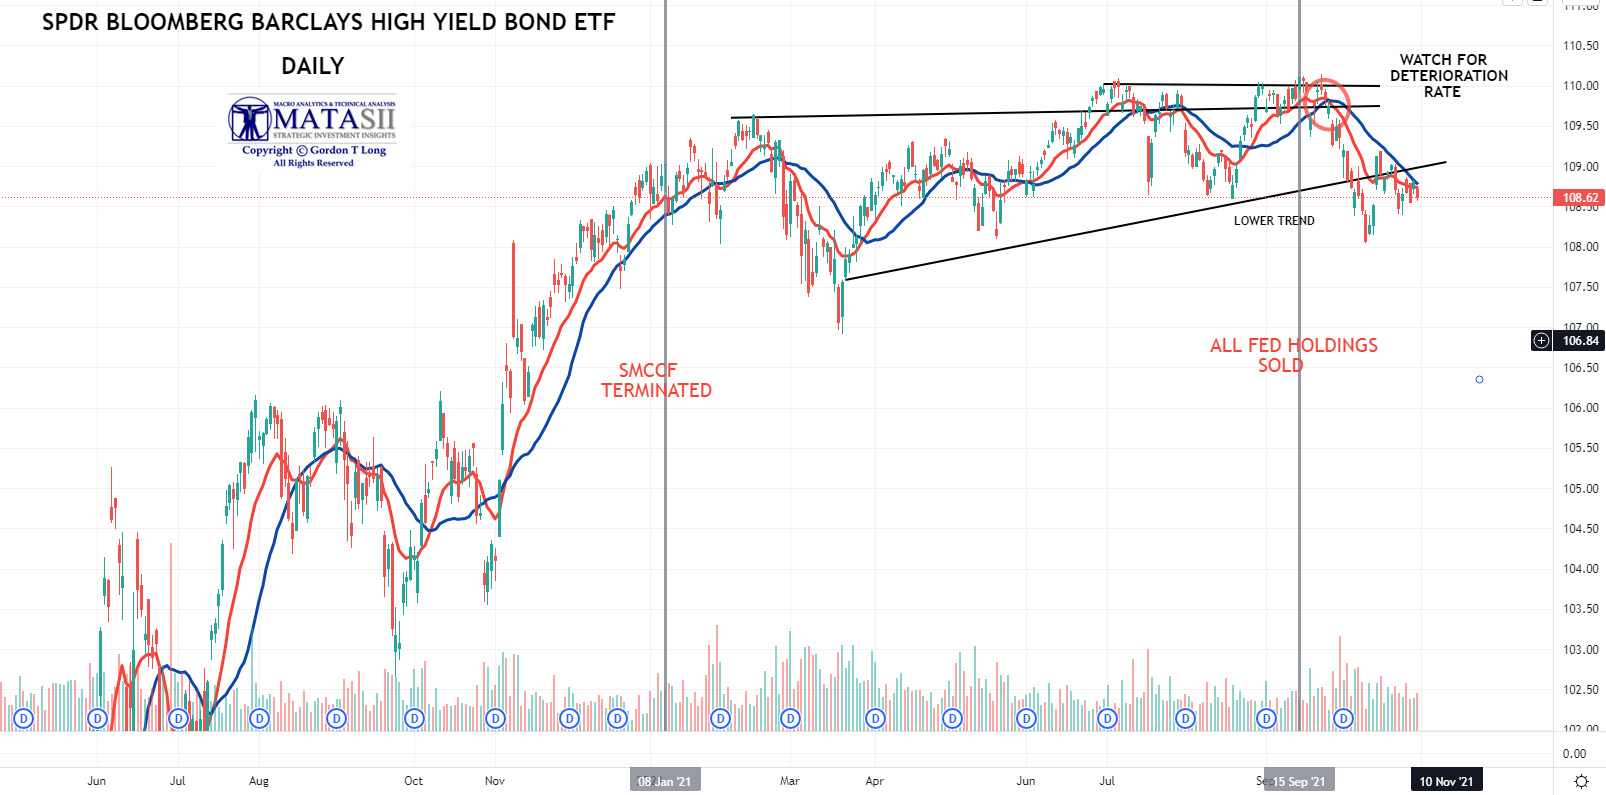
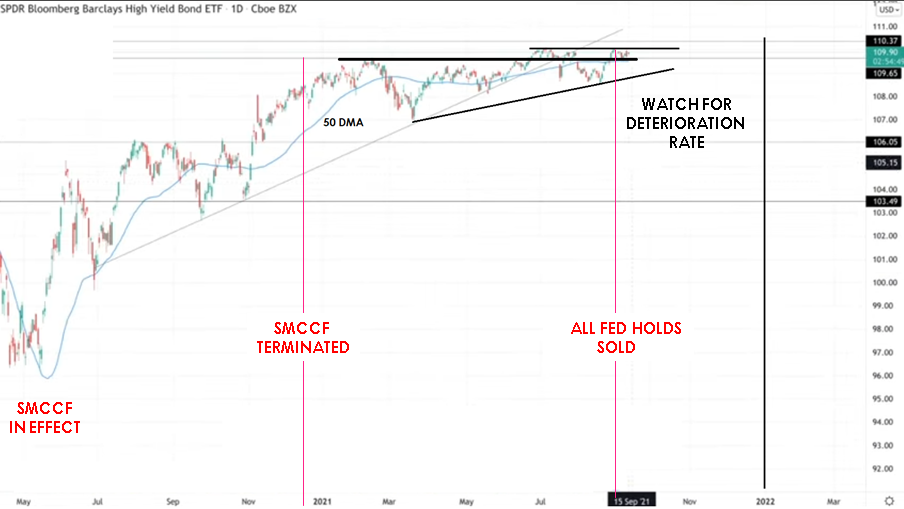
We specifically laid out what to watch for in our last UnderTheLens video (REFERENCE: VIDEO “Crowd Will Be Wrong” LINK, GRAPHIC “Bloomberg Barclays High Yield Bond ETF” LINK). We asserted that it would start with cracks in Credit. One of the “tells” would be a deterioration in High Yield Bonds.
1- CREDIT CRACKS BEGIN TO SHOW
Below we show that very soon after we issued the video, we received our first trigger (circled in red), where our proprietary red trend crossed our blue trend signal and immediately the SPDR Bloomberg Barclays High Yield Bond ETF began falling!
|
|
|
The “JNK” price fell as we expected below critical support, shown as the “Lower Trend” line.
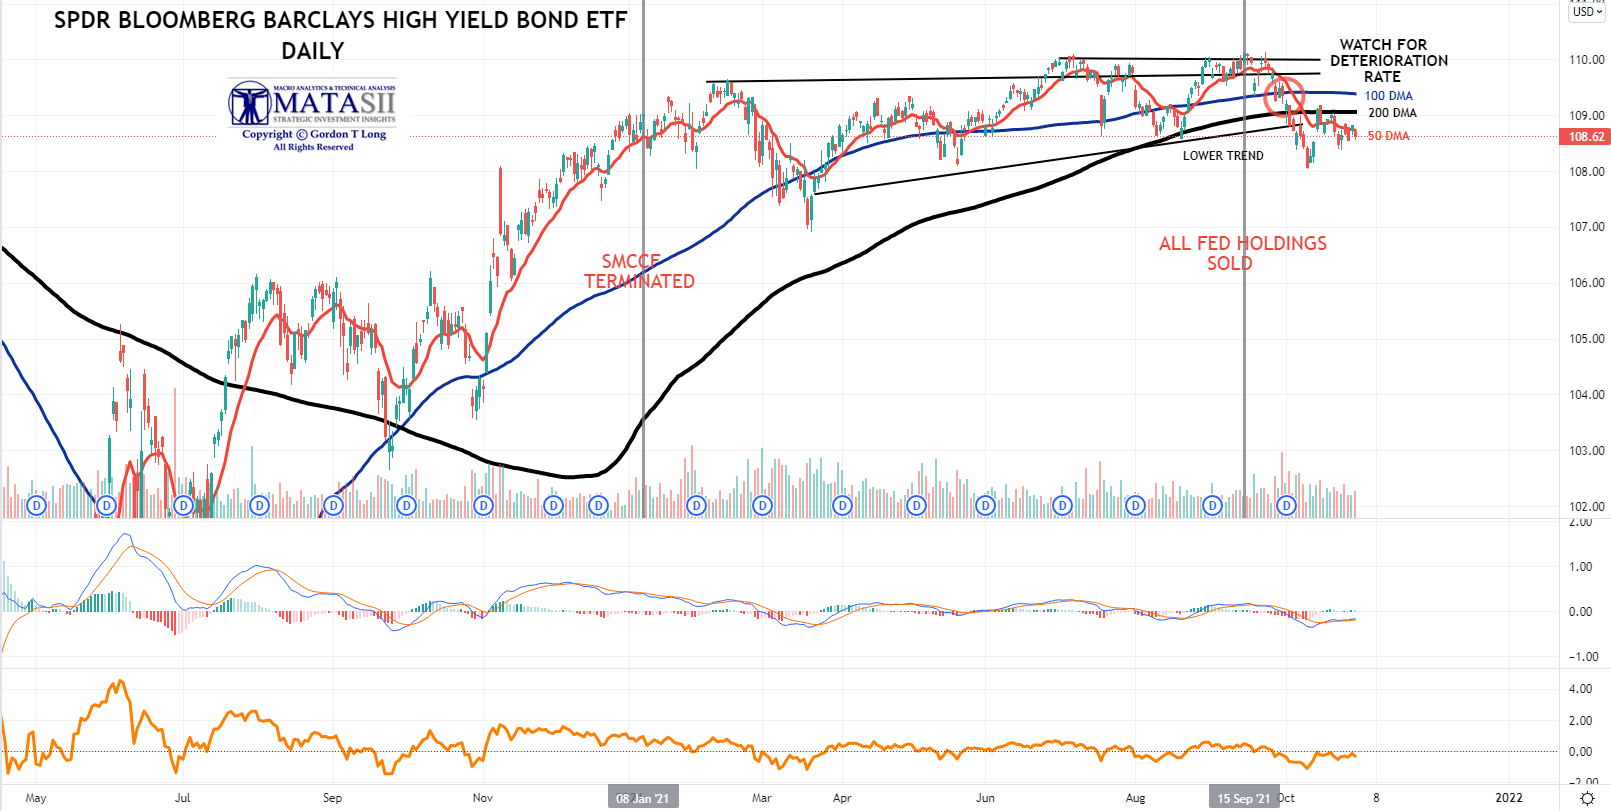
Importantly, we now see to the right that the 50 DMA has crossed both the 100 DMA, the 200 DMA and the lower trend support. We now await the “Death Cross” of the 100 DMA crossing the 200 DMA.
(Click Chart To Enlarge >>)
|
|
|
|
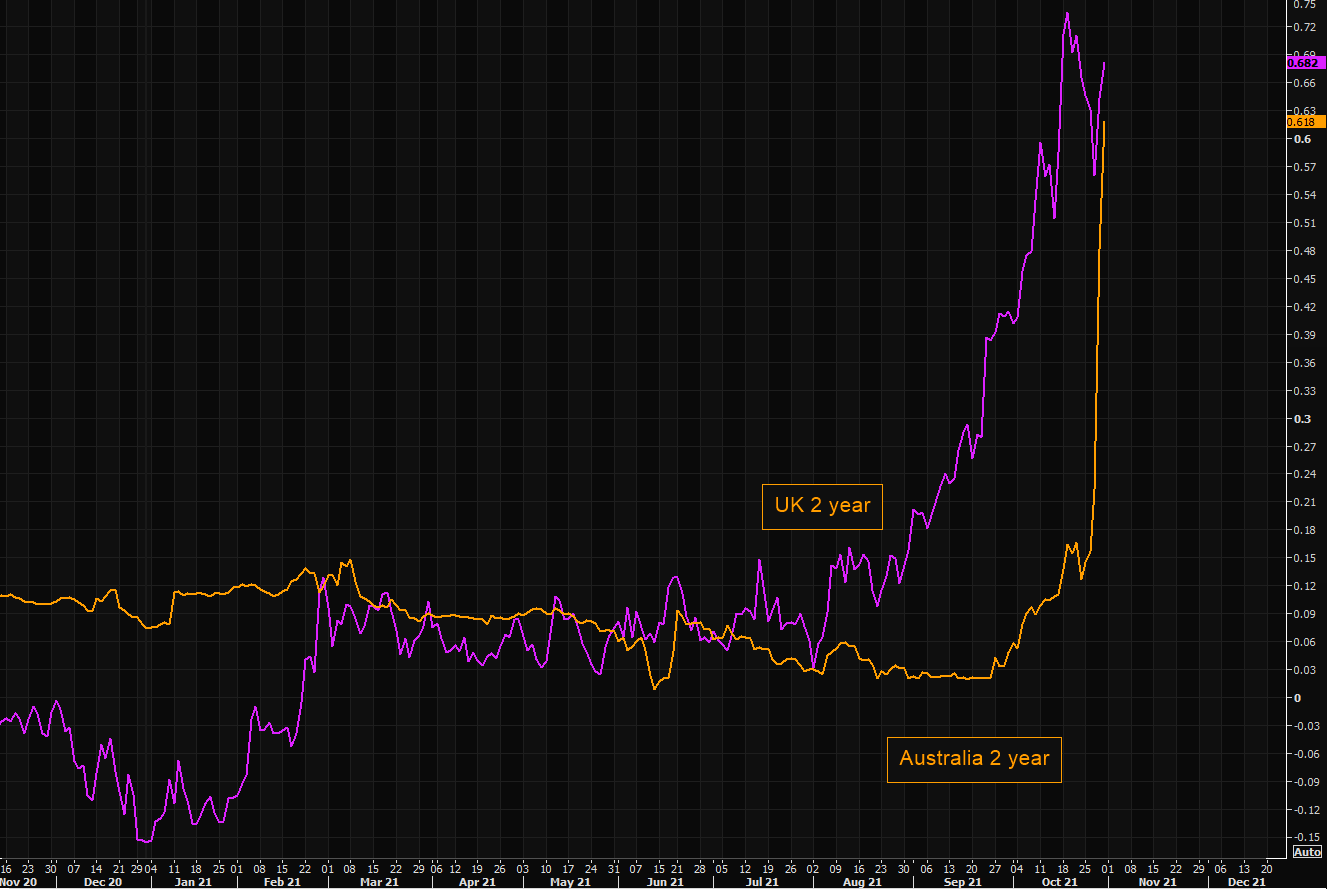
2- THE “TAPER TANTRUM” BEGINS
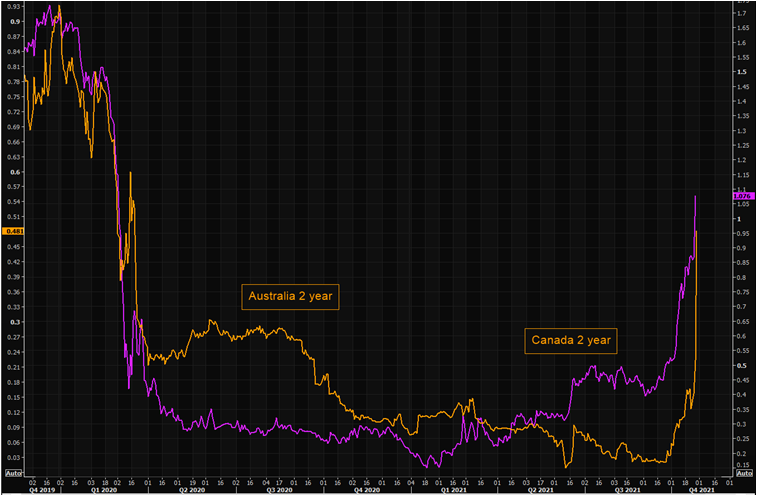
In a span of a few days, the view that some major central banks will be slow to raise rates shattered into pieces. Short-term yields from Canada to Australia jumped the most since the 1990s, catching even some of the best money managers flat footed, as policy makers shifted gears to move more firmly against inflation, once seen as likely to be transitory. At the same time, long-term rates slid — a signal that aggressive policy moves are likely to slow the pace of economic growth.
Investors just got a taste of what it looks like when central banks suddenly change course.
-
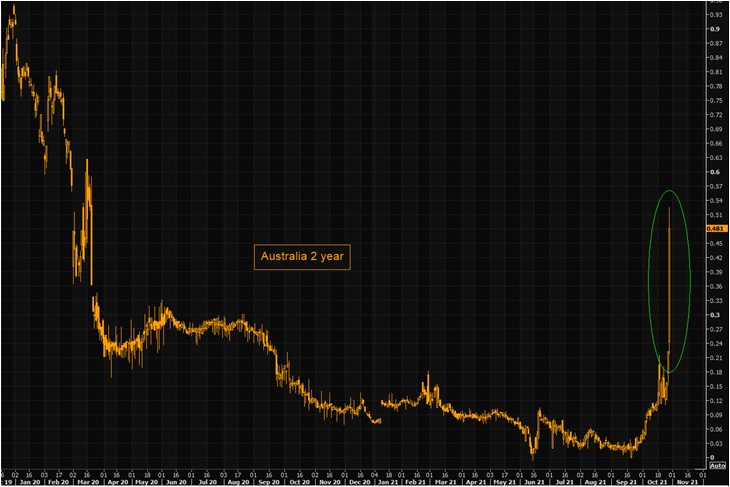
- Yields on Australia’s benchmark three-year bonds posted the largest monthly increase since 1994, after the Reserve Bank of Australia gave up on defending its yield target.
- In Canada, the central bank on Wednesday surprised markets by ending its bond-buying program and accelerated the potential timing of future interest rate increases, causing the gap between 2- and 10-year bond yields to narrow the most in almost two decades.
- In Europe, investors have pushed forward the expectations for rate hikes next year even after European Central Bank President Christine Lagarde said such a move is inconsistent with the bank’s guidance.
- In the US, the short term bond yields followed (below, bottom right).
|
|
| |
|
1- IT STARTED IN AUSTRALIA
|
|
|
|
|
|
|
| |
|
|
|
|
4- THEN THE US
CLICK ALL CHARTS TO EXPAND
|
|
|
|
|
3- A POTENTIAL VaR SHOCK?
WHAT IS VaR (Value-At-Risk)
Value at risk (VaR) is a statistic that quantifies the extent of possible financial losses within a firm, portfolio, or position over a specific time frame. … Risk managers use VaR to measure and control the level of risk exposure.
WHAT DOES THIS MEAN?
The sudden and major movements in Treasury bill volatility changes the VaR for holders of these securities. Internal policies and regulations then force portfolio exposure adjustment. It’s like someone rocking a small boat. It can quickly get out of control and become a self reinforcing death loop!
“This is the closest we can get to a distressed market. The value-at-risk shock refers to a surge in an investment loss that prompts positions to be liquidated.”
Deutsche Bank AG’s Global Head of FX Research George Saravelos,
10/28/21: “It’s a VaR shock now!”
|
|
|
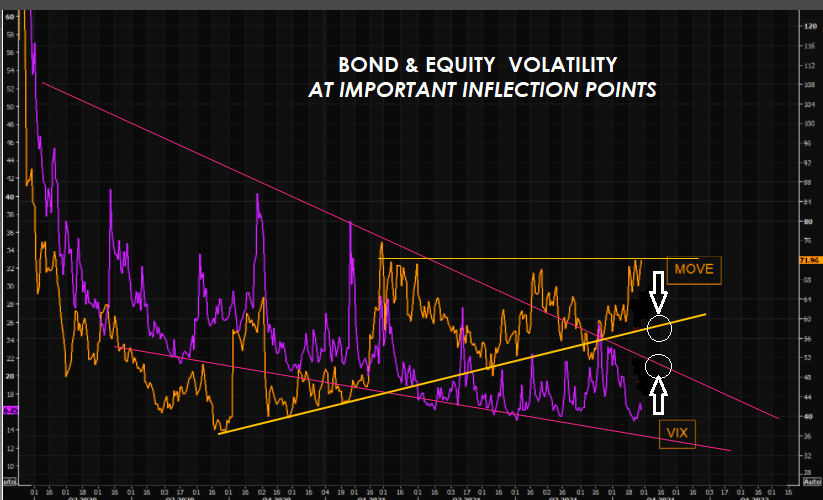
A CRITICAL INFLECTION POINT
We are presently at a critical inflection point in both the US Equity and Bond Markets. This can be witnessed by the “Ending Diagonal” as seen in the VIX for US Equities. This is a very reliable technical indicator for the end of a trend. Additionally, we see a “Rising Flat Topped Triangle”, as seen in the MOVE index for the US Bond Market which also is a reliable indicator for a continuation of the trend once an “ABCDE” corrective formation within the triangle has been completed.
|
|
|
COILING VIX
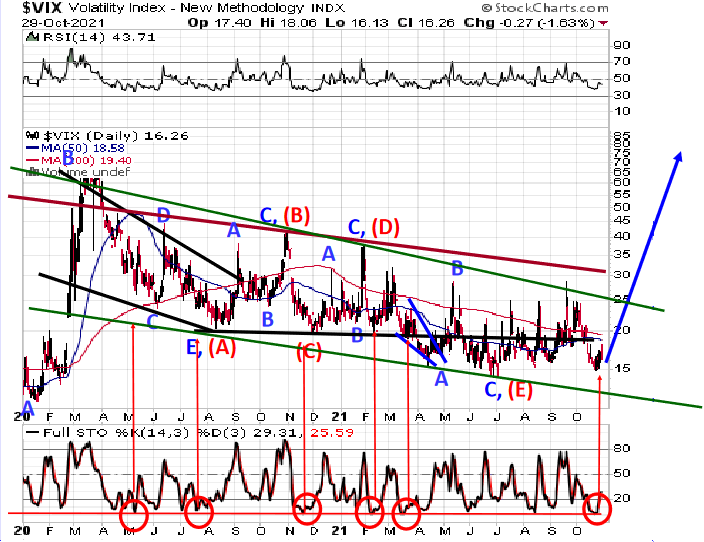 I follow closely the work of what I have found to be the three best Elliott Wave Technicians in the world. One of them is Robert McHugh PhD (The Technical Indicator Index), whose current Elliott Wave count on the US VIX index is featured to the right. What I particularly like about his work is that in his daily 60 page reports he integrates the Elliott Wave counts of all the markets he follows. I follow closely the work of what I have found to be the three best Elliott Wave Technicians in the world. One of them is Robert McHugh PhD (The Technical Indicator Index), whose current Elliott Wave count on the US VIX index is featured to the right. What I particularly like about his work is that in his daily 60 page reports he integrates the Elliott Wave counts of all the markets he follows.
Therefore his VIX chart to the right is not done in isolation. As a consequence he is more often right than wrong.
The message is clear which lends further technical credence to the MOVE and VIX charts above.
|
|
|
CONCLUSIONS
-
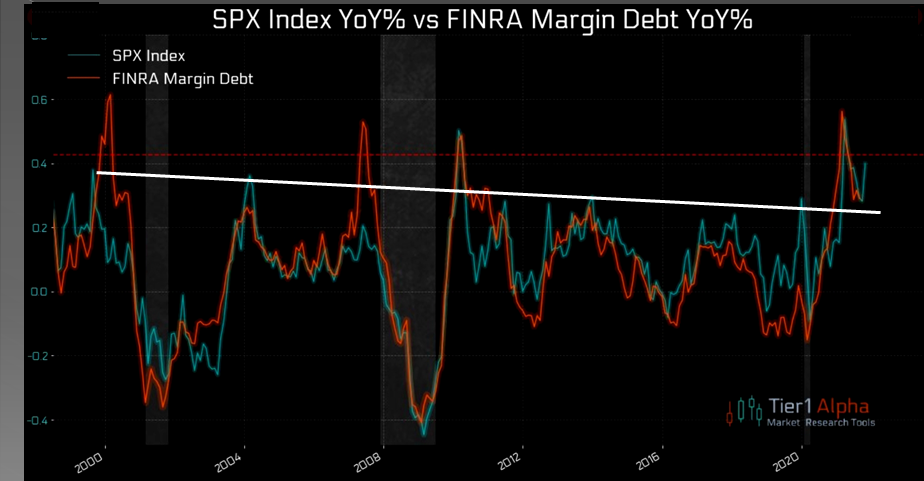
- For the Technicians out there we have a Bradley Turn Date on November 6th +/- a few days.
- We referenced in the September LONGWave video (Margin Topping Signals to Watch – Part II) the importance of three consecutive months of falling Margin Levels. The chart below shows we are on track to see exactly that!
|
|
|
-
- The capitulation of some central banks has emboldened U.S. traders, who are betting the Fed will start backing away from its mantra that the acceleration in consumer-price gains would be a short-lived side effect of the Covid pandemic. As traders shift their attention away from officials in Ottawa and Sydney and more acutely back toward those in Washington, DC, they’re now pricing in an almost 90% of chance that the Fed will make its first quarter-point hike in June.
- The 10-year German bund yield also moved up 7 basis points and is now yielding -0.08%. That’s a hiccup away from a return to positive yield! It’s also threatening to break the high of the year, which could set off a cascading move. Bund yields have been sub-zero since Q2 2019.
- “The markets are certainly testing the limits of central banks,” Wells Fargo Asset Management’s George Bory said on Bloomberg Television.
“It seems like the Fed is trying to avoid even being tempted to surprise markets by locking in a tapering schedule that delays rate hikes until the second half of next year. The risk here is that the longer the Fed resists signaling future hikes more aggressively, the more disruptive the market reaction will be when that signaling happens.”
Tim Duy, (a long-time Fed watcher) and Chief U.S. Economist at SGH Macro Advisors,
wrote on Oct. 27.
|
|
