Gordon T Long

Gordon T Long

Global Macro Research | Macro-Technical Analysis 

MACRO

US MONTARY POLICY


DID THE FED JUST IMPLEMENT STEALTH YIELD CURVE CONTROL (YCC)?

Broad based US Inflation has become clearly evident everywhere and to everyone!
 
The May CPI released Thursday showed the inflation headline number soared 5.0% Y-o-Y against an already expected hot +4.7%. That made inflation the highest level since Aug 2008, just prior to the last Financial Crisis. The Core CPI was additionally a huge outlier at 3.8% Y-o-Y, the hottest level of inflation since 1992.

The overall price of Goods was recorded up a whopping 6.5% Y-o-Y, the highest since 1982. The last time goods inflation was this high, Fed Chairman Volcker hiked rates to 20%. We also witnessed service prices accelerating significantly.

While absorbing these astounding numbers, we also witnessed the US Treasury yields plummeting a significant 24 basis points over the last 10 days to well below 1.5%, which it first broached back in late February. This drop in yield was attributed to 10Y Inflation breakevens suddenly collapsing. How can we have record inflation, yet plummeting inflation break-evens? You can’t!

WHY WOULD THIS HAPPEN??

We all are well aware that markets lead statistical data such as CPI, but seldom have we ever seen it so dramatically different! Most knew the bond market was due for a short squeeze with everyone expecting further and significant Treasury yield increases ahead.

It is our opinion that the Fed took this opportunity to front run rising yield pressures by the markets to implement Stealth Yield Curve Control (YCC). Current Fed actions and concerns appear to have made this an ideal time.

THE EQUITY MARKETS WERE VULNERABLE TO A CASCADING DISRUPTION

As the chart of the S&P 500 below illustrates, the equity markets are at a tenuous level and a shot by the Fed may have been felt to be the needed catalyst to move the markets higher or stabilize them temporarily near their current precarious levels.


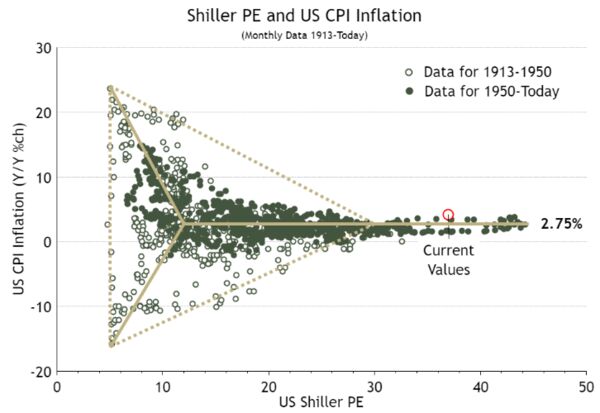
The chart to the right, from Ian Harnett of Absolute Strategy Research Ltd. in London, places inflation on the vertical axis and the Shiller price-earnings ratio on the horizontal axis.

This produces a relationship that John Authers at Bloomberg calls the “Inflation Dart” or perhaps preferably “Inflation Concorde.” The relationship between inflation and share valuations isn’t as tight as with bonds, of course, but at present the Shiller P/E is at the historically extreme level of 37 (slightly to the right of the red ring on the chart).

In the past, such valuations have only ever been achieved when inflation is positive and very low. With inflation at 5%, the latest reading is a massive outlier.

There is no precedent for the stock market being prepared to look through inflation this high and leave multiples at such an elevated level (or indeed set a new all-time record)??

SIMPLY TOO BIG A DISTORTION TO BE ANYTHING ELSE?

What is obvious is that this is an extremely strange set of conditions to combine with the worst inflation print in decades, even if that inflation is transitory.

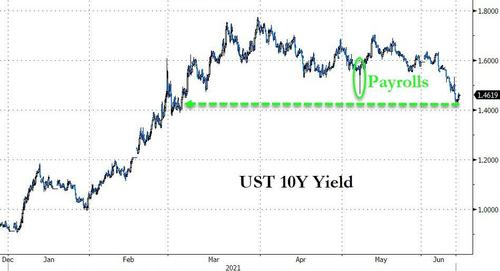
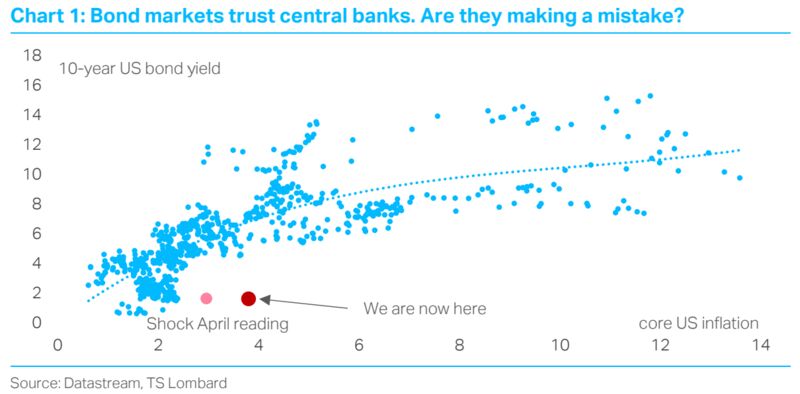
Another chart below from Dario Perkins of TS Lombard in London illustrates the extremity of the bond market nicely. It maps 10-year yields on the vertical scale against core inflation. Usually, and unsurprisingly, higher inflation tends to signify higher bond yields. The current yield looks like a historic outlier. Arguably, bond yields have never been this tolerant of high inflation. As Perkins suggests in the title of the chart below, bond markets are putting an awful lot of trust in central banks not to let inflation get going (which would damage longer-term bond returns).

Even though US CPI smashed expectations again, Deustche Bank’s chief credit strategist Jim Reid correctly points out that the current gap between 10yr US yields (c.1.5%) and US CPI (5.0%) is a whopping 3.5%, the highest since 1980. In fact, the gap has only been more negative for 10 months in the last 70 years, all of which were in 1974, 1975 or 1980.

A similar view of the unprecedented divergence between core inflation and 10Y yields is the following scattergram from Longview economics, which uses a smaller US 10Y Treasury Yield and and Core CPI metric.

While such a deeply negative (albeit crude) proxy for real yields is great for financial conditions today, as opposed to the manipulated ones where the Fed is implicitly setting real rates with its purchases of TIPS, we believe it is the finger prints of the Fed’s opportunistic stealth actions!

WHAT IS THE FED REALLY UP TO?

FED POLICY APPEARS TRAPPED

The Fed’s Dilemma:

    1. The Fed needs Inflation but hasn’t been able to get it to the degree they feel is required (a sustained +2% rate) over the last few years. However, with a sudden explosion it has arrived, both to the Fed’s delight and consternation!
    2. The Fed knows full well it needs to take some of the Euphoria out of the exploding ‘Everything Bubble’ without collapsing it,
    3. The Fed needs to raise rates but does not want to kill the Golden Goose of Wealth Effect and excess leverage,
    4. The Fed doesn’t want to use official YCC, because it could potentially drop the value of the dollar and cause import price inflation (rising import costs for most US consumer products),
    5. The Fed is concerned about a potential “Taper Tantrum I” if it slows liquidity even to a minor degree.


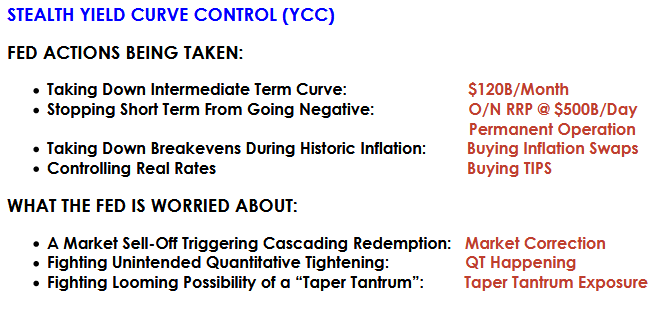
Global Central Banks appear to be caught in a trap of either:

    1. Keeping the money spigot wide open and allowing an asset bubble and inflation to blow out of control, OR
    2. Slow the money spigot and implode an artificially over leveraged credit edifice, OR
    3. Try and manage the balance by controlling rates along the entire yield curve through YCC and potentially sacrifice the US dollar.

CURRENT PUBLIC STRATEGY

    • DO NOTHING – Appear to be letting the markets deliver the ‘Forcing Function’,
    • TRANSITORY INFLATION – Let the Post-Covid Supply Chain ramp do its work for it.

HIDDEN APPROACH

    • CHINESE CREDIT IMPULSE (CCI) – Let the Chinese Credit Impulse (12 month lead) do its work for it until CCI reverses in late Q3
    • INFLATION SWAPS – Let Bank of International Settlements (BIS) Control Global Rates through Sovereign CDS’s to tighten or control the credit spigot versus the visible actions by central banks.
    • YIELD CURVE CONTROL (YCC) – Implement Stealth YCC at end of Q2 around Quadruple Witch Options Expiration and when Y-o-Y Inflation comparisons are at their worst (Compared to Pandemic Collapse).

CONCLUSIONS

Inflation cycles end badly, even when everyone is aware of the problem. Investors are the biggest fans of the “doing nothing” approach of the current generation of policymakers. Yet, if past inflation cycles are a guide to the future, investors will soon become the Fed’s loudest critics.

    • Once inflation cycles start, they gain momentum on their own. That is because:
    • Price cycles force changes in firms’ pricing, ordering, and inventory policies,
    • Workers’ wage demands.
    • Rates are headed higher but we can expect it to be controlled via the Bank of International Settlement (BIS) Credit influence through global Credit Default Swaps and then ‘tuned’ via Inflation Swaps at the Sovereign level.
    • Official US Yield Curve Control (YCC) is coming but only in concert with BIS actions to protect the US Dollar from what will be determined to be ‘excess damage’. However, as we point out above Stealth Yield Curve Control is already underway! NOTE: We saw this week a further down leg in US 10Y Treasury Yields, yet the dollar was up strongly!

NOTE TO EQUITY INVESTORS

As this month’s video spells out, Credit leads Bonds and Currencies, which lead the equity markets. So as not to get blindsided in the equity markets, you need to watch the other markets closely! There is also a consistent pattern where if the equity market is up, then either or both the 10Y UST (TNX) and US$ (DXY) are down with gold and silver up. Though you may not be interested in Bonds, the charts of the TNX below may save you some major losses!

Today’s Consumer Inflation Cycle Comes With Yesteryear Denial, Problems & Consequences:

Consumer price inflation is experiencing its most significant increases in decades. Yet, reported inflation does not capture the full scale and breadth of experienced inflation. I never thought the US would experience rampant inflation again, but based on the 1970s price measurement methods, the US experienced double-digit inflation in the past twelve months…. Over the last several decades, reported inflation has seen substantive measurement changes. For example, government statisticians now employ an arbitrary and non-market price for owner’s rent, removing actual housing prices from the calculation. Other substantive changes in the CPI occurred in the mid-1990s following the Congress-sponsored Boskin report, which purportedly shaved 50 to 100 basis points off of reported core CPI each year.Adjusting reported inflation for those exclusions or changes would result in double-digit gains in both headline and core CPI for the past twelve months.

Joseph Carson, former chief economist at Alliance Bernstein,


FOLLOWING DETAILED ANALYSIS IS SUBSCRIBER CONTENT ONLY

Subscribe to view full post content with supporting live charts
 

FAIR USE NOTICE  This site contains copyrighted material the use of which has not always been specifically authorized by the copyright owner. We are making such material available in our efforts to advance understanding of environmental, political, human rights, economic, democracy, scientific, and social justice issues, etc. We believe this constitutes a ‘fair use’ of any such copyrighted material as provided for in section 107 of the US Copyright Law. In accordance with Title 17 U.S.C. Section 107, the material on this site is distributed without profit to those who have expressed a prior interest in receiving the included information for research and educational purposes.  If you wish to use copyrighted material from this site for purposes of your own that go beyond ‘fair use’, you must obtain permission from the copyright owner.


NOTICE  Information on these pages contains forward-looking statements that involve risks and uncertainties. Markets and instruments profiled on this page are for informational purposes only and should not in any way come across as a recommendation to buy or sell in these assets. You should do your own thorough research before making any investment decisions. MATASII.com does not in any way guarantee that this information is free from mistakes, errors, or material misstatements. It also does not guarantee that this information is of a timely nature. Investing in Open Markets involves a great deal of risk, including the loss of all or a portion of your investment, as well as emotional distress. All risks, losses and costs associated with investing, including total loss of principal, are your responsibility.