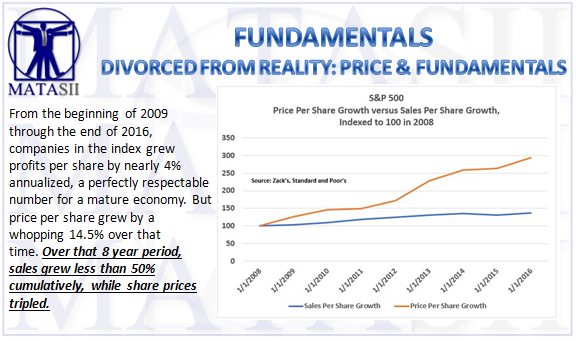
DIVORCED FROM REALITY: PRICE & FUNDAMENTALS
SOURCE: 03-07-18 John Coumarianos via RealInvestmentAdvice.com,
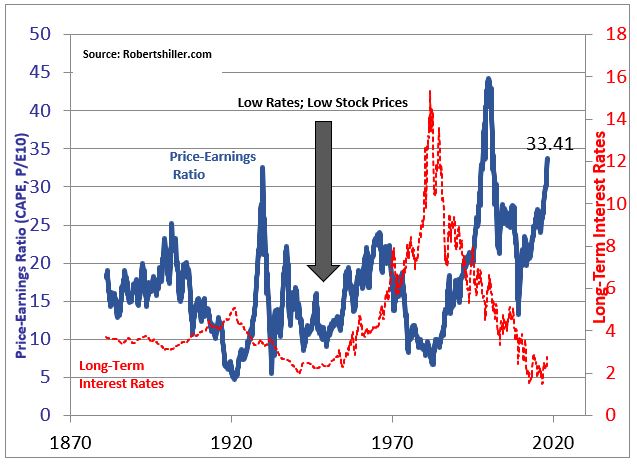
There are many ways of assessing the value of the stock market. The Shiller PE (price relative to the past decade’s worth of real, average earnings) and Tobin’s Q (the value of companies’ outstanding stock and debt relative to their replacement cost) are likely the two best. That doesn’t mean those metrics are accurate crash indicators, or that one can use them profitably as trading signals. Expensive stocks can stay expensive or get more expensive, and cheap stocks can stay cheap or get cheaper for inconveniently long periods of time.
But those metrics do have a good record of forecasting future long-term (one decade or more) returns. And that’s important for financial planning and wealth management. Difficult though it is sometimes, everyone must plug in an estimated return into a formula for retirement savings. And if an advisor is plugging in a 7% or so return for a balanced portfolio currently, he or she is likely not doing their job well. Stocks will almost certainly return less than their long-term 10% annualized average for the next decade or two given a starting Shiller PE over 30. The long-term average of the metric, after all, is under 17.
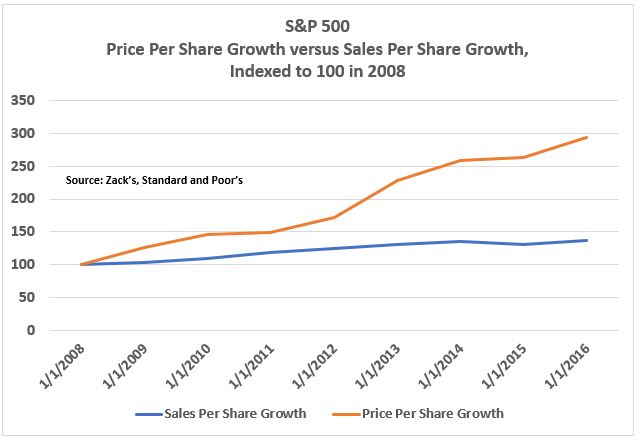
Another way of looking at how expensive the market has gotten recently is to look at sales of the S&P 500 constituents and relate it to share price. Companies are always manipulating items on income statements to arrive at a particular earnings number. Recently, record numbers of companies have supported net income numbers with non-GAAP metrics. That can be legitimate sometimes. For example, depreciation on real estate is rarely commensurate with reality. But it can also be nefarious, as Vitaliy Katsenelson recently argued in criticizing Jack Welch’s stewardship of General Electric, which Katsenelson characterized as being more interested in beating quarterly earnings estimates rather than in creating long-term wealth. And that’s why sales metrics can be useful. They are less easily manipulated.
So I created a chart showing sales per share growth and price per share growth of the S&P 500 dating back to the end of 2008. From the beginning of 2009 through the end of 2016, companies in the index grew profits per share by nearly 4% annualized, a perfectly respectable number for a mature economy. But price per share grew by a whopping 14.5% over that time. Over that 8 year period, sales grew less than 50% cumulatively, while share prices tripled.
Anyone invested in stocks should worry about this chart. How do share prices get so divorced from underlying corporate sales? One likely answer is low interest rates. But there must be other reasons because we’ve had low interest rates and low stock prices before – namely in the 1940s. That was after the Great Depression, and stocks were still likely viewed as suspect investments. Today, by contrast, stocks are not viewed with much suspicion, despite the technology bubble peaking in 2000 and the housing bubble in 2008. Investors still believe in stocks as an asset class.
And yet, the decline in rates over the past four decades has been breathtaking, as has Federal Reserve intervention. James Montier of Boston asset manager, Grantham, Mayo, van Otterloo (GMO), has studied stock price movements over the past few decades and found that a significant percentage of upward price movements have occurred on or before Federal Open Market Committee (FOMC) days. Montier estimated that 25% of the market’s return since 1984 has resulted from movements around FOMC days. Moreover, the market has moved higher regardless of what the FOMC decision was.
If this is a stock market bubble – and the data shows unusually high prices relative to sales and earnings – it is a strange one. One doesn’t hear the anecdotal evidence of excitement – i.e., cab driver’s talking about their latest stock purchases, etc…. This is perhaps a kind of dour bubble, where asset ownership at any price seems prudent in an economy that is becoming less and less hospitable to ordinary workers. Or, as Montier wrote in a more recent paper, this may be a “cynical” bubble where investors know that shares are overpriced, but think they can be the first ones out when the inevitable decline begins.