![]()
Gordon T Long
Global Macro Research | Macro-Technical Analysis
Gordon T Long
Global Macro Research | Macro-Technical Analysis
Through extensive research, and his process of Abstraction & Synthesis, Gordon delivers frank perspectives on global macro-economics and insightful conclusions not found in mainstream commentaries.
FAULTY PERCEPTIONS: PANDEMIC v MARKET CRASH
We must separate our thinking on the Global Pandemic which we are currently experiencing versus the historic drop in the Global Financial Markets we have witnessed in parallel. Obviously they are linked, but we need to view one as a “Shock” which will inevitably come under control. On the other-hand the other has every indications of being the beginning of something much more profound. The later, investors must understand and now think about positioning for.
Why differentiate? The financial markets were already nearing a long overdue and inevitable Business Cycle Recession. A Business Cycle that through Monetary Policy had created profound global imbalances , debt and leverage levels to historic degrees.
The CoronaVirus only “Destabilized” this already fragile and top heavy system. Focusing on only the Pandemic may lull investors into seeing that things will soon, quickly get back to normal. This is highly unlikely to be the case!
Violent corrective regressions-to-the-mean as Bear Market counter rallies — yes –likely!
What is centrally important which we will discuss, is the Policy responses to all this.
It was poor policy responses to the 1929 market crash that lead to the harsh Depression experienced in the 1930’s It is eerie how similar many of the underlying issues are today!
As we will discuss at the end it is the expected Regime Change that is most profound for investors.
I grew up in the 1950’s and witnessed first hand the ravages and fear of Polio (shown at the bottom of the pink box). It was truly frightening. My grandparents talked about the Spanish Flu they had witnessed in 1918. The Spanish Flu lasted from January 1918 to December 1920, it infected 500 million people—about a quarter of the world’s population at the time and killed 12,000 Americans.
Though exhibiting completely different characteristics they both lasted multiple years and came in waves.
By the summer of 1919, the Spanish flu pandemic came to an end, as those that were infected either died or developed immunity.
You have all seen this “Flattening of the Curve” Model that is used to make us understand the need for “Social Distancing” and “Sheltering in Place”. It is about containment to within the capabilities of our Hospital Systems capacity.
It isn’t about duration and total impact.
The only benchmarks are China which has initially flattened after 3 months and still exploding Italy, Spain and Iran. The jury is still out!
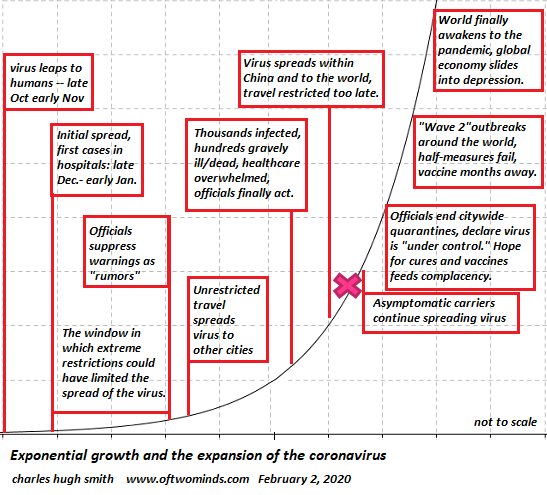
My Macro Analytics Co-Host, Charles Hugh Smith puts this illustration together at the end of January before the White House and media narrative took control.
His research said we had a long way to go. I marked an “X” on his original work to illustrate where we are now.
Here is my view on this.
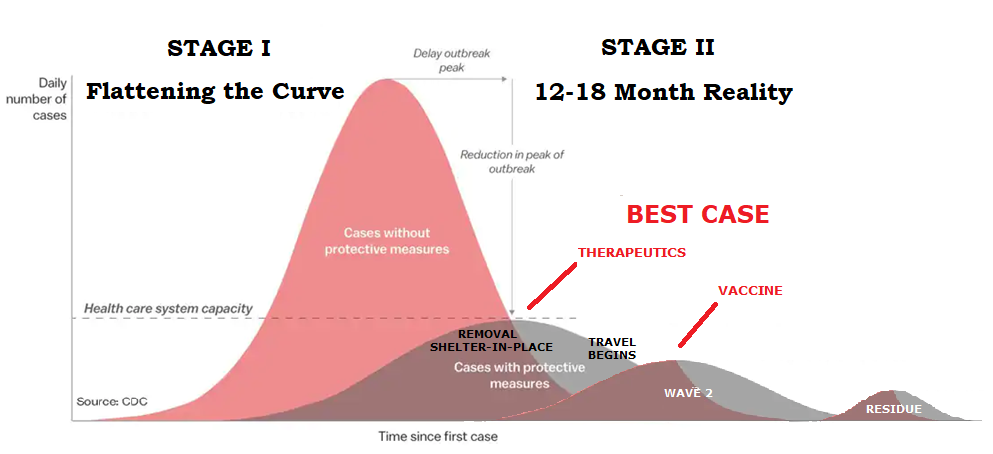
Thanks to incredible actions by all level of governments and our heath care professionals we are likely going to contain the virus to the degree of not seeing wholesale “code blacks” at US hospitals. We are likely going to soon see Therapeutics to counteract the virus. I also see a Vaccine being broadly available within 12 months as we bring the best minds and technology to bear!
What I also see as the pressure to get the economy moving again we remove “Shelter-in-Place”, “Travel Restrictions”, Social Gathering Sizes etc we see expected smaller disruptive waves.
Fear is not going to go away quickly. Confidence comes back slowly once the damage is done! Our society is going to change in the near term in ways we don’t yet fully appreciate yet – from how we gather, do business, travel, dine etc.
We have experienced a Social Shock that will act as a head wind to getting back to normal. This will be like pressure on the “brake peddle” of the economy as we try and apply the accelerator!
We won’t know for awhile how heavy the brake pressure will be?
Let’s switch to the market crash by comparing this one with prior ones.
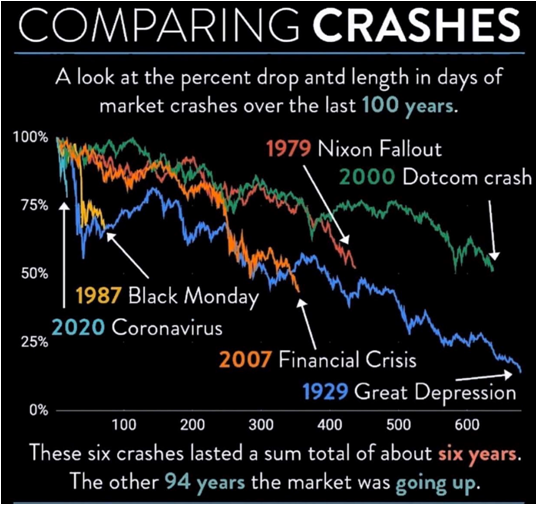
This is historic by any measure. So far it has dropped the furthest in the fastest period of time comparable only to 1929 and 1987. No other market drop of this degree has not been the kickoff to a multi-year bear market resulting in even lower lows!
Knowing the extreme conditions we entered this sell-of under, it is hard to argue this would be anything other than the beginnings of such a period.
The degree of market volatility and lengths the Federal Reserve has already been forced to take suggests we can conclude nothing less.
Of course we are going to see violent counter rallies. They are the hallmark of Bear Markets. Sentiment and behavioral reactions change slowly.
Prior to the market crash I showed charts of how ell we were tracking to 1929, 2000 Y2K and the 2008 Nasdaq. We mirrored their timing tops and precipitous drops.
Here is a 1929 DOW comparison. History suggests a major bounce followed by relentless pain!
In many ways we have experienced a perfect storm.
○ A Global Shock in both Demand and Supply,
○ An Unexpected Oil War initiated by the Saudi’s which is creating a shock to the High Yield Credit markets,
○ Monetary Stimulus showing itself as Ineffective and Insufficient,
○ Volatility higher than the fall of 2018’s VixAmeggadon which again is removing the perception of a Fed “PUT”,
○ Markets no longer following the Global Liquidity Proxy.
SLIDE 15
The acknowledged accelerant catalyst for this crisis is the Coronavirus or Covid-19 and its’ unexpected Demand and Supply shock. Both shocks together are unprecedented and certainly not seen on a Global Basis since WWII.
The Critical Crack that initially is being exposed is what we warned about in prior videos and that is Collateral Adequacy or more accurately Inadequacy, stemming from extreme debt and its distorted supporting leverage levels.
The Critical Tipping Point here in my estimation on a longer term impact basis will be a shift to Fiscal Policy or Helicopter Money from (and because of) Monetary Ineffectiveness.
What is presently occurring is:
a. Reprising of Risk (Credit Markets)
b. Pricing in Recession (PE Multiples)
c. Reprising Earnings (EPS)
d. Reprising Corporate Buybacks / Dividend Shifts (Which is only beginning)
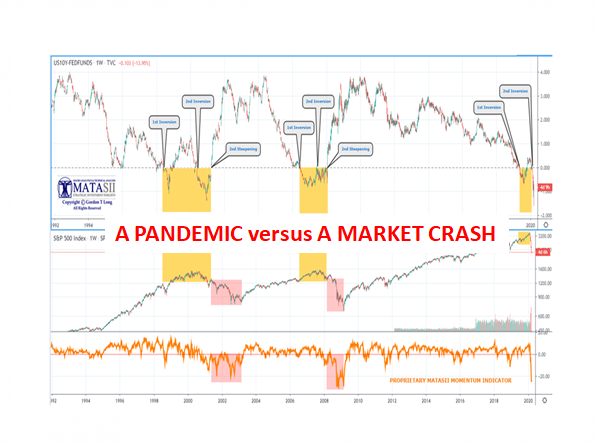
Before the crash the yield curves were pretty clear regarding what lay ahead,
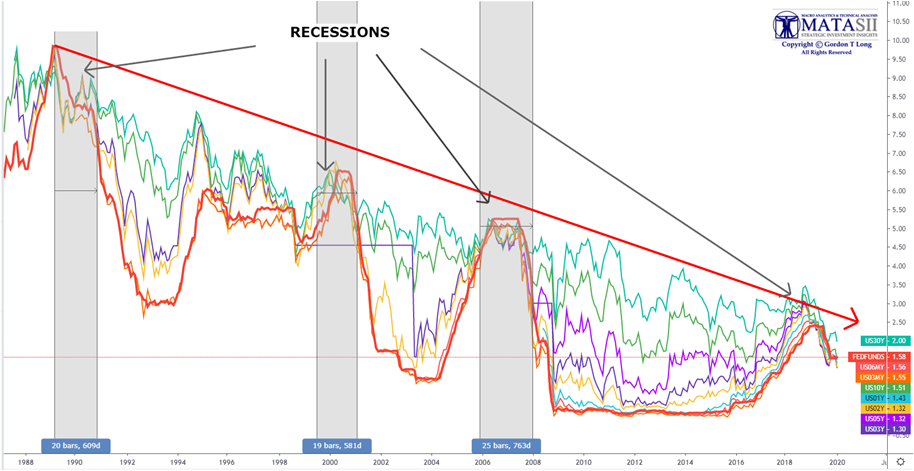
A Recession was long overdue. When the new numbers are available this chart will be in the red and the red band will have appeared.
This is the chart you need to pay the most attention to!
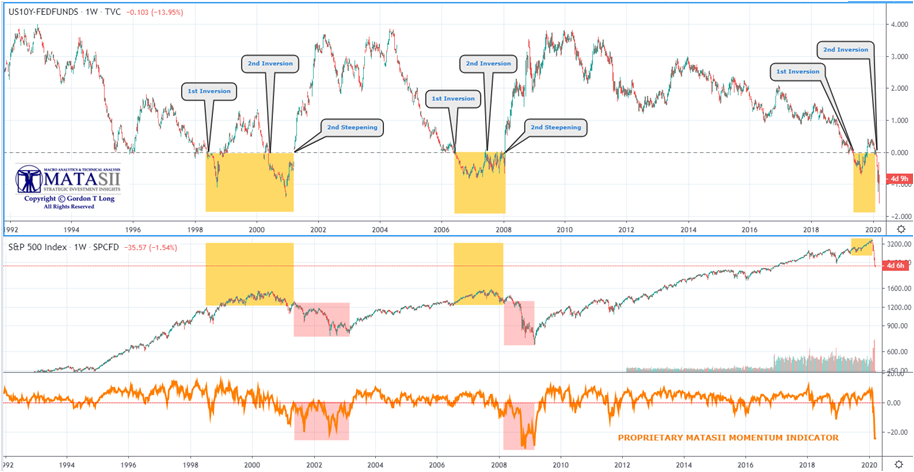
The top panel is the 10 Year UST versus Fed Funds Rate Spread. The middle panel is the S&P 500. The Bottom panel is MATSII’s proprietary Momentum indicator. What this chart tells us is:
- The Yellow area precedes major market bear markets.
- In the yellow area we experience two inversions in the yield curve,
- It is only after the 2nd Inversion and steepening of the yield curve that we see a sustained drop in the markets (shown in pink)
- We should expect to soon see the yield curve steepen and when it goes positive for the markets to start a steady recessionary adjustment.
- In the meantime markets are likely to counter rally while the yield curve heads higher.
FAIR USE NOTICE This site contains copyrighted material the use of which has not always been specifically authorized by the copyright owner. We are making such material available in our efforts to advance understanding of environmental, political, human rights, economic, democracy, scientific, and social justice issues, etc. We believe this constitutes a ‘fair use’ of any such copyrighted material as provided for in section 107 of the US Copyright Law. In accordance with Title 17 U.S.C. Section 107, the material on this site is distributed without profit to those who have expressed a prior interest in receiving the included information for research and educational purposes. If you wish to use copyrighted material from this site for purposes of your own that go beyond ‘fair use’, you must obtain permission from the copyright owner.
NOTICE Information on these pages contains forward-looking statements that involve risks and uncertainties. Markets and instruments profiled on this page are for informational purposes only and should not in any way come across as a recommendation to buy or sell in these assets. You should do your own thorough research before making any investment decisions. MATASII.com does not in any way guarantee that this information is free from mistakes, errors, or material misstatements. It also does not guarantee that this information is of a timely nature. Investing in Open Markets involves a great deal of risk, including the loss of all or a portion of your investment, as well as emotional distress. All risks, losses and costs associated with investing, including total loss of principal, are your responsibility.