FURTHER UNDERSTANDING EQUITIES DURING STAGFLATION.
In this newsletter we want to further examine what historically happens to PE multiples during periods of Stagflation. This newsletter should be considered as an addendum to our recent video:
LONGWave – 05 11 22 – MAY – Recessions & PE Compressions. Since producing the video we have advanced further in our expected levels of PE compression which we highlight.
We currently expect the current market PE of 21.54 to fall to between 11 and 14.7. The next drop will be from a dramatic reduction in earnings estimates.
In 2008, prior to the Financial Crisis, earning estimates were initially expected to increase by 15%. They ended up falling 72%!
=========
WHAT YOU NEED TO KNOW
- The ravages of Global Stagflation are now being felt as expectations for economic Growth are increasingly being taken down with the expectations for a recession.
- After a negative Q1 GDP the Atlanta Fed’s NOW survey is calling for barely a positive GDP keeping the US from officially already being in a recession.
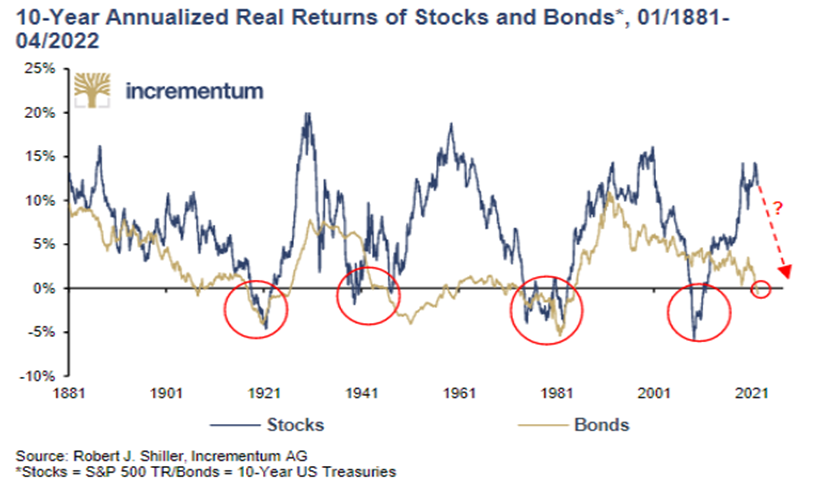
- 10-Year Annualized Real Returns for Stocks and Bonds are projected to fall precipitously.
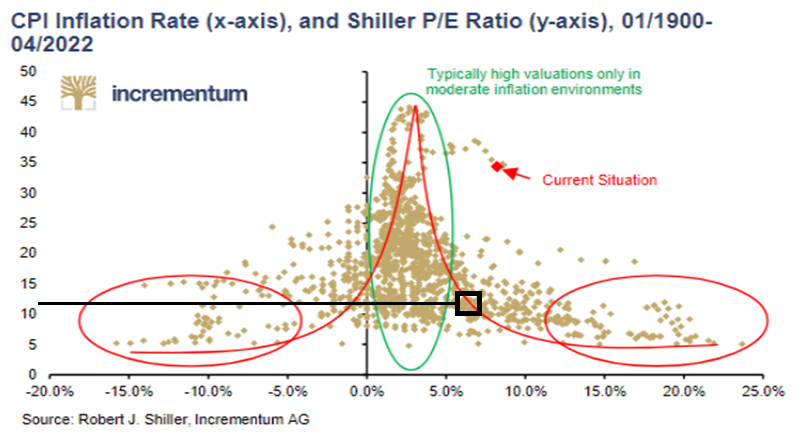
- Our statistical Bell Curve of CPI Inflation versus the Shiller PE going back to 1900 predicts a PE ration between 11 and 12 before bottoming.
- We are seeing unprecedented levels of Inflation still in the supply channel that has yet to reach the retail level.
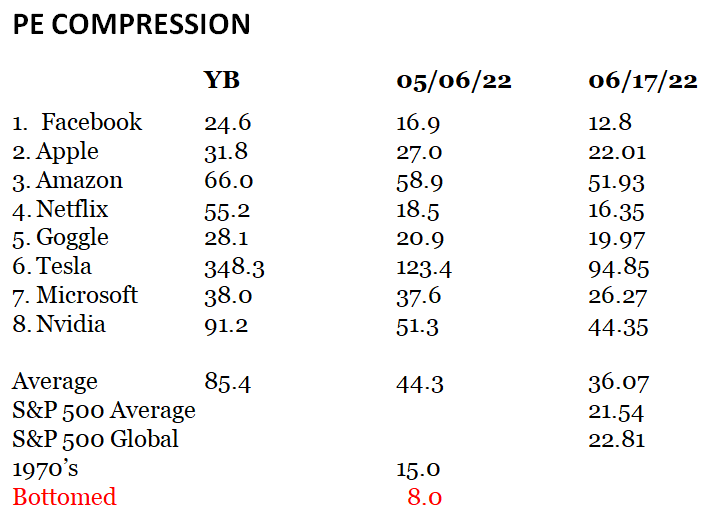
- The PE ratios for the Big 8 stocks we featured have fallen from 44.3 to 36.07. They were at 85.4 at YB. As a consequence they have lost over $2T in market cap and are only now approaching the levels they saw in their stock valuations during the Covid lows.
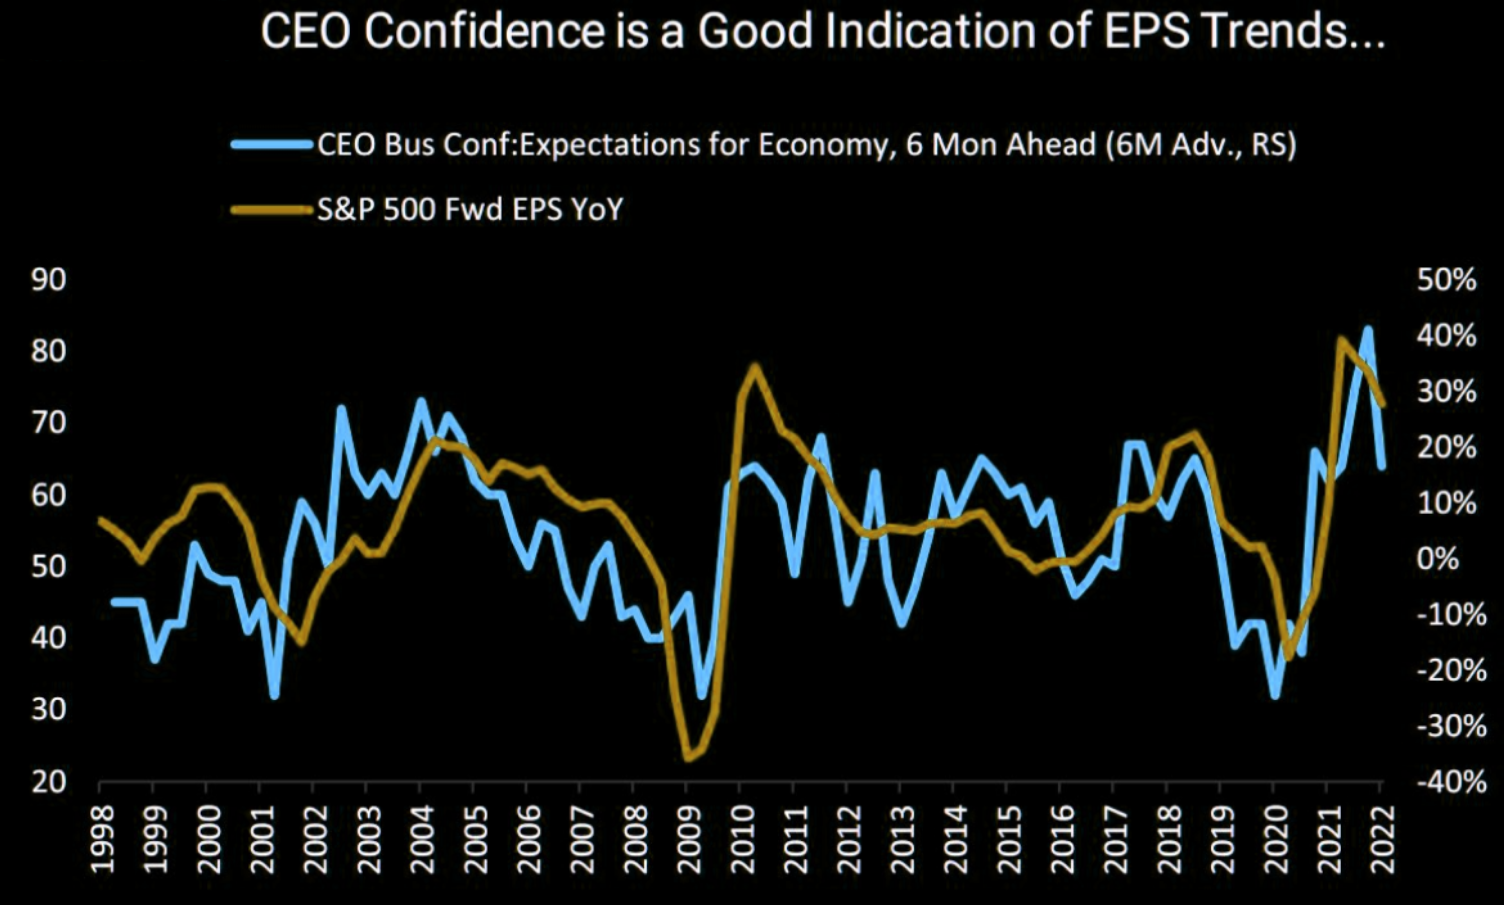
- CEO confidence and forward earnings guidance has steadily declined since the beginning of the year.
- Our long held view at MATASII.com is that the market correction will last until the US Mid-term elections and approach support at 3270.
=========
|
|
CONSEQUENCES OF STAGFLATION
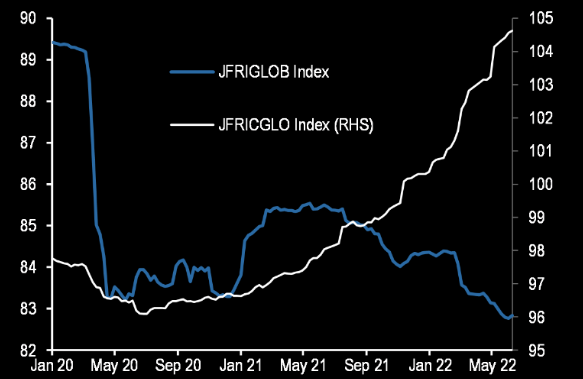
When economies slow, earnings fall and PE compressions fall if they are matched with rising inflation.
CHART RIGHT: JP Morgan’s Forecast Revision Index for Global GDP versus the Forecast Revision Index for Global CPI. The world has clearly entered a period of Global Stagflation.
|
|
 |
|
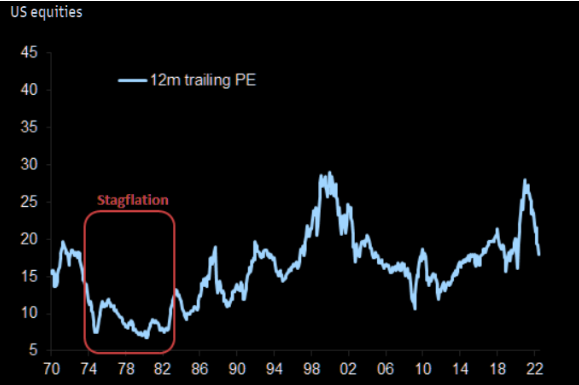
The 1970s stands as the period of reference for macro-economic stagflation, in the US and in the UK. Equities De-Rated during the 1970’s. PE’s fell from 18 to 8.
|
|
|
|
|
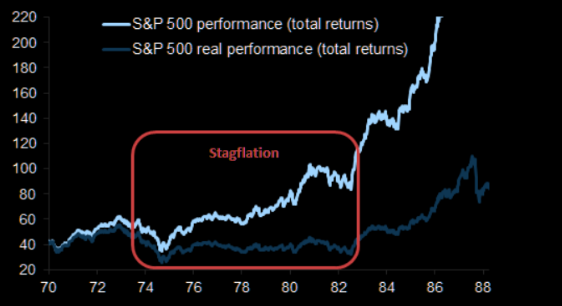
The 1970’s started by a recession induced by an oil price shock and a bear market. Beyond the bear market rally late 1974, equities offered poor absolute returns during the rest of the decade, particularly in real terms. During this time period, US equities averaged a total return of 0.1% annualized, in real terms (9% in nominal terms).
|
|
|
|
|
Many well-respected analysts are now expecting 10-Year Annualized Real Returns for Stocks and Bonds to fall precipitously.
|
|
|
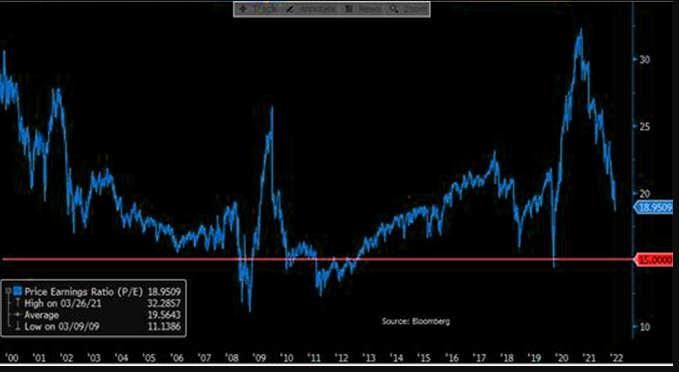
If we consider US CPI rates versus the Shiller P/E Ratio 1900 to 2022, we have the graphic show below. Assuming US CPI falls to 6% we might expect to see PE ratios approach 11. This is a further significant deterioration from recent levels of 18. There is considerable damage still in front of us if the Fed is unable to get inflation under control and brought down quickly!
|
|
|
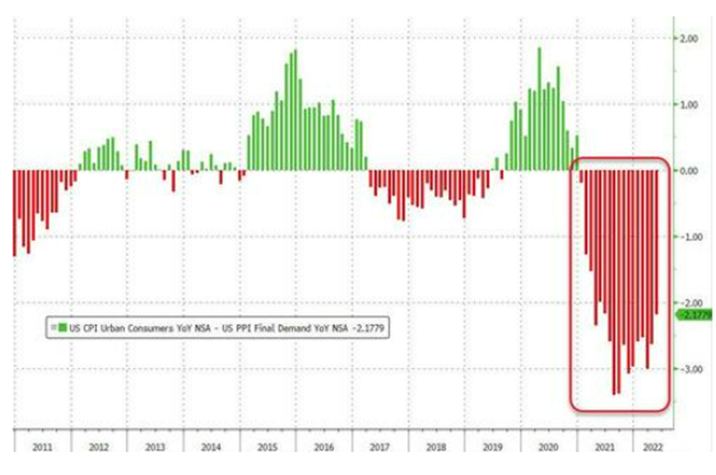
The chances of this occurring is poor since Inflation, as measured by both the CPI and PPI, is still rising as measured by the most recent May M-o-M reports. In fact it appears there is still significant inflation in the “pipeline” that has yet to hit the consumer.
CHART BELOW SHOWS the US CPI Y-o-Y MINUS the US PPI Y-o-Y going back to 2011. We have not seen this level of inflation in the channel yet to reach the consumer. Producer and retailers can’t contain it with margin squeeze and will have to pass it on. This won’t be before serious erosion has occurred to corporate Profit Margins!
|
|
|
WHAT HAS HAPPENED TO P/E’S ALREADY
The Big 8 have lost over $2T in market cap and are only now approaching the levels they saw in their stock valuations during the Covid lows.
|
|
|
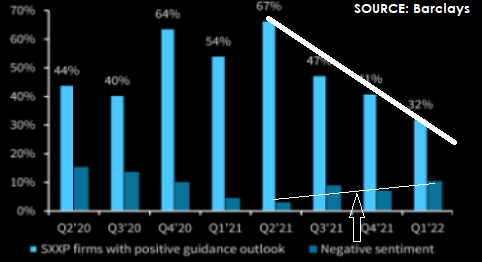
CORPORATE EARNING GUIDANCE
CEO confidence (as shown to the right) suggests that earnings’ estimates are highly likely to fall at an accelerating rate!
CHART BELOW: Corporate guidance continues to become more cautious. The question is whether Q3 guidance is the catalyst that triggers the next major leg down in P/Es?
|
|
CONCLUSION
3000 in the S&P 500 increasingly is becoming the new target level low for the market. We have been predicting 3270 for two years now.
JP Morgan’s back-of-the-envelope, though quite simplistic, may actually be fairly accurate.
- The SPX P/E ratio has spent little time below 15x this century and had a pandemic low ~14.7x.
- Hypothetically, if you cut consensus FY2023 EPS estimates by 20% ($250 to $200) and apply a 15x multiple you get to 3,000 in SPX”.
|
|
|
THE WORST IS STILL IN FRONT OF US
EXPECT A SHORT TERM BEAR MARKET COUNTER RALLY
FADE THE UNFOLDING COUNTER RALLY – SELL THE RIPS
|
|