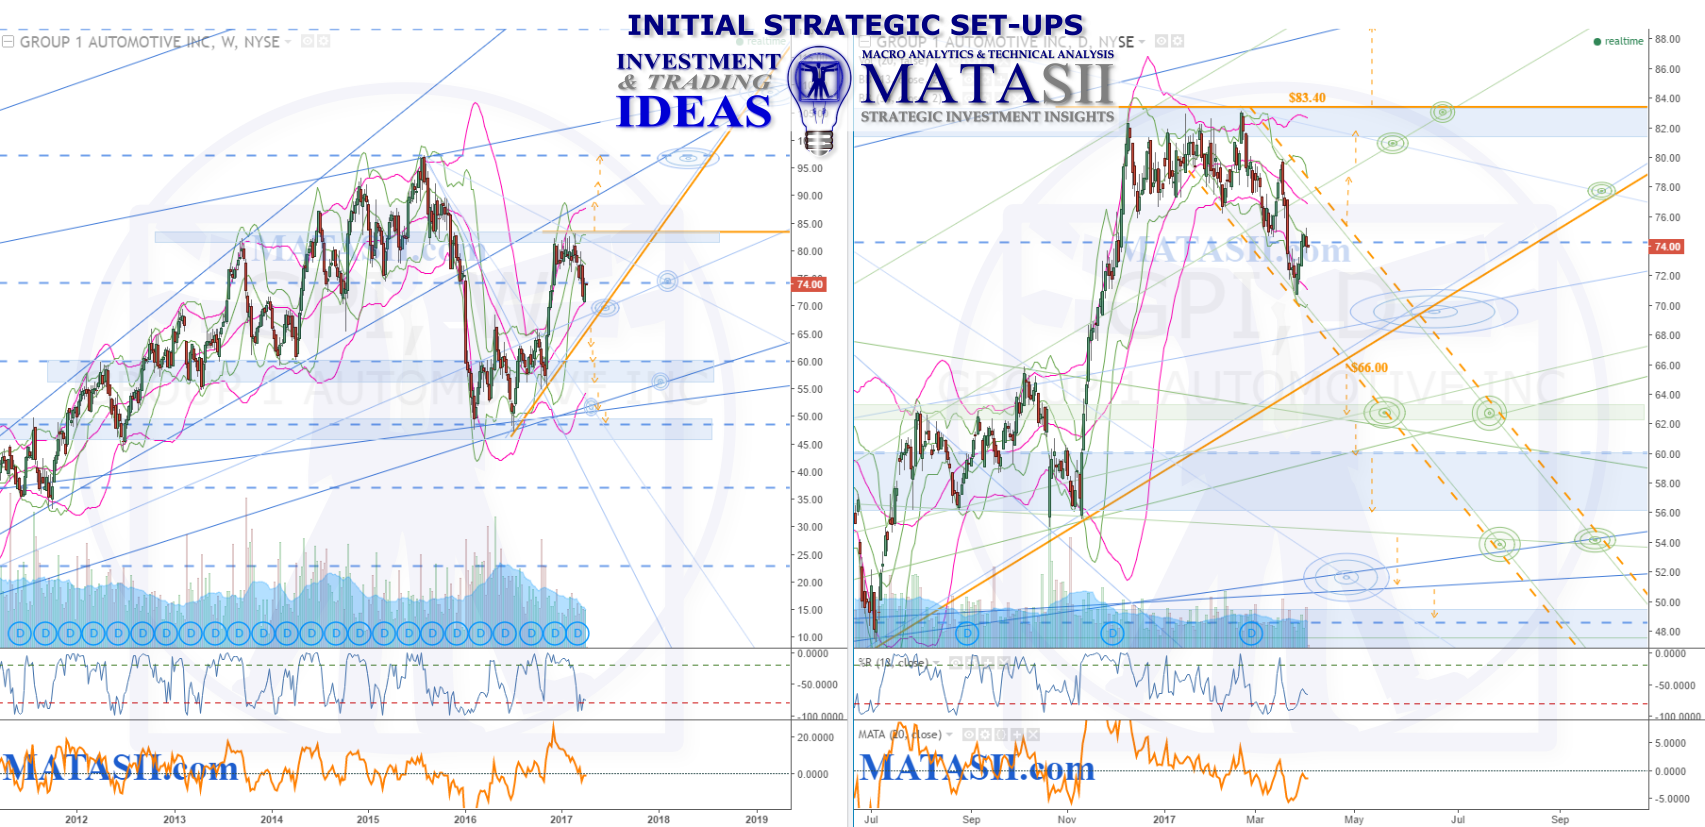
The larger pattern on the weekly chart shows a potential double top forming for GPI. The daily chart shows the most recent market movement coming off significant technicals and falling within a channel. Breaking from this channel (orange dashed highlight), up or down, would be a trigger consideration for a move to the next significant technical. Solid orange lines highlight the technicals currently holding the larger pattern, and breaking through these would also be trigger considerations for a move to the next significant technical. Also for consideration would be a continued down move within the current channel on the daily: hitting the upper channel support and falling from this offers a potential opportunity to continue to follow the market down within its channel.