IG BOND SPREADS SENDING A CLASSIC BEARISH STOCK SIGNAL
-- SOURCE: 07-02-18 Seeking Alpha - "A Bearish Stock Signal From IG Spreads" --
KEY MESSAGE
As the corporate bond market goes, so goes the stock market
- Over the past three decades, the directionality of investment grade corporate bond spreads has been strongly related to equity returns.
- As we reach the half point of 2018, IG spreads are notably wider, albeit from initially tight levels.
- This article discusses the relationship between spreads and equity performance, and examines whether history can be a guide to forward returns.
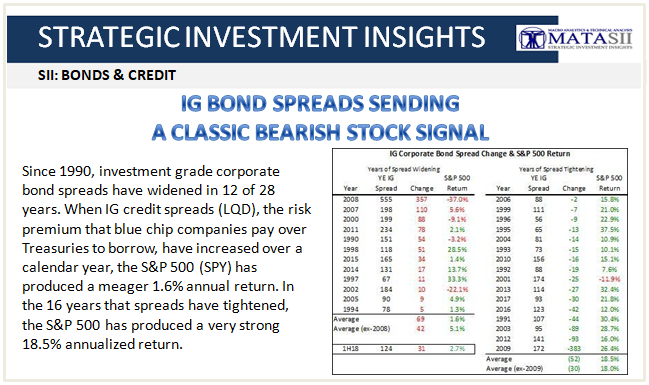
Since 1990, investment grade corporate bond spreads have widened in 12 of 28 years. When IG credit spreads (LQD), the risk premium that blue chip companies pay over Treasuries to borrow, have increased over a calendar year, the S&P 500 (SPY) has produced a meager 1.6% annual return. In the 16 years that spreads have tightened, the S&P 500 has produced a very strong 18.5% annualized return.
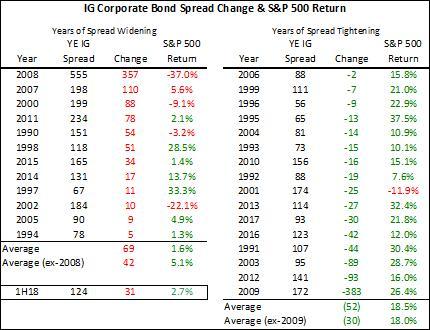
As we reach the midway point of 2018, IG spreads are meaningfully wider. The average investment grade corporate bond spread over Treasuries is 31bp higher year-to-date. While this may not seem like a meaningful widening, only 7 of the 28 years in our dataset have experienced greater spread widening than we have seen so far this year. Four of those seven years produced negative total returns for the equity markets; two of those additional years produced only meager 1-2% returns.
At the midway point of the year, the S&P 500 has produced a 2.7% total return. This aligns with 2015, which saw a 34bp spread widening and an annualized total return for the S&P 500 of 1.4%. Spread widening in 2015 was driven by sharply lower commodity prices that pressured the debt of energy and mining companies, which saw sharply higher leverage as earnings tumbled. Spreads had begun to widen in late 2014 as oil prices rolled over.
The only year with a larger spread widening than 2018 that ended up being a strong year for equities was 1998. The Russian default in August of that year, and the collapse of hedge fund Long Term Capital Management shortly thereafter, weighed on global credit markets. Equities, amidst the inflating of the tech bubble that saw the Nasdaq (QQQ) produce a 40% return, managed to deliver a year of strong performance. Similarly, 1997 also saw strong equity returns as domestic credit spreads widened from historic lows in part driven by sovereign debt crises in Asia.
Rising credit spreads directly increase a companies cost of capital. If equity values are the discounted future cash flows produced by a company, a rise in the discount rate should lower the present value. Higher credit spreads should translate into lower equity values as we have seen historically.
From a pure balance sheet view, the equity of a firm is the value of its assets less its liabilities. The equity value can be viewed as a call option on the asset value with a strike price equal to the value of the debt. Wider credit spreads of a given company are the market pricing in a greater likelihood that the value of the assets is not greater than the value of the debt. The risk premium bondholders need to be paid for lending to that company is rising. Credit spreads are naturally linked to equity volatility, and 2018 has delivered wider spreads and higher volatility.
I view it as unlikely that 2018 is going to end with investment grade corporate bond spreads tighter than where we started. While investment grade corporate balance sheets are generally in decent shape and corporate earnings have proven resilient, a large scale rally in a maturing credit cycle feels like a stretch at this point. When I show this table again, 2018 is very likely to fall to the left of this graph. That does not spell a high likelihood of strong equity returns for the remainder of the year.