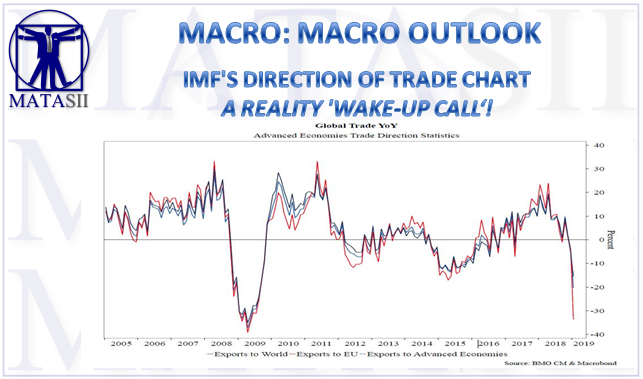
IMF'S DIRECTION OF TRADE CHART A REALITY 'WAKE-UP CALL'
“The world economy has been in a significant slowdown for a period. People just have to wake up and look at the trade data.’’ - James Bevan, chief investment officer at CCLA Investment Management.
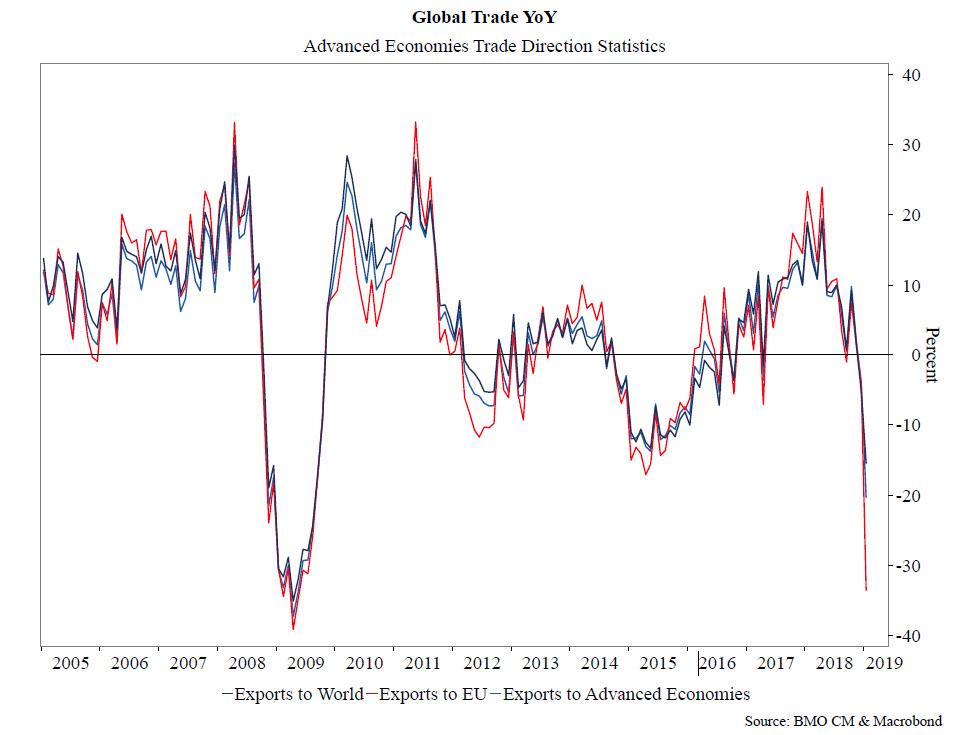
But the best way to visualize just how serious the threat to global flow of trade, and the world economy in general, below is a chart on the year-over-year changes in global trade as measured by the IMF's Direction of Trade Statistics, courtesy of BMO's Ian Lyngern. It shows the absolutely collapse in global exports as broken down into three categories:
- Exports to the world (weakest since 2009),
- Exports to advances economies (also lowest since 2009), and
- Exports to the European Union (challenging 2009 lows).
THE FACTS
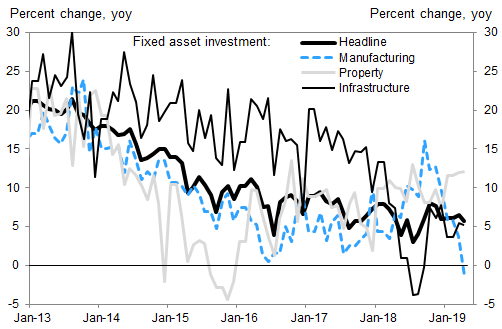
- CHINA: Dismal China economic data, which showed industrial output, retail sales and investment all sliding in April by more than economists forecast.
- US: A similar deterioration was observed in the US, where retail sales unexpectedly declined in April while factory production fell for the third time in four months.
- EU: Meanwhile, over in Europe even though Germany’s economy emerged from stagnation to grow by 0.4% in the first quarter, "the outlook remains fragile amid a manufacturing slump that will be challenged anew by the trade war." As a result, investor confidence in Europe’s largest economy unexpectedly weakened this month for the first time since October.
Even before the latest round of trade escalation, global trade had tumbled to levels last seen during the financial crisis depression.
US-CHINA TRADE CONFLICT
- Bloomberg Economics calculated that about 1% of global economic activity is at stake in goods and services traded between the US and China.
- Almost 4% of Chinese output is exported to the U.S. and any hit to its manufacturers would reverberate through regional supply chains with Taiwan and South Korea among those at risk.
- U.S. shipments to China are more limited, though 5.1% of its agricultural production heads there as does 3.3% of its manufactured goods.
[SITE INDEX -- MACRO: MACRO OUTLOOK]
READERS REFERENCE (SUBSCRIBERS-RESEARCH & PUBLIC ACCESS )
MACRO: MACRO OUTLOOK
MATASII RESEARCH ANALYSIS & SYNTHESIS WAS SOURCED FROM:
SOURCE: 05-16-19 - - "Global Trade Collapsing To Depression Levels"
FAIR USE NOTICE This site contains copyrighted material the use of which has not always been specifically authorized by the copyright owner. We are making such material available in our efforts to advance understanding of environmental, political, human rights, economic, democracy, scientific, and social justice issues, etc. We believe this constitutes a 'fair use' of any such copyrighted material as provided for in section 107 of the US Copyright Law. In accordance with Title 17 U.S.C. Section 107, the material on this site is distributed without profit to those who have expressed a prior interest in receiving the included information for research and educational purposes. If you wish to use copyrighted material from this site for purposes of your own that go beyond 'fair use', you must obtain permission from the copyright owner.
NOTICE Information on these pages contains forward-looking statements that involve risks and uncertainties. Markets and instruments profiled on this page are for informational purposes only and should not in any way come across as a recommendation to buy or sell in these assets. You should do your own thorough research before making any investment decisions. MATASII.com does not in any way guarantee that this information is free from mistakes, errors, or material misstatements. It also does not guarantee that this information is of a timely nature. Investing in Open Markets involves a great deal of risk, including the loss of all or a portion of your investment, as well as emotional distress. All risks, losses and costs associated with investing, including total loss of principal, are your responsibility.