THE REALITY OF A POTENTIAL US RECESSION IS RAPIDLY RISING
A FIRST TERM PRESIDENT
We need to remember that it has been over 7 years since the US had its last recession. This is historically a long time. Also, few realize that normally a first term President faces a recession in his first year in office.
Why? They normally inherit a mess!

TRUMP MUST ACT FAST!
The Trump Administration inherited a very leaky ship. The USS Economy is taking water fast and Trumponomics must kick-in rapidly or it may be too late. The worst is too little too late because of a contentious congress.
The evidence is overwhelming if you take your eye off all the media hype.
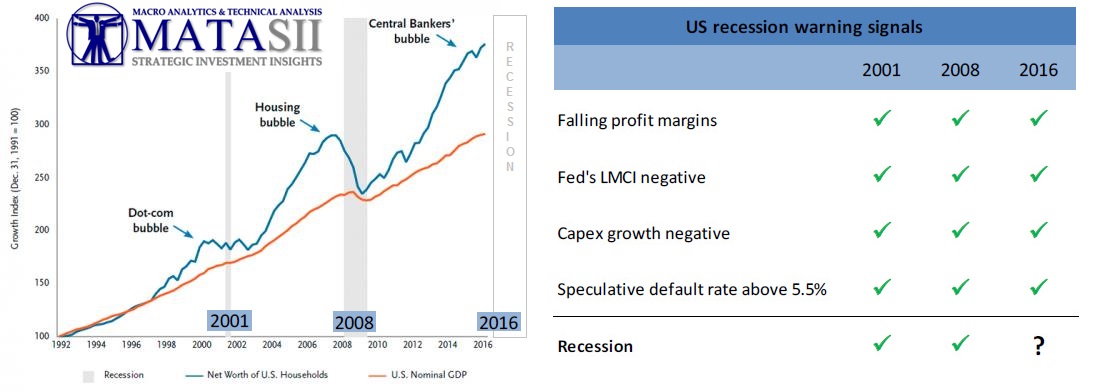
KEY INDICATORS SAY YES!
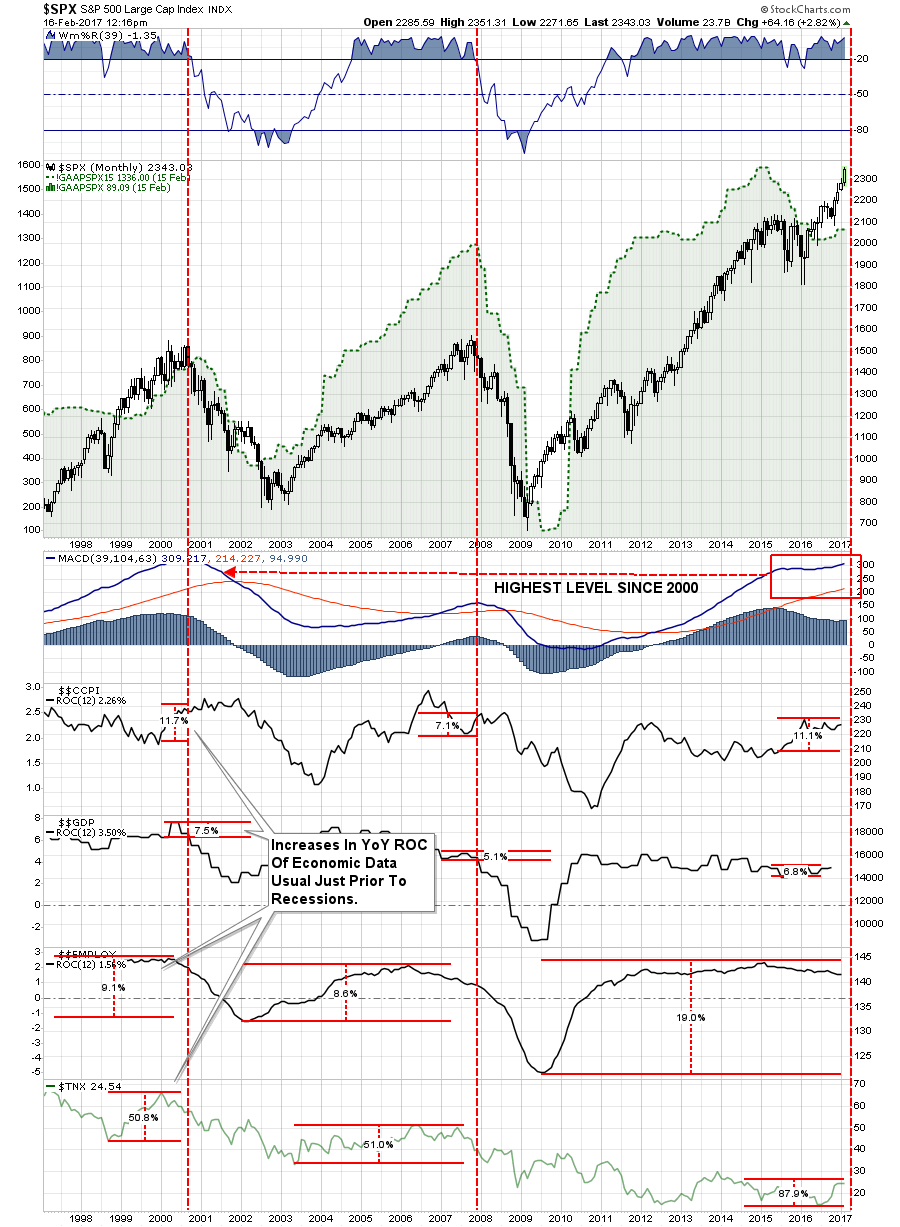
In both previous bull market peaks we find, as measured as a percentage change from the previous bottom to current level, the following:
- CORE INFLATION rose 11.7% and 7.1% just prior to the recession. Currently, Core CPI is up 11.1%
- GDP GROWTH picked up by 7.5% and 5.1% just prior to the recession. Currently, GDP is up 6.8%
- EMPLOYMENT was up from lows by 9.1% and 8.6%. Currently, Employment is up 19.0%
- INTEREST RATES rose 50.8% and 51% from lows. Currently, Rates are up 87.9%
EXTRACTED FROM: 02-17-17 Lance Roberts via RealInvestmentAdvice.com,
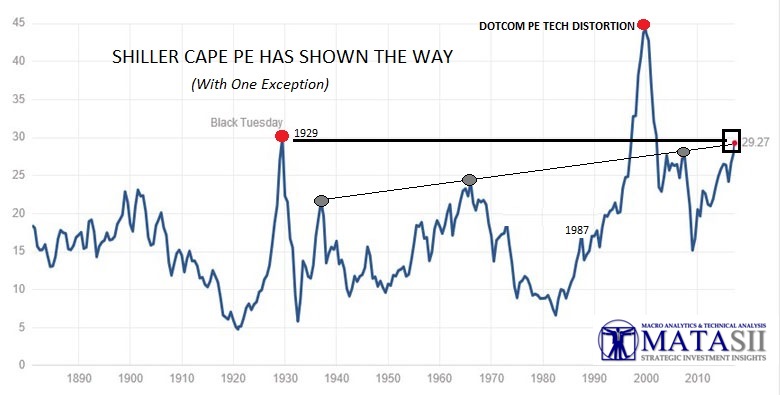
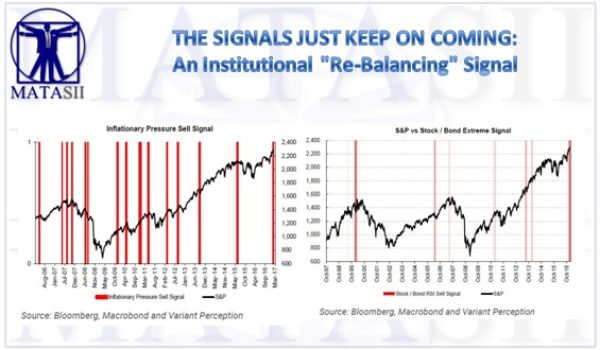
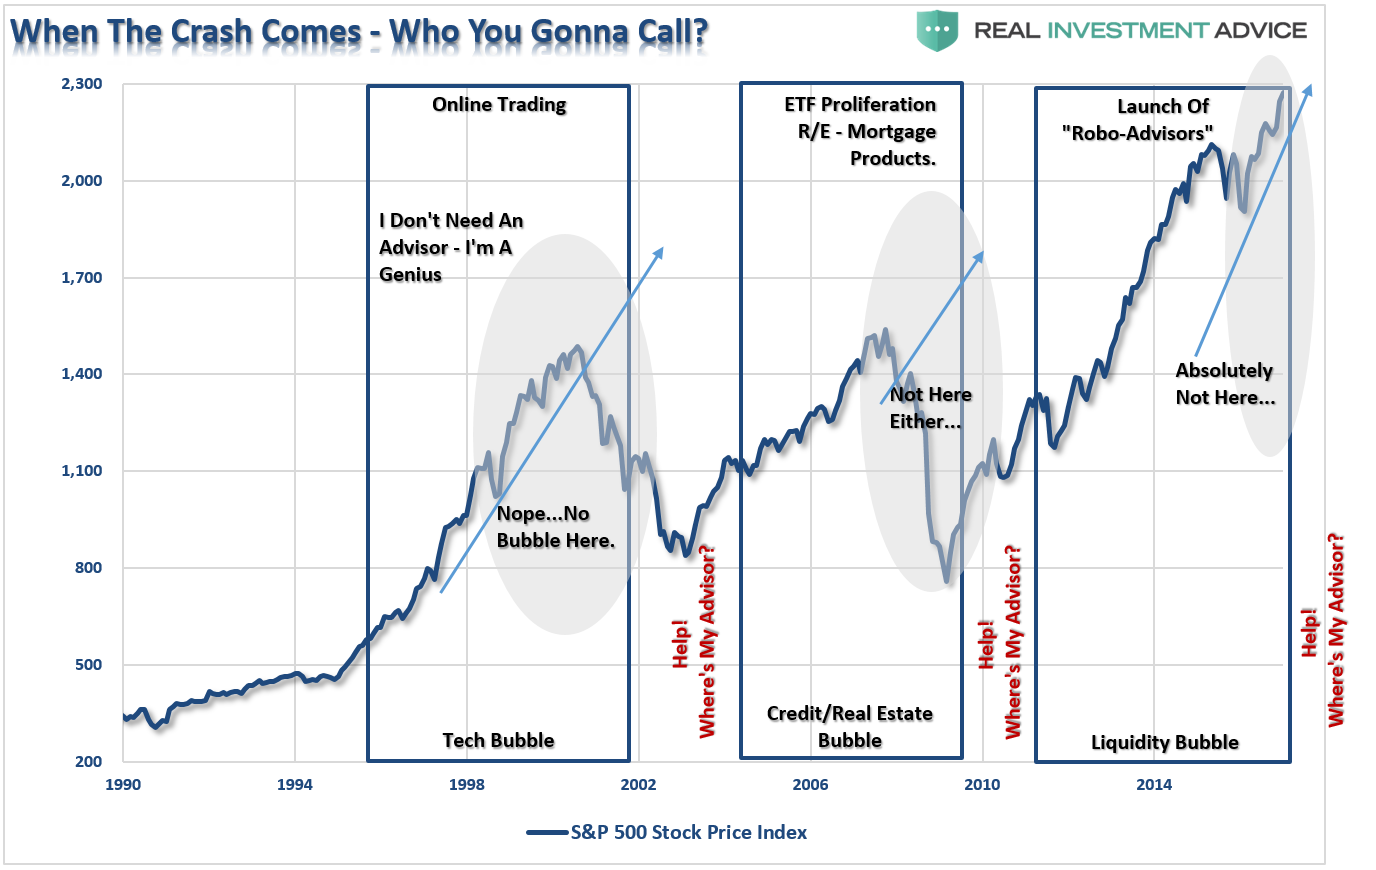
The exuberance in the markets, as witnessed by the net positioning of large speculators, has reached records on both ends of the spectrum. Those extremes, combined with spiking levels of “hope” in both the financial and economic data is all too reminiscent of the past.
Over the last couple of weeks, there have been numerous comparisons between the current market and that of the 1920’s, the 1980’s and just about everything else in between. The problem with similarities in market price patterns is that it fails to take into account the underlying factors such as employment, inflation, interest rates, and economic growth.
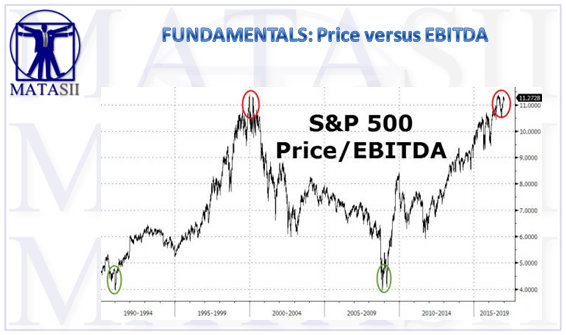
When looking at those variables along with some technical indicators, we find similarities to past bull market peaks.
“But Sir, all the economic data is improving. So the bull market still has room to go.”
Let’s take a look at the chart below.
In both previous bull market peaks we find, as measured as a percentage change from the previous bottom to current level, the following:
- CORE INFLATION rose 11.7% and 7.1% just prior to the recession. Currently, Core CPI is up 11.1%
- GDP GROWTH picked up by 7.5% and 5.1% just prior to the recession. Currently, GDP is up 6.8%
- EMPLOYMENT was up from lows by 9.1% and 8.6%. Currently, Employment is up 19.0%
- INTEREST RATES rose 50.8% and 51% from lows. Currently, Rates are up 87.9%
As we saw just prior to the beginning of the previous two recessions, such a bump is not uncommon as the impact of rising inflation and interest rates trip of the economy. Given the extreme speculative positioning in oil longs, short bonds, and short VIX, it won’t take much to send market participants scrambling for the exits.
While I am NOT suggesting that we are about to have the next great market crash tomorrow, the current sensation of “Deja Vu” might just be worth paying attention to.
IS STAGFLATION THE STALKING CATALYST?
THE ANSWER IS CRITICAL TO YOUR FINANCIAL HEALTH!
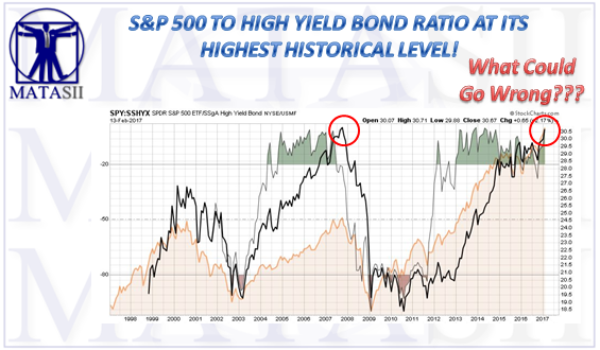
 It is important to anticipate whether Stagflation is stalking because the yield curve will start pricing it in which will place equity yields, earnings and PE growth multiples at risk.
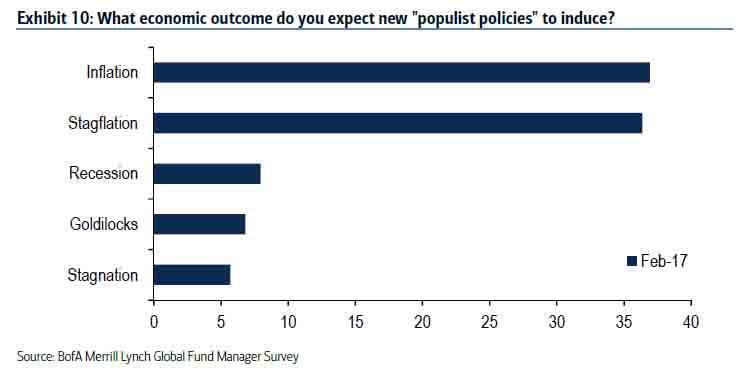
We believe there are clear signs of stagflation already occurring and according to the recent Global Fund Manger Survey many already believe, if we don't have elevated Inflation and an emerging period of Stagflation, we can soon expect it!
YIELD CURVE
What is particularly critical to the equities markets is how the yield curve will react differently regarding whether it anticipates increasing Inflation through Reflation or Stagflation. If it views reflation the yield curve will shift up but also steepen as long-term yields increase faster than short term yields. If it sees stagflation because the drivers for inflation also impede economic growth, then the yield curve also shifts upward but instead can be expected to flatten. The longer-term yields rise slower than the short term yields.
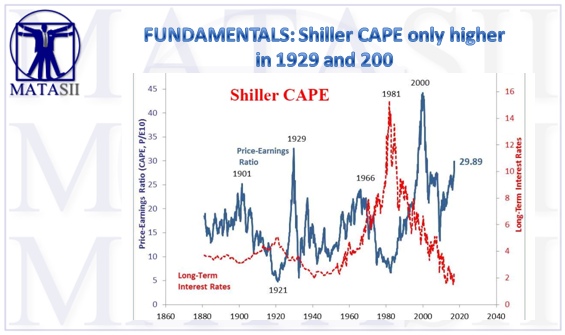
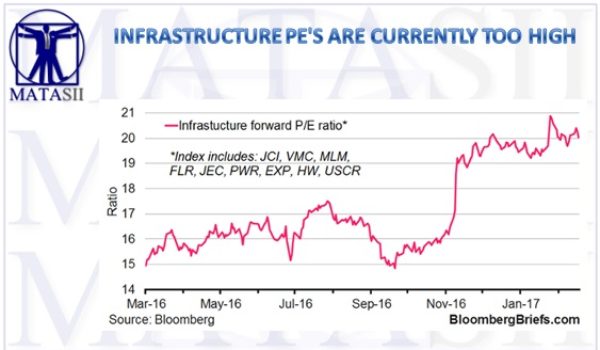
In both case yields rise which places pressures on equities but the shape of the yield curve has the most profound impact on equity prices. In the last 5 years 71% of equity index increases are a result of P/E multiple expansion from 10X to 18X. This places PE multiple of the S&P 500 currently in the 90 percentile of historical valuations relative to the last 40 years. Anticipating what may occur is presently of the utmost importance to smart investors.
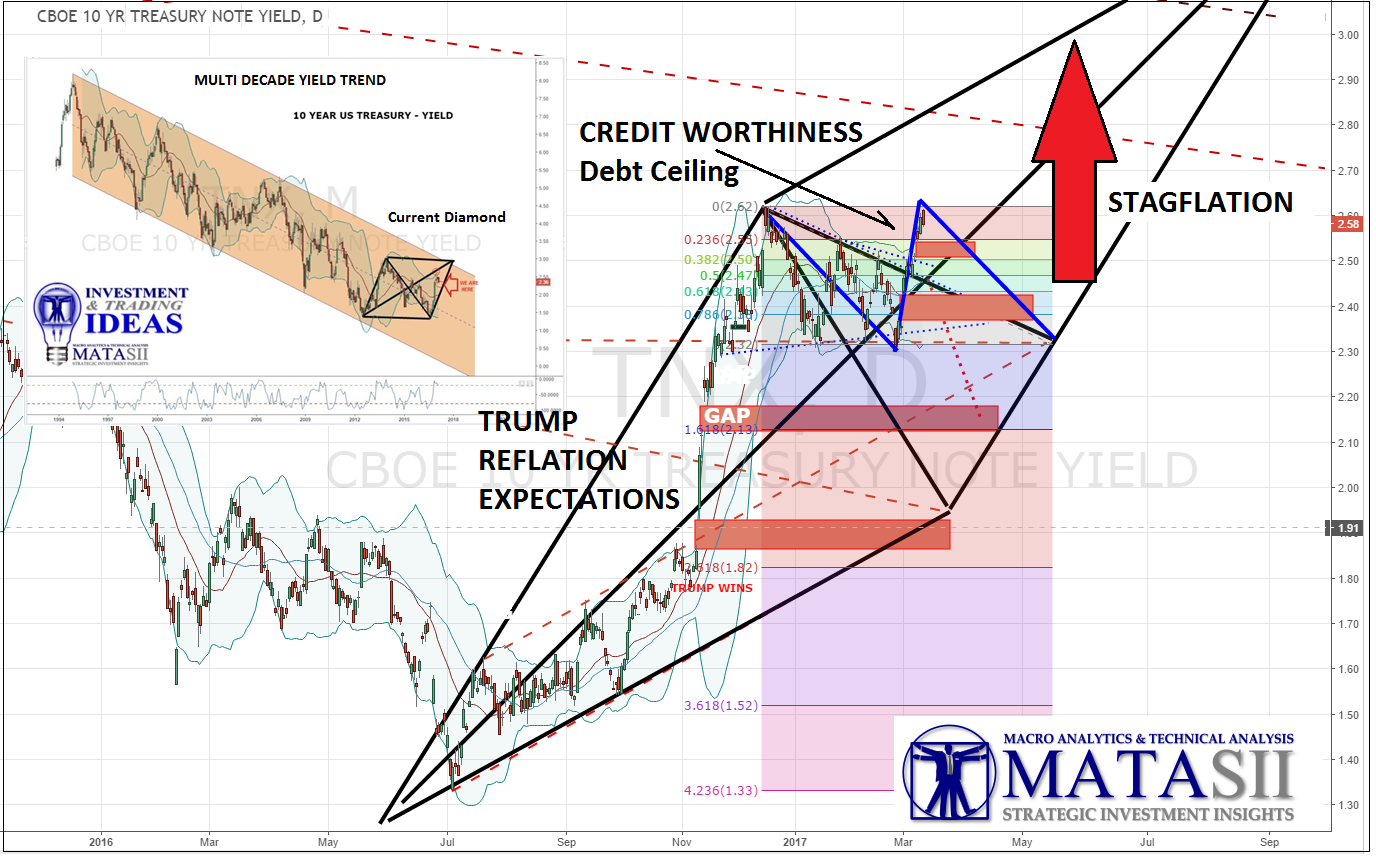
The 10 Year US Treasury Yield lifted violently on the Trump victory and reflation policy expectations. After a brief consolidation it has again aggressively moved up but it is important to view this as part of three reasons bond yields increase - 1- Economic growth rate, 2- Inflation and 3-Creditworthiness. The current Treasury yield lift in my judgment is more about the pending US debt ceiling congressional hurdles and potential Creditworthiness factors than reflation or stagflation concerns.
STAGFLATION
STAGFLATION: "Is persistent high inflation combined with high unemployment and stagnant demand in a country's economy"
 Stagflation is very costly and difficult to eradicate once it starts, both in social terms and in budget deficits. It is a situation in which the inflation rate is high, the economic growth rate slows, and unemployment remains steadily high. It raises a dilemma for economic policy, since actions designed to lower inflation may exacerbate unemployment, and vice versa. Historically, inflation and recession were regarded as mutually exclusive, the relationship between the two being described by the Phillips curve.
Economists offer two principal explanations for why stagflation occurs:
First (Think: '70's) stagflation can result when the productive capacity of an economy is reduced by an unfavorable supply shock that causes an increase in the price of oil for an oil-importing country. Such an unfavorable supply shock tends to raise prices at the same time that it slows the economy by making production more costly and less profitable. Milton Friedman famously described this situation as "too much money chasing too few goods".
Second (Think today), both stagnation and inflation can result from inappropriate macroeconomic policies. For example, central banks can cause inflation by allowing excessive growth of the money supply, and the government can cause stagnation by excessive regulation of goods markets and labor markets. Excessive growth of the money supply, taken to such an extreme that it must be reversed abruptly, can be a cause. Both types of explanations are offered in analyses of the global stagflation of the 1970s: it began with a huge rise in oil prices, but then continued as central banks used excessively stimulative monetary policy to counteract the resulting recession, causing a runaway price/wage spiral.
Let's consider the four elements of stagflation, 1- Inflation, 2- Unemployment, 3- Demand and 4- GDP Growth to see whether this is a real possibility for the US.
1- INFLATION
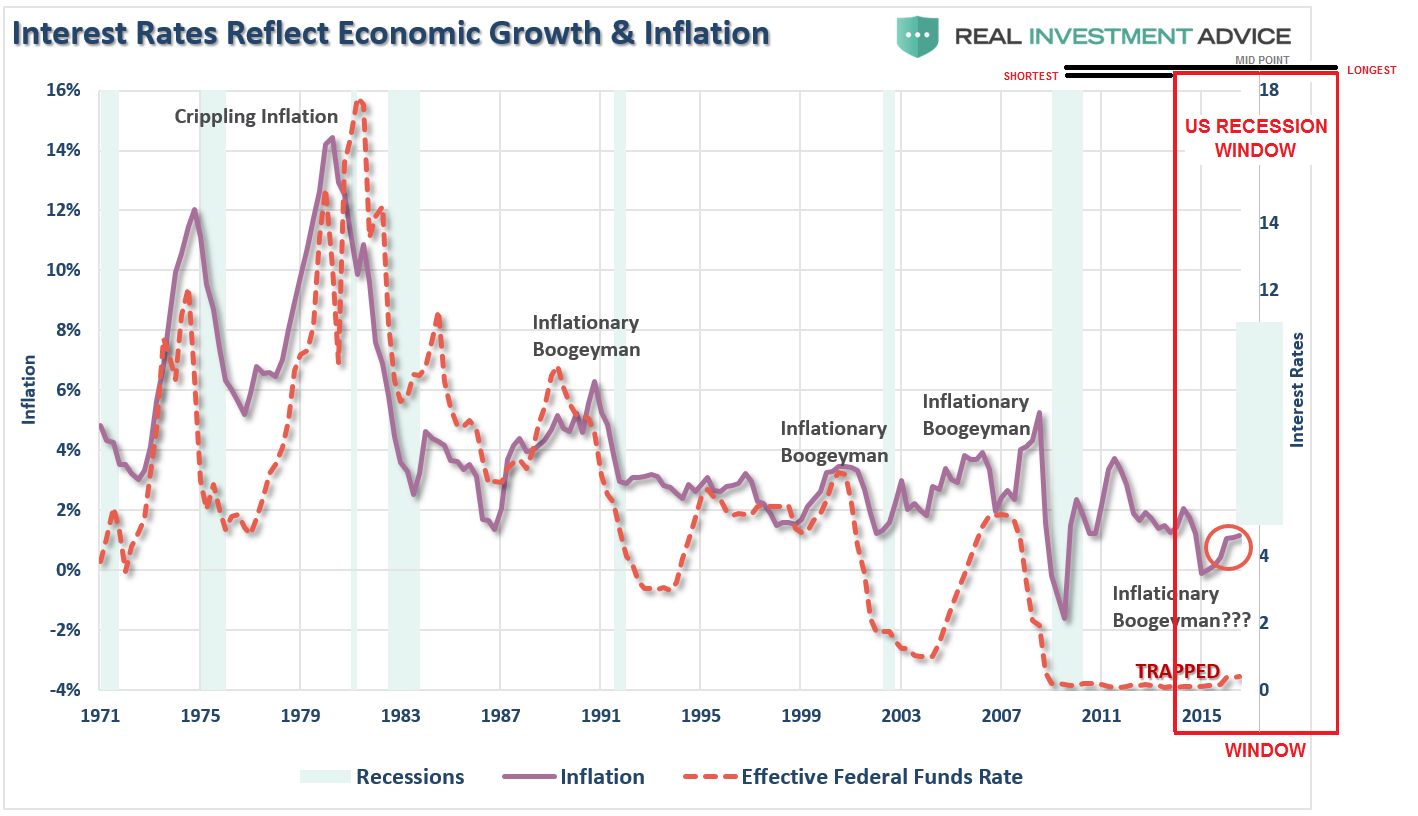
According to The Federal Reserve, entrusted with monitoring and managing Inflation pressures in the economy, until recently it is has been low and well below the Fed's 2% target. But the times they are a changing!
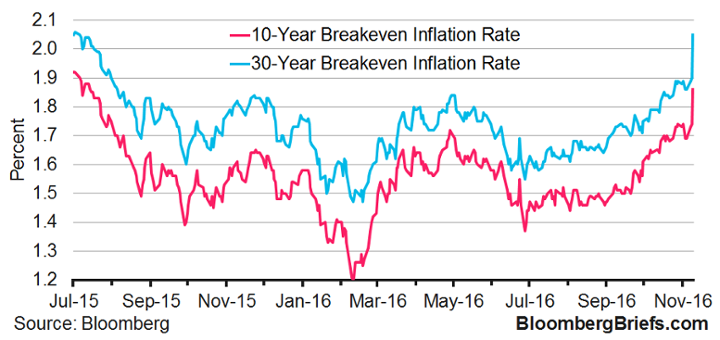
Since this time last year inflation expectations have been increasing steadily and rose even more dramatically with the Trump Presidential victory. The Trump spike was a result of his proposed economic stimulus programs such as Infrastructure and Defense.
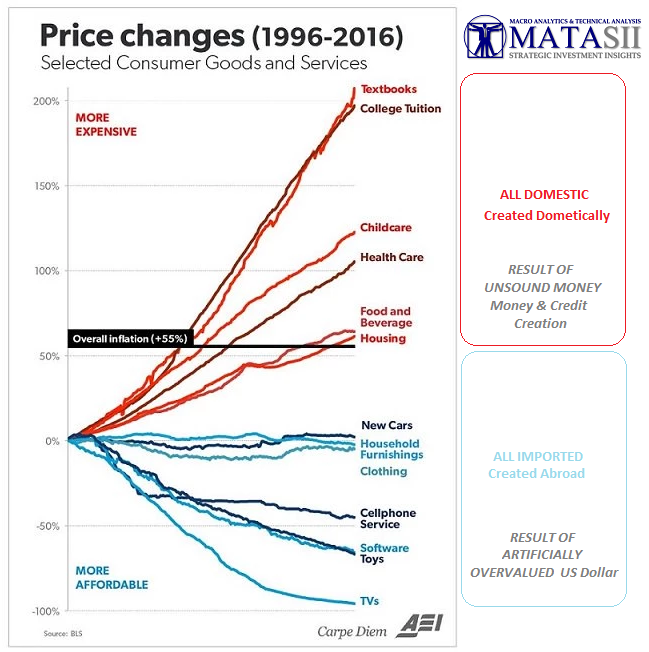
However, it is isn't just expectations that have been increasing, but also actual price tags.
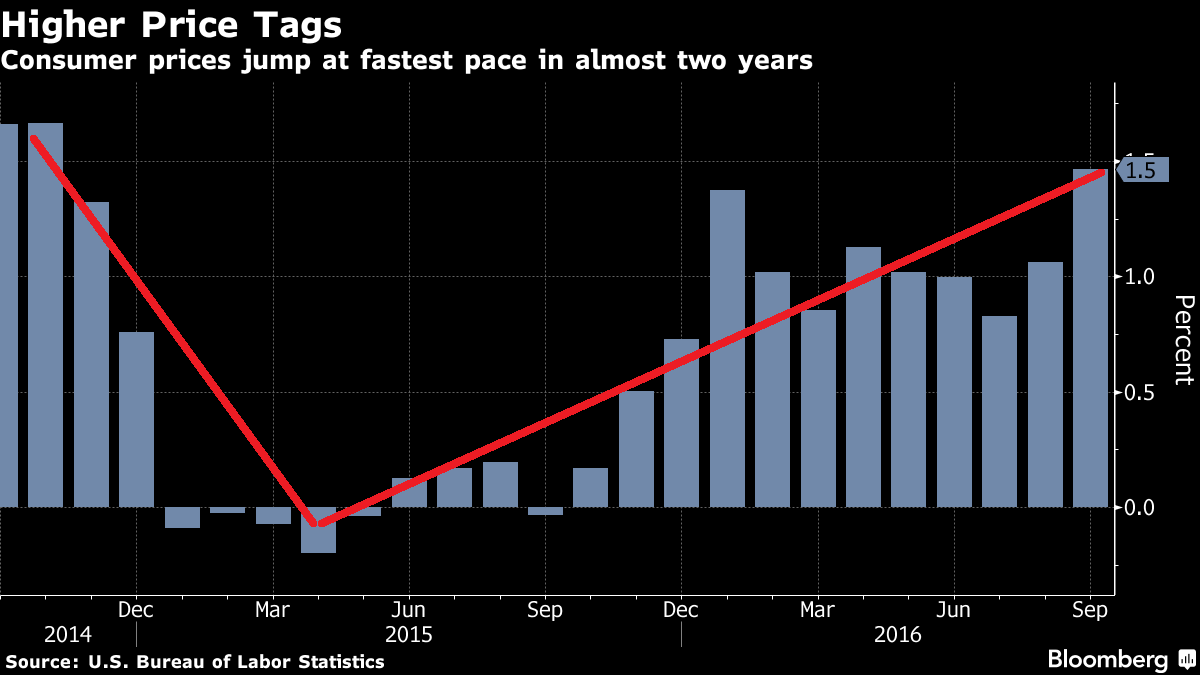
Some price increases have been much higher than how such measures as the CPI tabulates inflation.
From a long term historical perspective (if you believe government statistics) the inflation rate is still relatively low.
However, taking out "special" government adjustments such as "Substitution", "Hedonics" and "Imputation" along with the other changes that have been made by the government since the early 80's, we see the real picture.
ShadowStats.com which tracks inflation closely show that in fact if we consider inflation in terms of how the government calculated it in 1980 (before interest rates started falling abruptly) you find it approximates 10% per annum! I personally believe this much more closely matches what the average US household would suggest they are experiencing.

CONCLUSION: We DEFINITELY have inflation and it is worse than the Federal Reserve acknowledges or is actually aware!
2- UNEMPLOYMENT
According to the government narrative we have low unemployment with concerns about a tight labor market. This is pure fabrication or minimally misinformation and distortion of the facts. John Williams at ShadowStats again shows the reality.
The ShadowStats Alternate Unemployment Rate for January 2017 is 22.9%.
 '
'
We presently have a labor force participation level at historically low levels with nearly 100 million working age adults not in the work force and many with jobs not able to to get sufficient hours to support a middle class life style.
As Presidential candidate observed at a campaign rally in front of 30,000 people. "If the unemployment rate was really 5% do you think we would really have this many people here!" Do you believe government statistics or "your lying eyes"?
CONCLUSION: We have high a very high unemployment and under-utilization of the American workforce.
3- DEMAND
What we have in the US is "Artificial Demand" rather than "Stagnant Demand". The difference being that the former temporarily camouflages the later - but only temporarily as in reality we have "Stagnant Demand" being camouflaged by massive credit expansion and low finance rates. This only brings demand forward creating a demand void in the future.
Consider that Consumer Credit is rising rapidly in comparison to Disposable Income. In other words we are borrowing increasingly to make ongoing purchases but those purchases are not increasing. Debt is surging to buy the same amount of stuff -- not more. In reality real economic demand is shrinking and is only presently artificially being supported.
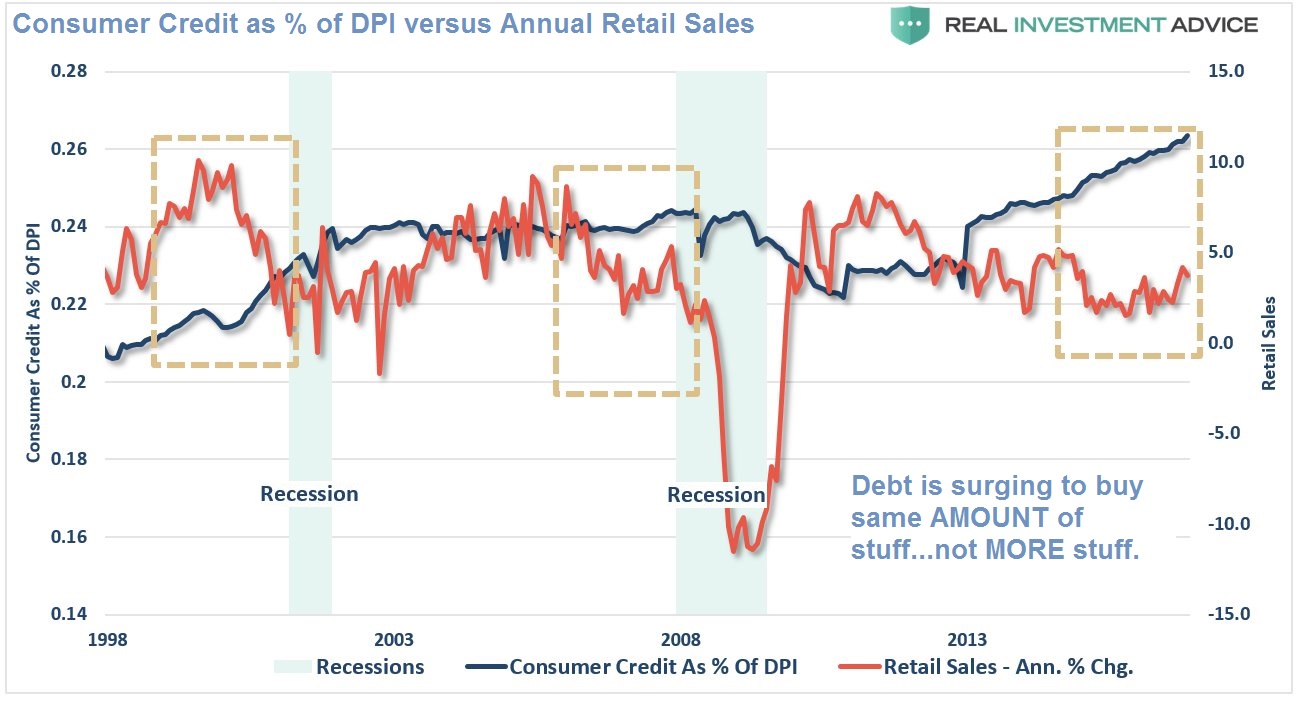
CONCLUSION: We have Weak Demand being supported by high levels of credit in relationship to disposable income.
4- GROWTH
How can the US current GDP levels seen to be anything other than terribly weak! Thus far this quarter 1Q17 is tracking at 1.8%
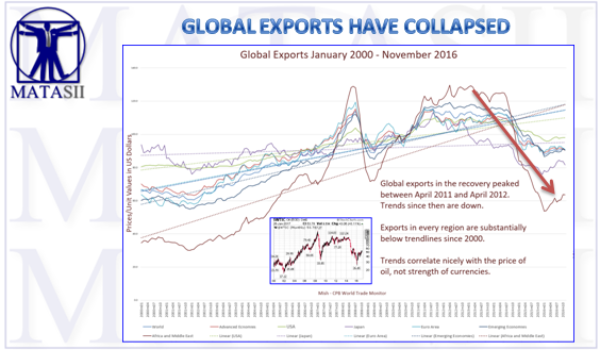
The common narrative is that the US is entering a golden age in its economy and that this growth will drive stocks ever higher. The reality is that GDP growth has collapsed. The third quarter of last year (3Q16) was the quarter everyone thought signaled a new beginning with growth of 3.5%. However, the very next quarter’s growth (4Q16) collapsed to 1.9%.
Put simply, growth is NOT coming soon if at all. Even Trump’s top economic advisor has admitted that GDP growth of 3% is unlikely until the end of 2018.
CONCLUSION: We have historically weak economic growth
SUMMARY
It is hard not to conclude that we are already living in a period of STAGFLATION which the markets have yet to fully recognize (may we suggest "Cognitive Dissonance"?).
There is little way out other than praying for the Trumponomic Economic miracle that the markets are so clearly euphoric about! Of course I have never found prayer as a reliable approach to investment strategy!
CHARTING THE MARKET SIGNALS
Why are we getting such diverging and maddening market messages from the equity and bond markets? Which one is right? Are either right?
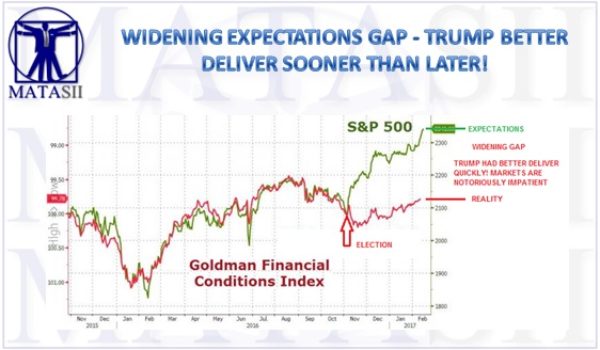
MARKET PERCEPTIONS
Let's consider the perceptions of each of these markets:
EQUITY MARKET
- The Equity Markets perceives Trumponomic Policy SUCCESS ahead and are aggressively pricing it in!
- The level of excitement has now reached the levels that it can safely be categorized as EUPHORIC.
BOND MARKET
- The perception of the Bond market is the REALITY of whether Trumponomic Policy will actually be implemented and within expected time frames investors mistakenly believe will happen.
- The level of concern can be safely categorized as CAUTIOUS.

CORE QUESTIONS ON THE TABLE
Maybe the real underlying questions that need to be answered by thoughtful investors are the following:
- WHAT exactly are the details of the Trumponomic Policies? We have a lot of populist rhetoric, but as of yet we have little tangible detailed substance. The devil always lies in the details!
- IF in fact these policies can actually be implemented based on a clearly hostile democratic party within congress as well as significant conflict within the GOP from staunch fiscal conservative members and the Tea Party advocates.
- WHEN these policies can be implemented is a the major unknown? There is a congressional sequence that must be followed so that an encompassing congressional budget bill can be passed. The reinstatement on March 15th of the Fiscal Debt Ceiling is not a small hurdle to be overcome nor the creative ways the Democratic Party will do everything its power to derail and slow any implementation!
- RESULTS are also a major unknown. The Fiscal Stimulus, Tax Cuts and Regulatory Reduction all play well as populist policy and did work during the Reagan Administration, but will they actually work today? Many including Reagan's OMB Director, David Stockman vehemently say they won't.
Let me categorically state that in no way am I trying to be critical of the Trump Administration. I am simply, in an unbiased fashion, trying here to understand the competing views.
I would suggest that people's political bias is presently clouding their investment thinking!
To assess who is likely right we might additionally segment who we are talking about with these views.
EQUITY MARKET
We must not forget that there are two sides to the Equity Market:
THE SELL SIDE
- Wall Street Brokerage Houses selling securities and transaction volumes,
- Fund Managers wanting to attract more Assets Under Management (AUM),
THE BUY SIDE
- Institutions who do their own research and are not in the habit of disclosing their investment strategies,
- Private Funds and High Net worth Individuals who study closely metrics such as "flows" , "volumes", "divergences", "macros", "Sentiment" etc. etc.
The public has visibility to the Sell Side primarily because it dominates the media in an attempt to sell its products. The Buy Side on the other hand seldom wants to disclose its investment thinking and is not typically found talking on CNBC.
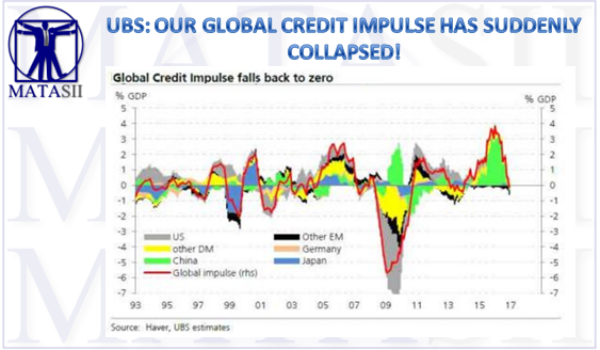
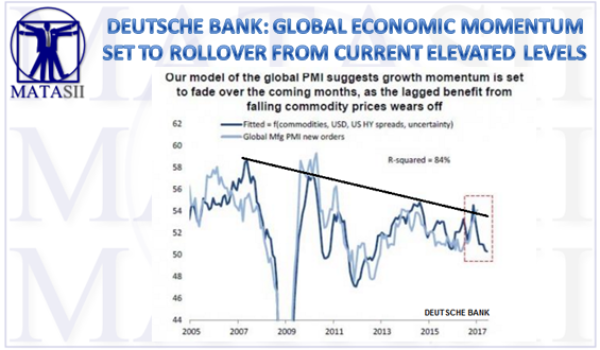
My discussions with the Buy Side suggests that with respect to the equity markets, they are presently in the Bond Market camp! They point out the concerns with the global landscape that few are paying any attention to:
CONCLUSION
Do we really need to know more to assess who is likely right?
Is it those who have unemotionally studied the situation, or those who have "faith", "believe" and are "afraid to miss out"?

A proven strategy has always been in situations like this:
"Be fearful when most aren't - be bold when most are fearful"
We presently have BOTH between the Equity and Bond markets. Who you favor may make all the difference to your financial health!
I KNOW WHO'S SIDE I AM ON!
I have seen this rodeo once too many times! I see a US Recession looming and bursting the Trumponomic Bubble!