
IN-DEPTH: TRANSCRIPTION - A CORROSIVE, “CASCADING CHINESE CRISIS”
COVER

AGENDA
Shown here is the agenda I plan to cover in this session.

SLIDE 5
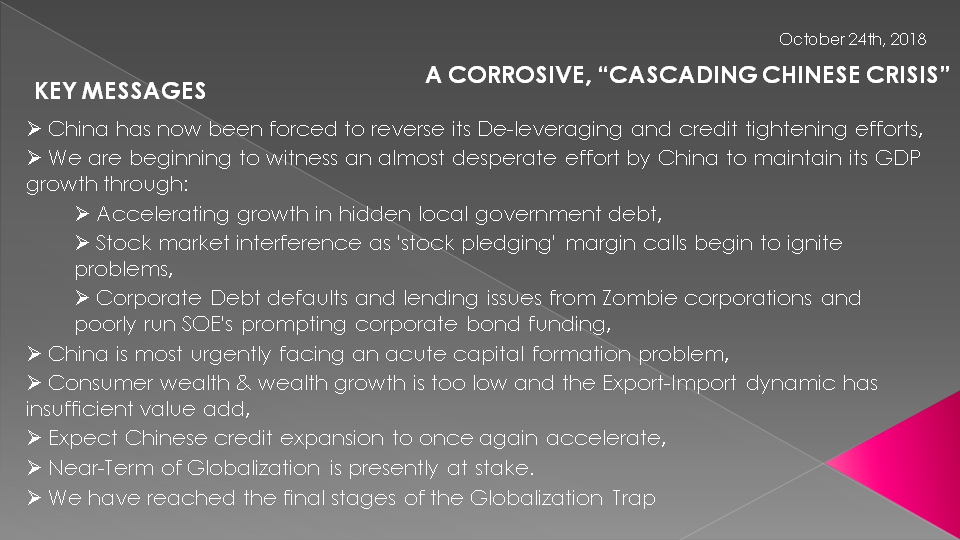
My hope is to leave with you the following message:
- China has now been forced to reverse its De-leveraging and credit tightening efforts,
- We are beginning to witness an almost desperate effort by China to maintain its GDP growth through:
- Accelerating growth in hidden local government debt,
- Stock market interference as 'stock pledging' margin calls begin to ignite problems,
- Corporate Debt defaults and lending issues from Zombie corporations and poorly run SOE's prompting corporate bond funding,
- China is most urgently facing an acute capital formation problem,
- Consumer wealth & wealth growth is too low and the Export-Import dynamic has insufficient value add,
- Expect Chinese credit expansion to once again accelerate,
- Near-Term of Globalization is presently at stake.
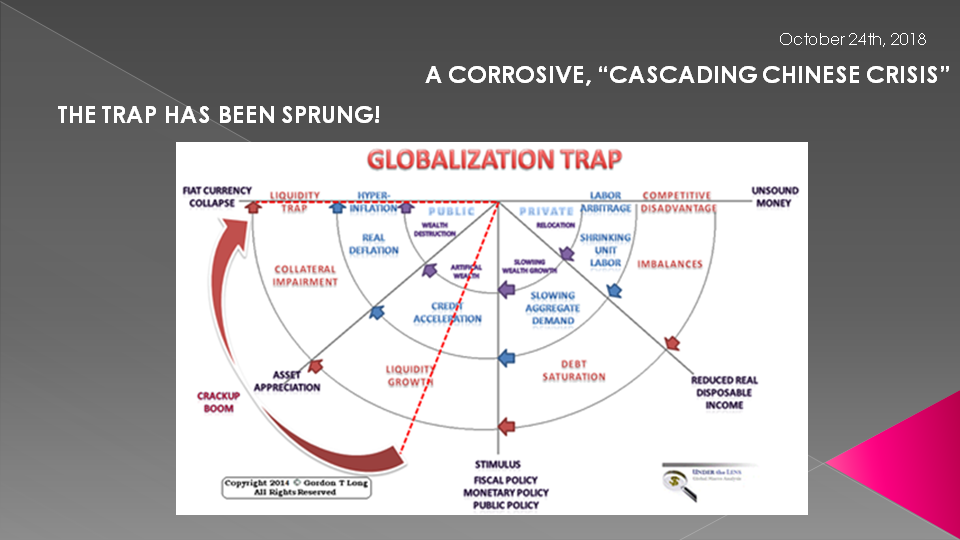
- We have reached the final stages of the Globalization Trap
SLIDE 6
In our April, UnderTheLens video we delved into China from a perspective of:
- The Size and Growth of Corporate Debt,
- The reality that is China's 150,000 SOE (Stated Owned Enterprises) and their impact,
- The dominance of State Owned & Controlled Bank Lending.
SLIDE 7
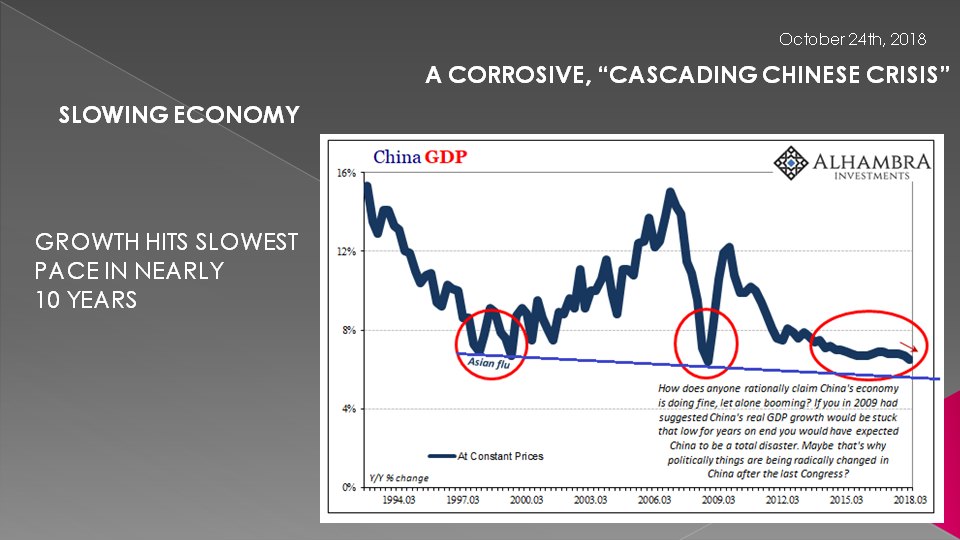
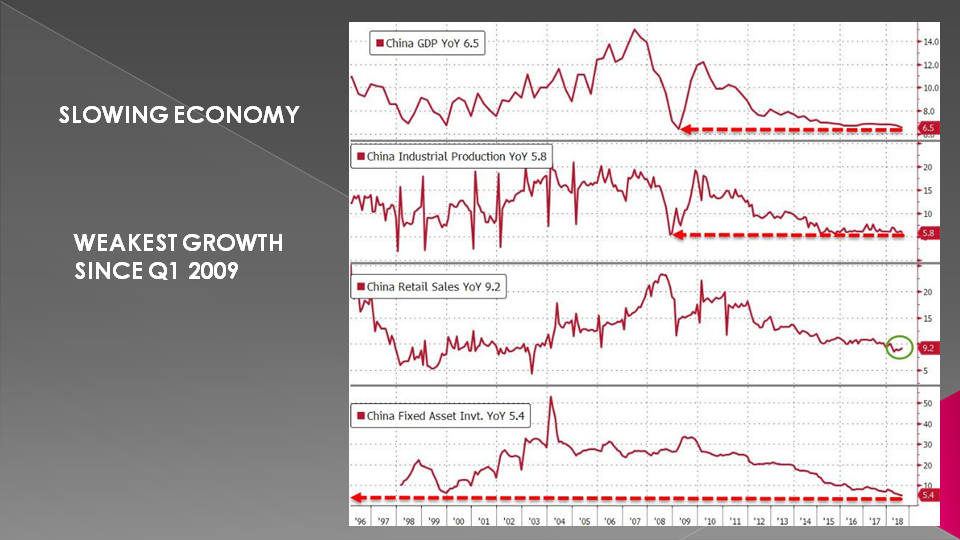
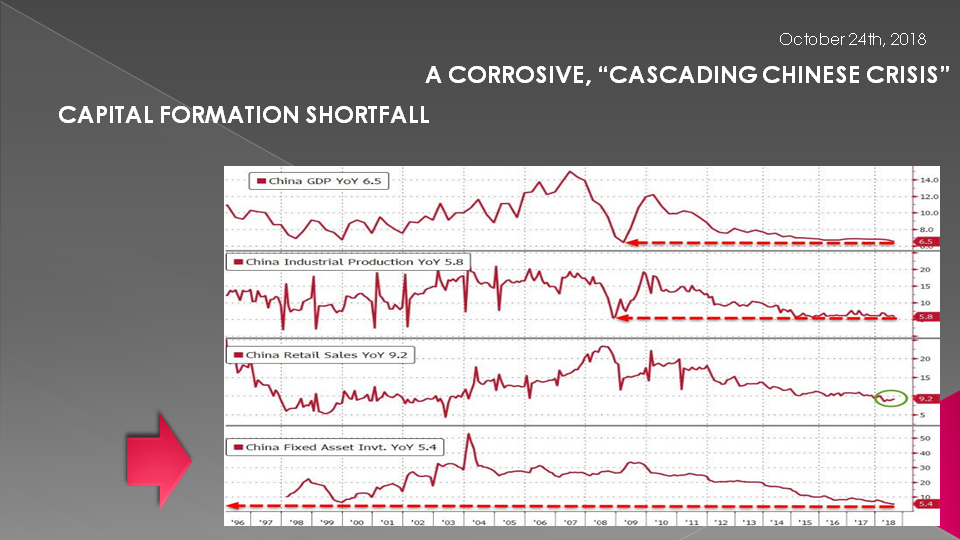
Seven months after this video we see that the latest Chinese economic statistics are at the lowest in 10 Years. Real GDP, is just 6.5% in Q3 2018 - it’s the slowest pace since the first quarter of 2009. That’s not good especially for a statistic of such dubious practices often specifically crafted to be the best it can be.
What that suggests is that we are likely not going to witness an immediate catastrophe, rather offering instead a more complete confirmation that this major global economy is slowing. This is significant what is significant is there is no longer upside but rather a steady downside driver to the global economy.
SLIDE 8
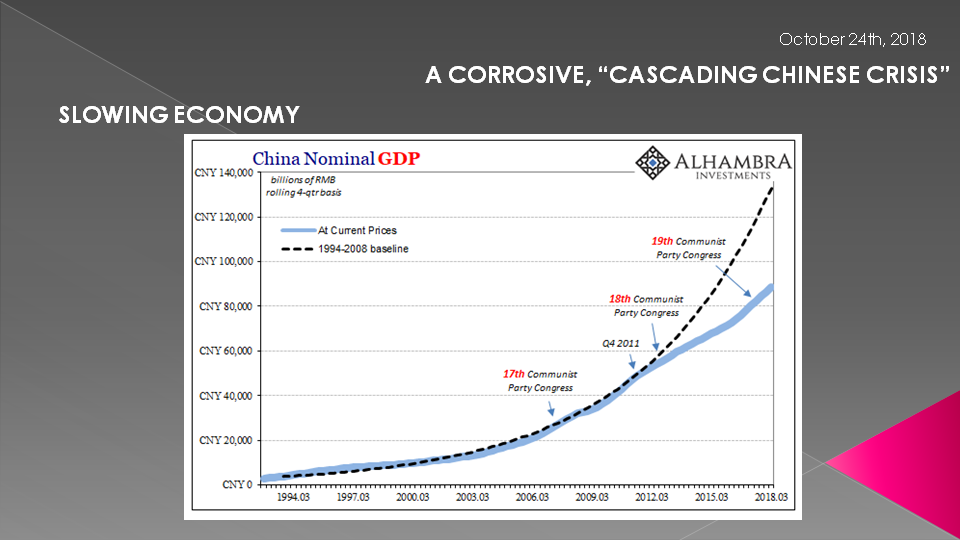
Nominal GDP, perhaps a more appropriate measure of China’s economic conditions, decelerated yet again in Q3. Year-over-year, it rose just 9.6%, down from 9.8% in Q2 and a peak of 11.7% set way back in Q1 2017. These numbers may sound great in comparison to the US , but as you will see in a moment it is about what makes up China's GDP.
SLIDE 9
Across the board - whether Industrial Production...
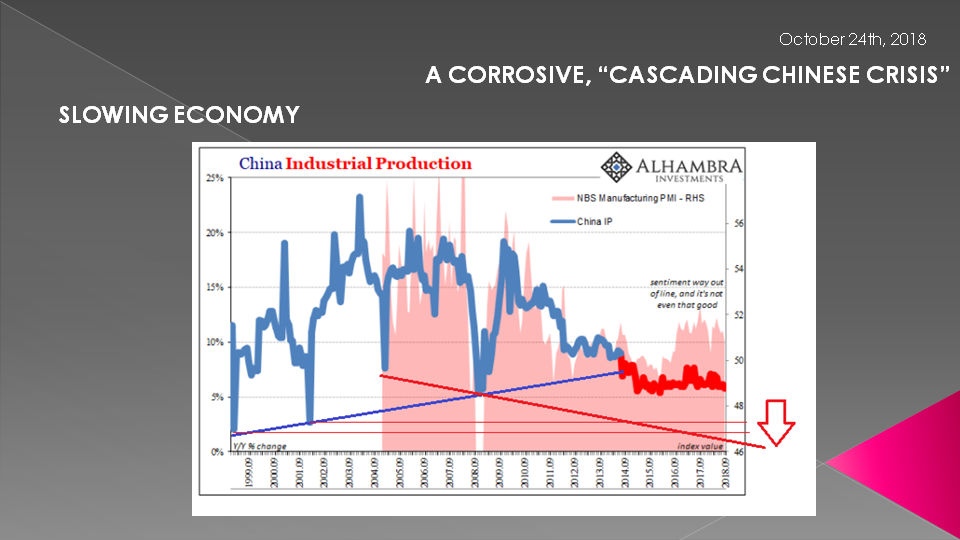
SLIDE 10
... or Retail Sales ...
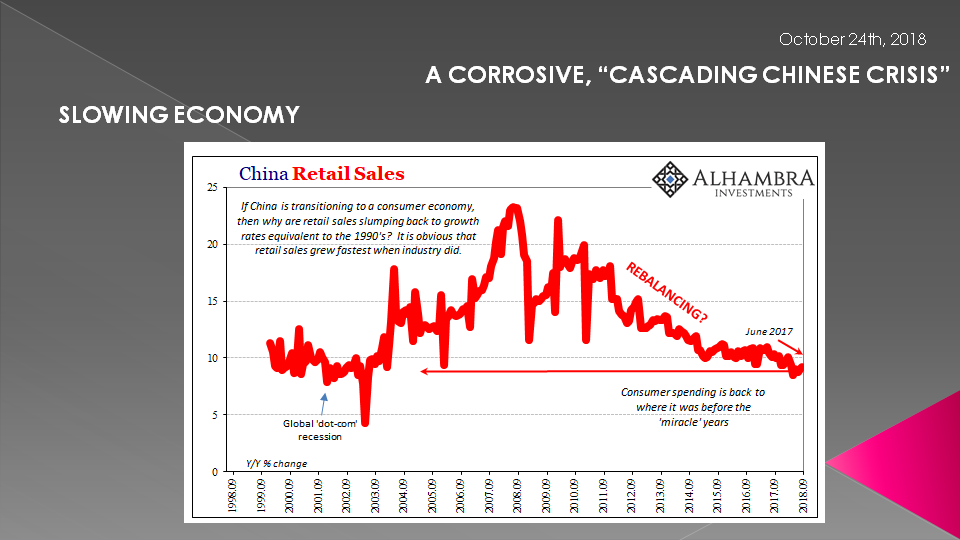
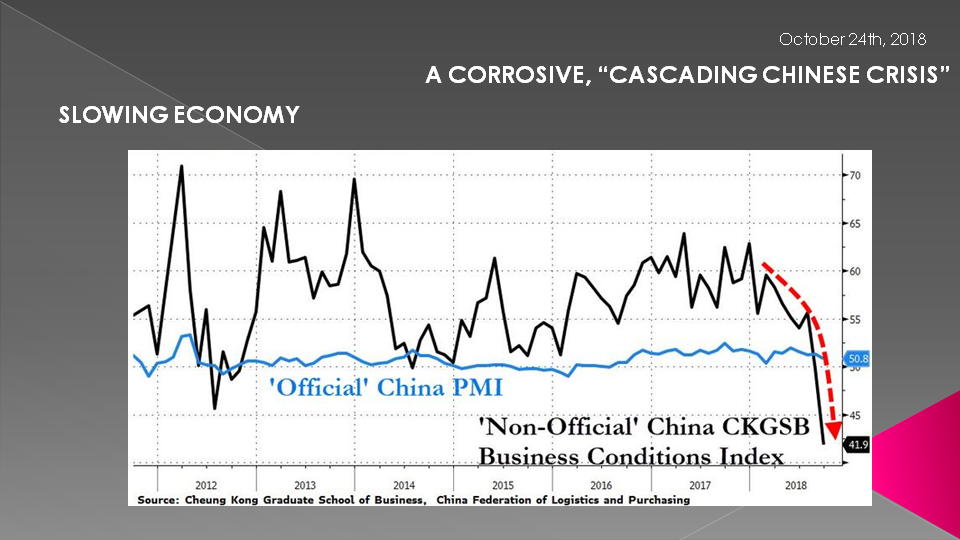
SLIDE 11
Economic conditions are steadily deteriorating.
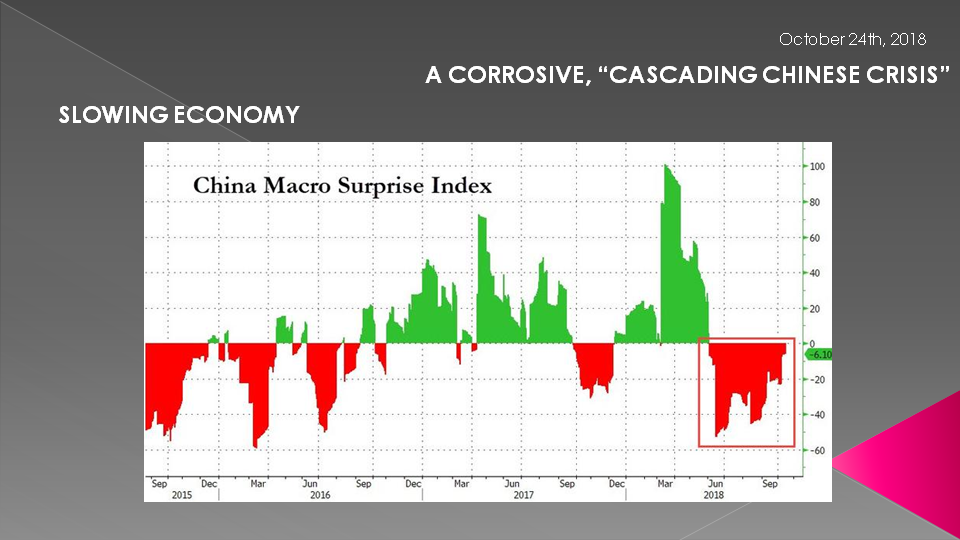
SLIDE 12
The news and economic surprises are increasingly negative.
The real danger presented by these statistics is not an imminent crash but rather, most importantly as I just said is the total disappearance of any upside potential.
Even during 2017, the narrative about globally synchronized growth continued as a future property. The global economy in that year was clearly better than it was during the worldwide downturn 2015-16, easy comparison, and that was expected only as the first step toward meaningful acceleration and then recovery.
Where Economists and central bankers jumped the gun was in assuming that 2017’s improvement was the only evidence they needed for those complete expectations.
As it has turned out, as it always turns out, changing from minus to plus signs is a necessary condition for better days but not by itself a sufficient one.
SLIDE 13
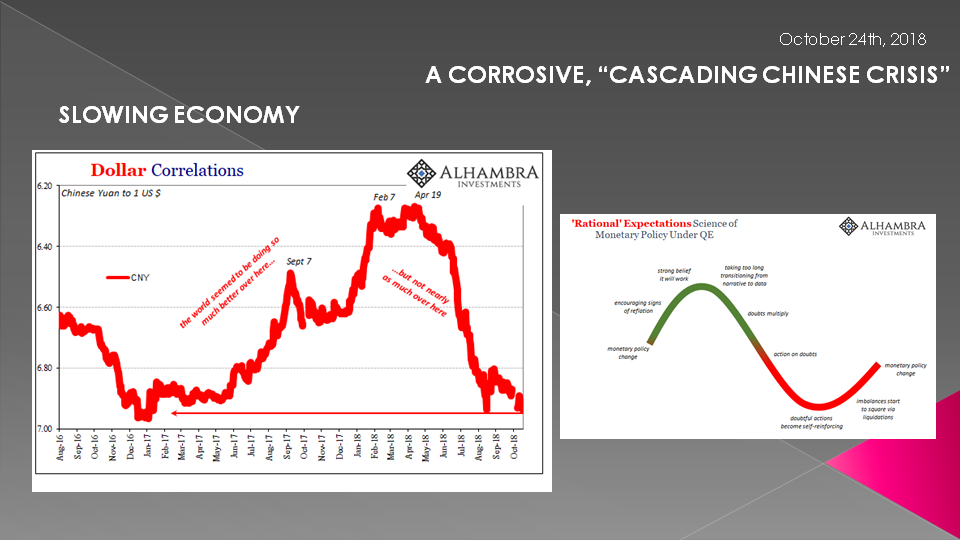
Acceleration requires momentum among other factors, and momentum is derived from conviction. The best days of 2017 never really had that, the absence perhaps clearest in China (particularly the hollow rebound of the Chines Yuan (CNY) which “somehow” lacked “capital inflows”). – A THEME WE WILL KEEP COMING BACK TO.
Everyone kept waiting for the Chinese to zoom on ahead and bring the whole up with them. Meanwhile, in China they kept waiting for the rest of the world to take the lead so as to pull them up out of their funk. That’s been the thing about “global growth” since 2011, everyone expects that someone else will solve their economic problems for them. Momentum will arrive -- you see -- it’ll come from somewhere else.
Without a clear path to that next step toward recovery, doubts multiply rather than abate. What was for a time mild opportunity reflation, now sinks back toward the malaise of liquidity risks that over time can only return to self-reinforcement.
This is what’s significant about China’s numbers today. They practically declare reflation dead and gone.
There is no upside left, what you saw in 2017 was the best of it – and it wasn’t very good.
It was, in honest analysis, not really that much better than 2016 at all; certainly less than the prior peak.
SLIDE 14
China’s economy is not crashing!
However, it is slowing and from an already weakened level. The Chinese system did not actually recover from the last downturn despite now three years distance. What these numbers show is that, like the Eurodollar system, there is now very little chance that it ever will. It may not seem like much compared to a full-blown breakdown, but pretty conclusive evidence for a worldwide, multi-year (possible decade?) “L” shaped recovery should be terrifying.
SLIDE 15
A world without opportunity is a far more dangerous one than a world only temporarily stripped of it. The 'V' can be scary but only on the way down. The 'L' is, well, I think we’re going to find out about.
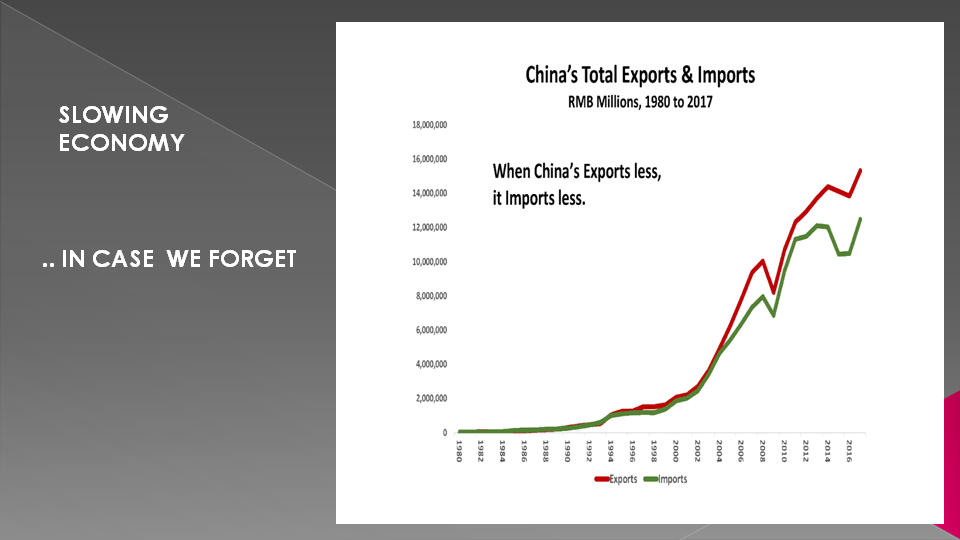
If China's export fall, the worlds exports fall!
SLIDE 16
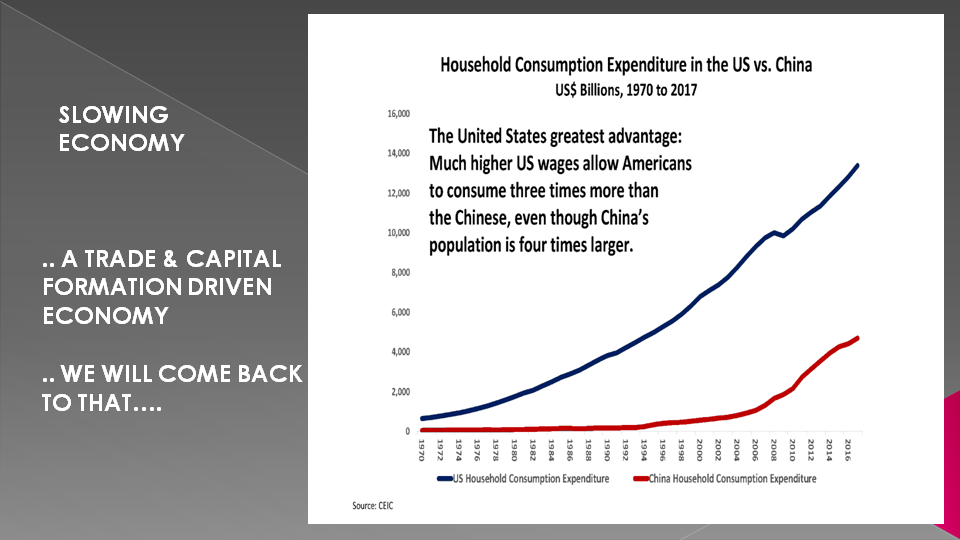
China can't turn to Consumption as the US has because it has built an economy on low wages. That is slowly changing but to accelerate will entail killing the "golden goose" of exports.
SLIDE 17
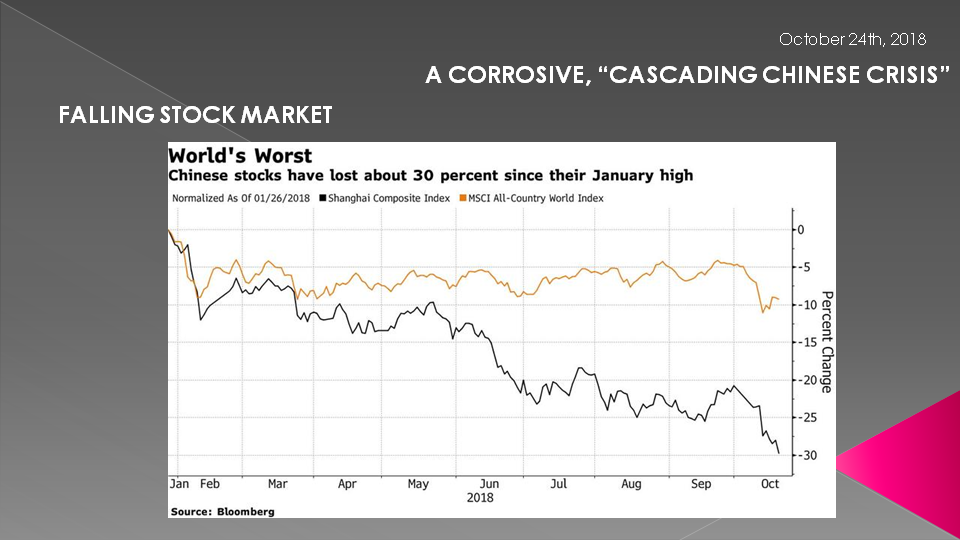
As a consequence, Chinese stocks as represented by the Shanghai Composite have dropped 30% below their January highs. The spread between China's market and the rest of the world is growing alarmingly wide.
Meanwhile, local government efforts to shore up confidence in smaller companies has failed to boost sentiment, while the yuan tumbled to 6.94, just shy of its one and a half year low of 6.9587 touched in August, after the U.S. Treasury Department stopped short of declaring China a currency manipulator, a move that some interpreted as giving Beijing breathing room to allow a weaker exchange rate.
SLIDE 18
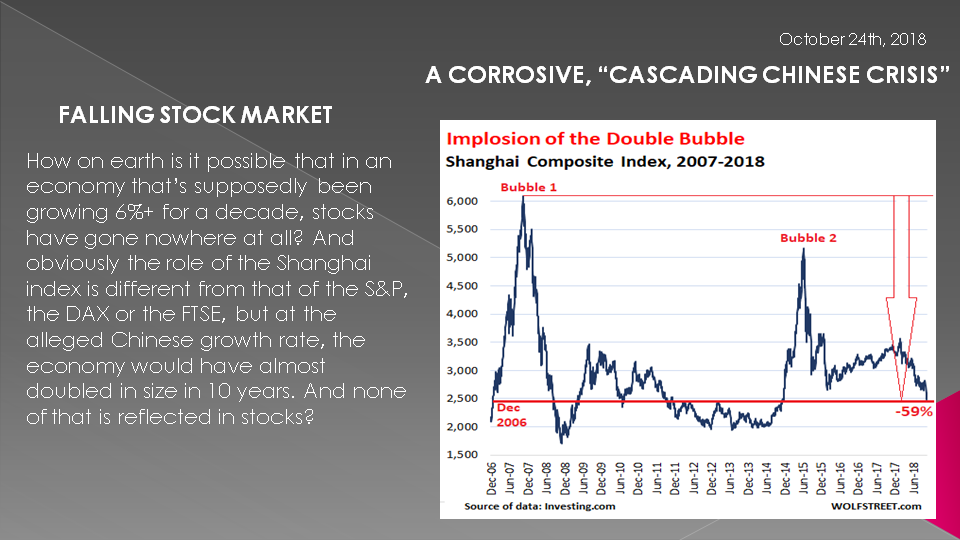
Equity markets are at their lowest since November 27, 2014, nearly four years ago.
- They are Down 52% from its last bubble peak on June 12, 2015 (5,166)
- They are Down 59% from its all-time bubble peak on October 16, 2007 (6,092)
- They are now back where they had first been on December 27, 2006, nearly 12 years ago.
If Beijing keeps on presenting all those growth numbers that look so solid, it’s asking for it.
Moreover, the Party has lost control over the shadow banks, and it couldn’t act to regain that control if it wanted. It could initiate a program to forgive debt owed to national banks, but what’s owed to the shadows will have to be paid. We’re talking many trillions here.
SLIDE 19
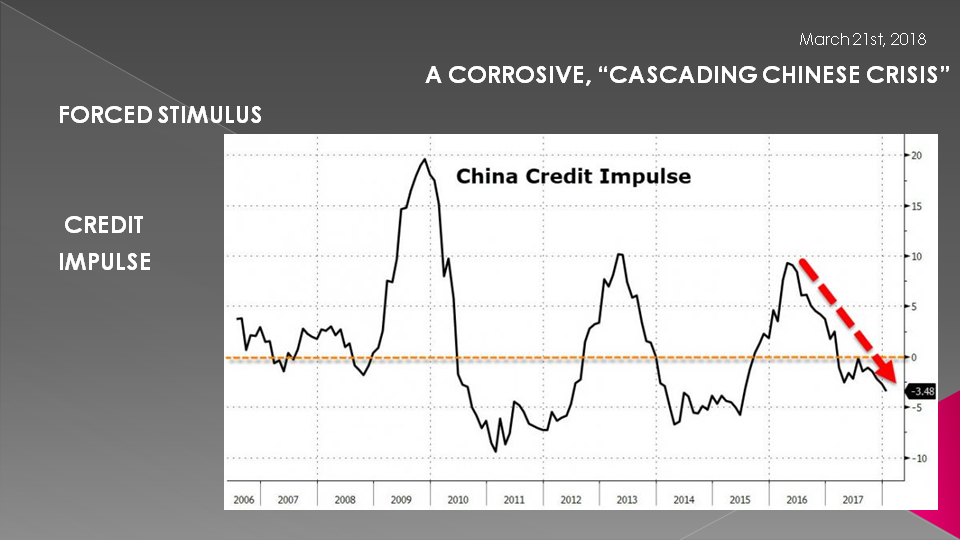
We showed this Credit Impulse slide in our April UnderTheLens video. It was a clear sign of problems ahead and of China's attempts to get its debt growth and leverage under control.
SLIDE 20
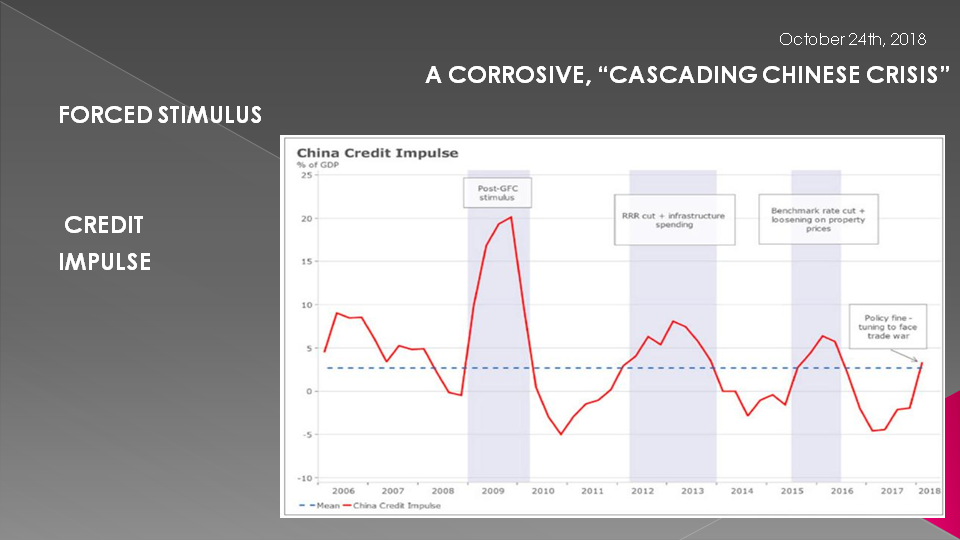
This has not worked out and it has now been forced to resort to stimulus and the rate of growth of Credit to keep the system from more rapidly declining or potentially imploding. Expect this to accelerate much faster and highly likely to new highs.
SLIDE 21
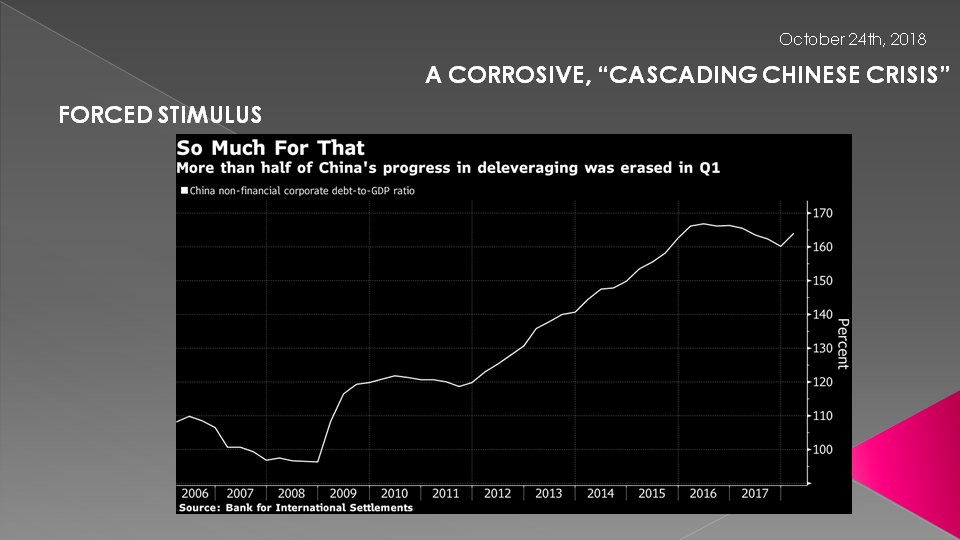
More than half of China's deleveraging was erased in Q1
Chinese non-financial corporate debt is rising again as a percentage of gross domestic product following a year and a half of deleveraging from its mid-2016 record, according to new data from the Bank for International Settlements.
The ratio jumped to 164.1 percent in the first quarter of 2018 from 160.3 percent in the final three months of 2017, erasing more than half of the progress Chinese companies had made in reducing debt loads since the ratio topped out at 166.9 percent in the second quarter of 2016, the BIS data, published September 23, show.
China’s government is looking at ways to counter the effects of an ongoing trade dispute with the U.S., which is set to knock half a percentage point off of Chinese GDP growth, according to Bloomberg Intelligence estimates.
That may mean postponing its deleveraging ambitions, which now appear to have derailed even before the two countries began imposing tariffs on each other’s exports earlier this year.
The re-leveraging of the Chinese economy this year is being driven both by an acceleration in the pace of debt accumulation and a slowdown in economic growth, which will cause the debt ratio to rise.
In 2017, "faster GDP growth allowed the authorities space to operate tight monetary policy. As a result, debt growth slowed".
"That benign backdrop has now dissolved,as a result, the authorities are withdrawing from their tight stance."
A majority of analysts now expect China’s central bank to inject additional liquidity into the financial system in the final months of the year to support the economy as the outlook darkens, according to a Bloomberg survey.
The government is also preparing measures on the fiscal side to boost domestic consumption and investment in the face of rising external risks, including tax cuts and infrastructure spending. Chinese officials told reporters that: "China is fully capable of hedging the impact by expanding domestic demand."
Despite already-high levels of existing corporate debt, the government still has room to expand fiscal stimulus, though it may be accompanied by an increase in defaults -- they claim: "Right now, it will be more about controlling leverage
SLIDE 22
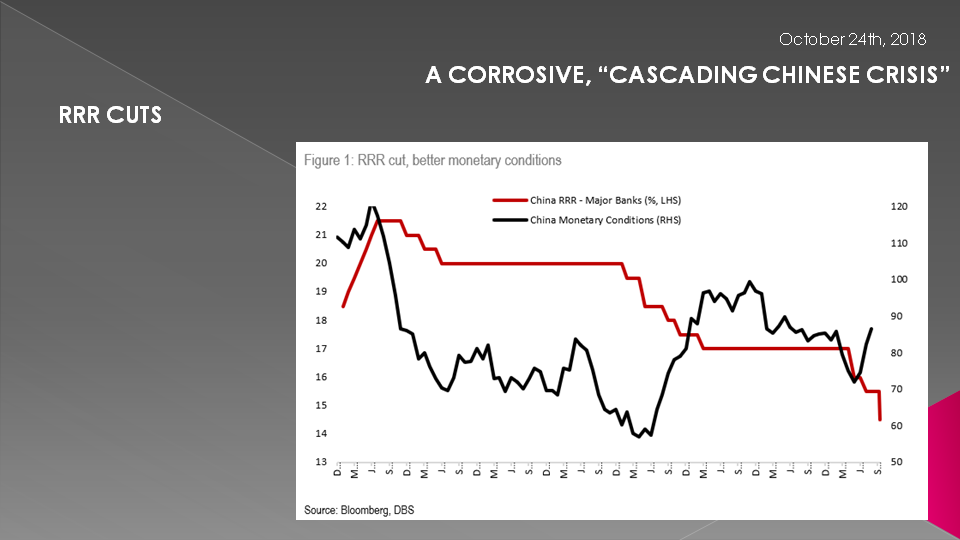
To that end the Required Reserve Ratio has again been cut thereby further loosening Monetary conditions.
SLIDE 23
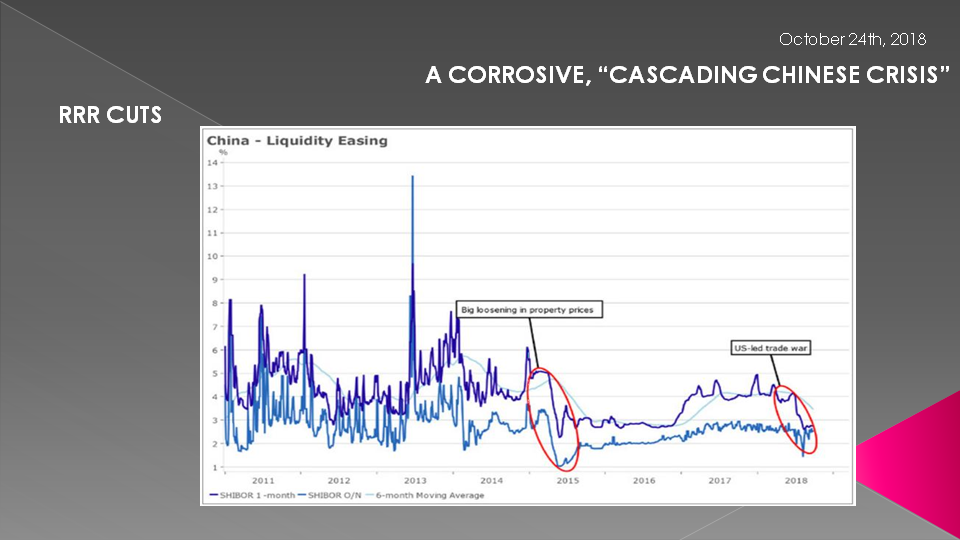
The liquidity easing policies are now becoming clearly evident.
SLIDE 24
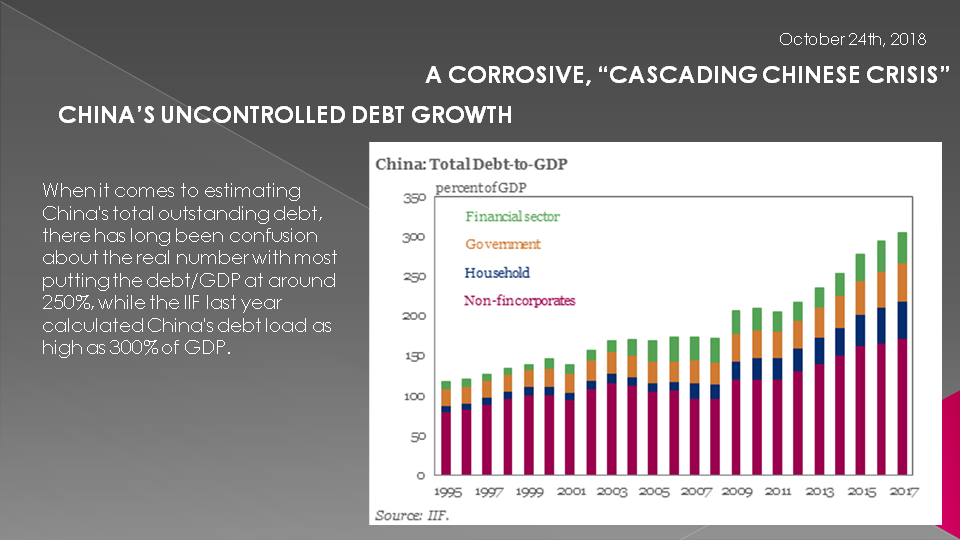
The problem is managing China's super-leveraged debt. A number that I believe is something no one,including China has a handle on. Whether Shadow Banking, Local Government borrowing and lending, Wealth Products, Stock market margin usage, and more - it seems that debt is much, much higher than government statistics.
There are hidden Icebergs everywhere that seem to come to light almost daily. As Warren Buffett is well known to warn: "You don't know who is swimming naked until the tide actually goes out".
SLIDE 25
Just this month the world discovered that we could add another ~40% of debt/GDP to China's total debt because according to S&P, China’s local governments have accumulated $5.8 trillion - or even more - in off-balance sheet debt, suggesting an already record surge in defaults is set to accelerate further.
"The potential amount of debt is an iceberg with titanic credit risks" - S&P credit analysts wrote in their alarming report. Much of the build-up related to local government financing vehicles, which don’t necessarily have the full financial backing of local governments themselves.
LGFV (Local Government Financing Vehicles) debt has emerged as a growing risk for China's economy, because with the national economy slowing, and as a result of a crackdown on shadow lending and a Beijing quota for issuance of local-government bonds there is not enough to fund infrastructure projects to support regional growth. Therefore authorities across the country have resorted to LGFVs to raise financing.
That’s left LGFVs “walking a tightrope” between deleveraging and transforming their businesses into more typical state-owned enterprises.
SLIDE 26
Local governments have rushed to sell bonds but are short of new infrastructure projects. More than 40% of the new debt in fact now doesn’t drive infrastructure growth.
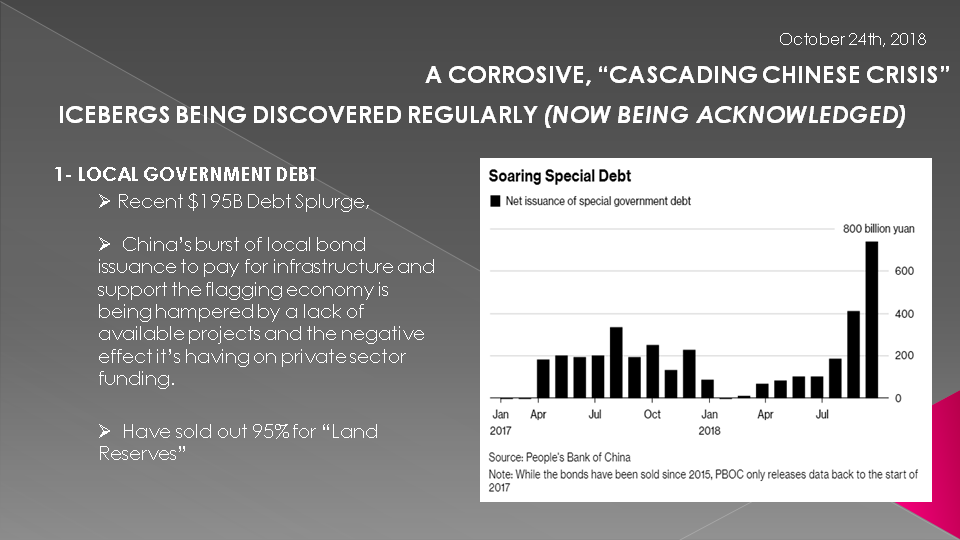
China’s burst of local bond issuance to pay for infrastructure and support the flagging economy is being hampered by a lack of available projects and the negative effect it’s having on private sector funding.
Earlier this year, central government attempted to counter the economic slowdown by ordering the accelerated sale of special infrastructure bonds, and provincial authorities have responded enthusiastically. A flurry of sales in August and September means that 92 percent of the 1.35 trillion yuan ($195 billion) target for the year had been sold by the end of last month.
However, about 42 percent of the total special bonds sold since August are earmarked for “land reserves,” which means compensating farmers for acquisitions or preparing the acreage future development, according to analysis of bond data by Bloomberg News. In short, the economic boost of the debt creation will be less than if it was used to build highways or redevelop sub-standard housing.
"Land reserve bonds are favored because local officials don’t have enough projects in the pipeline when they’re being asked to speed up spending,“
"Land preparation isn’t included in the calculation of fixed-asset investment," meaning the biggest share of government special bonds -- land reserve bonds -- can’t lift the headline investment growth number, analysts wrote in the report.
Policy makers decide an annual quota in March each year. That has swollen over the years as local authorities grapple with worsening financing conditions as well as increasing downward pressure on the economy.
The spending is seen by some as a turbocharger in boosting investment, as it stays outside the official budget deficit, and it can leverage additional bank loans and even private capital in infrastructure projects.
SLIDE 27
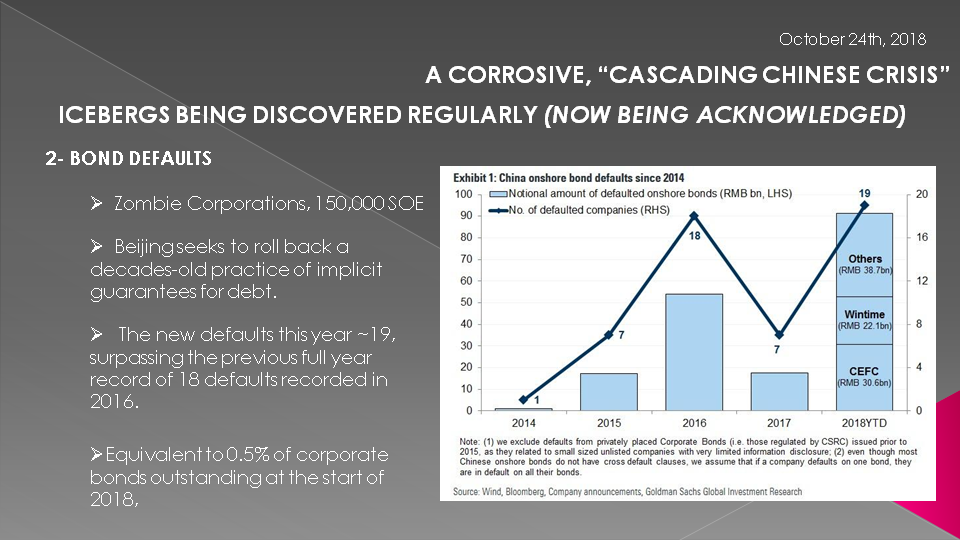
Meanwhile, debt vulnerabilities continue to rise as a result of the previously reported record surge in Chinese corporate defaults this year, as Beijing seeks to roll back a decades-old practice of implicit guarantees for debt.
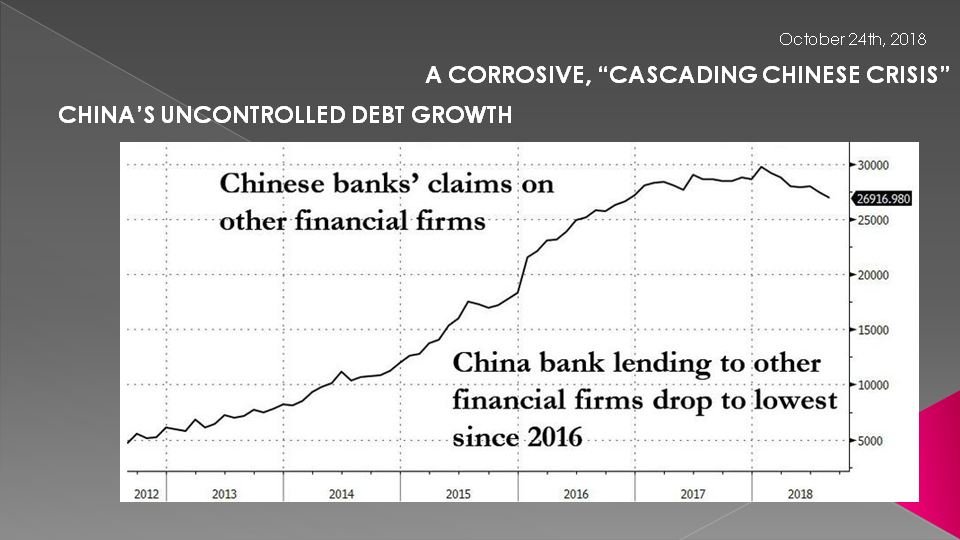
According to research firm Rhodium Group LLC, there have already been least 14 corporate bond defaults in China in 2018, a shockingly high number for a country which until recently had never seen a single corporate bankruptcy and a number which is set to increase as Chinese banks pull back from lending to other firms that use the funds to buy bonds, exacerbating the pressure on the market.
As part of Beijing's crackdown on China's $10 trillion shadow banking sector, strains had spread from high-yield trust products to corporate bonds as the lack of shadow funding has choked off refinancing for weaker borrowers. Separately, Banks’ lending to other financial firms, a common route for funds and securities brokers to add leverage for corporate bond investments, has continued to decline since reaching a peak at the start of 2018 and is now down to the lowest level since late 2016.
The deleveraging campaign is also depressing bond demand “unlike the U.S., where the majority of buyers of bonds are mutual funds, individuals and investment companies, in China, the key holders of bonds are bank on-and off-balance sheet positions,” said UBS analyst Jason Bedford, who noted that Chinese banks are buying far fewer bonds as a result.
There is another reason why the traditional bond buyers have been missing from the market, according to a new report from Goldman, the threats to the Chinese bond market continue to rise with 2018 shaping up as a record year for onshore bond defaults
SLIDE 28
There are additionally very serious concerns about pledged shares, in which major investors put up stock as collateral for personal loans - a disastrous practice when stock prices are dropping. This practice has emerged as a key pressure point for China's market with "rising fears of widespread margin calls recently fueling a 3 percent tumble in the Shanghai Composite Index, which sank to a nearly four-year low as more than 13 stocks fell for each that rose."
“There’s effectively a liquidity crisis in the stock market, and pledged shares are again starting to sound the alarm.” The fear is that if Beijing does nothing, the self-reinforcing liquidation is only set to get worse: with $603 billion of shares pledged as collateral for loans – or 11% of China’s market capitalization, – traders are increasingly concerned that forced sellers will tip the market into a downward spiral.
SLIDE 29
This shows the IMF's prediction of the growing size and expectations of Total Chinese Debt.
I have previously spelled out in UnderTheLens videos how China does not inject Liquidity & Credit in the same manner as the rest of the world.
This is because the PBOC operates and that is because the economy is a mixed economy - that is China is a quasi-capitalism system. This stems from the magnitude of control, central planning and state owned enterprises (SOE) that exist because of its still maintained foundation based on the Chinese Communist Party. The Communist Party has more authority than the Government. In fact it still is the Government!
We may all know this but we tend to forget or assume it is operating like western developed nations. It doesn't!! That is a big deal and needs to be understood when considering global Liquidity-Credit Formation and Financial Flows. We are going to gt into that in this session.

SLIDE 30
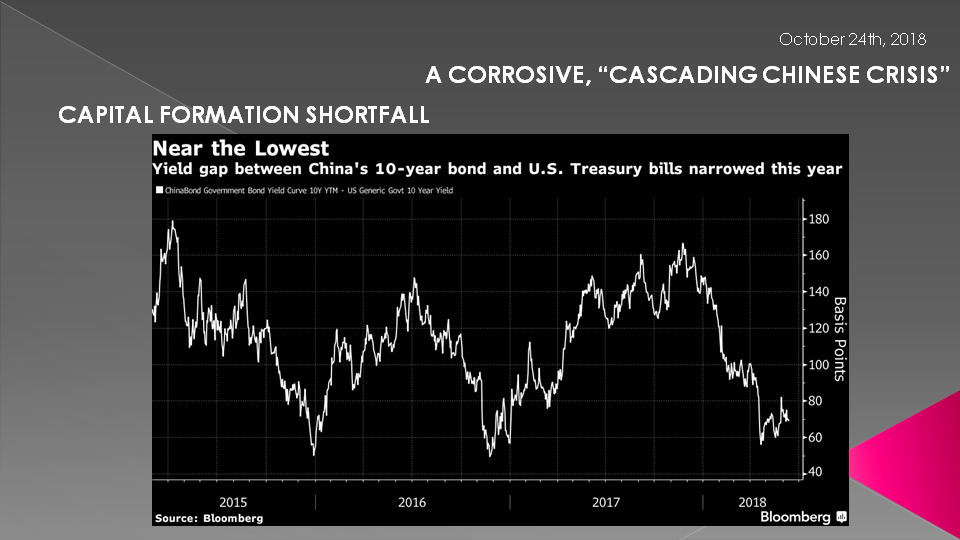
China's bond yields have fallen making it less attractive in attracting capital - a cornerstone of China's economic growth.
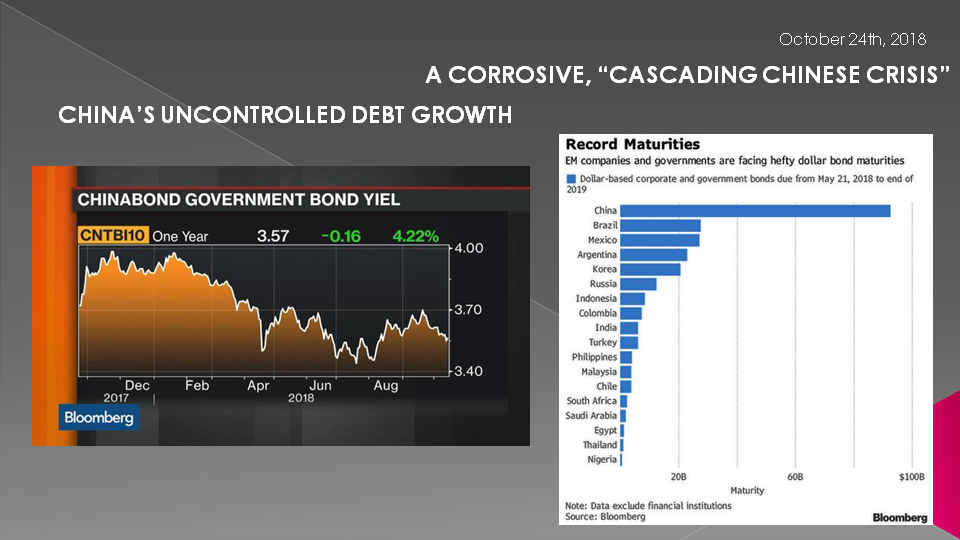
SLIDE 31
China's bank lending to other financial firms has dropped to the lowest since 2016 as the government tries to step into the breach.
SLIDE 32
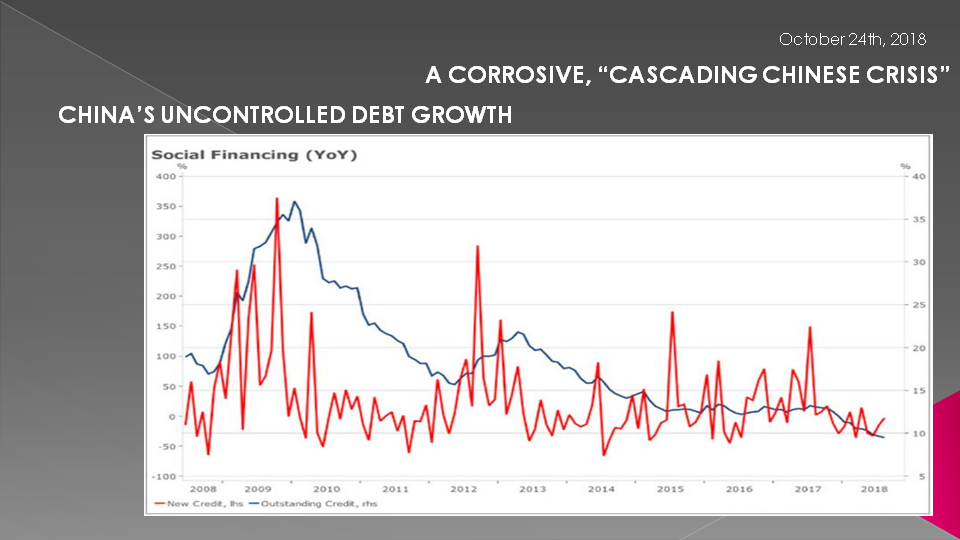
New credit is not flowing fast enough.
SLIDE 33
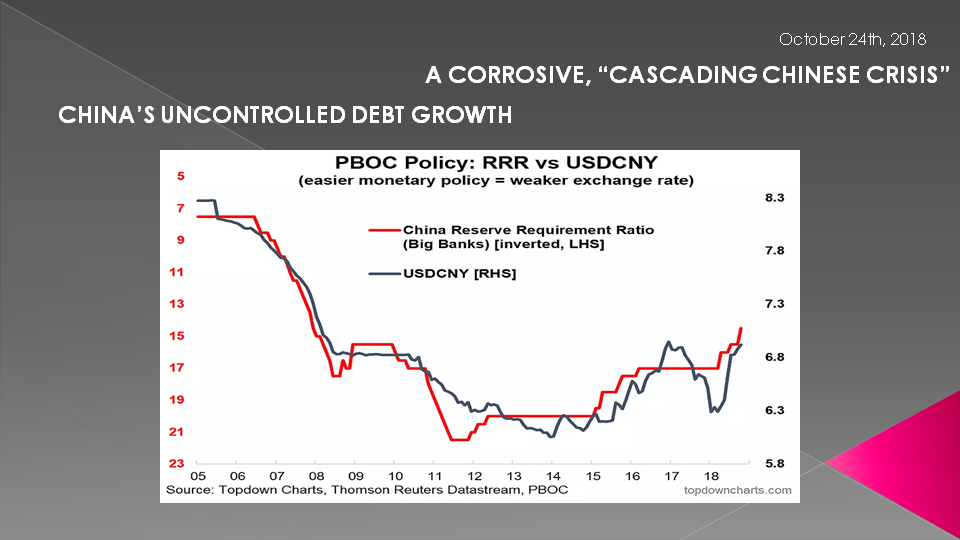
.... and the pace of the governments reductions in the Required Reserve Ratio has been accelerated but it brings the problem of a falling currency.
SLIDE 34
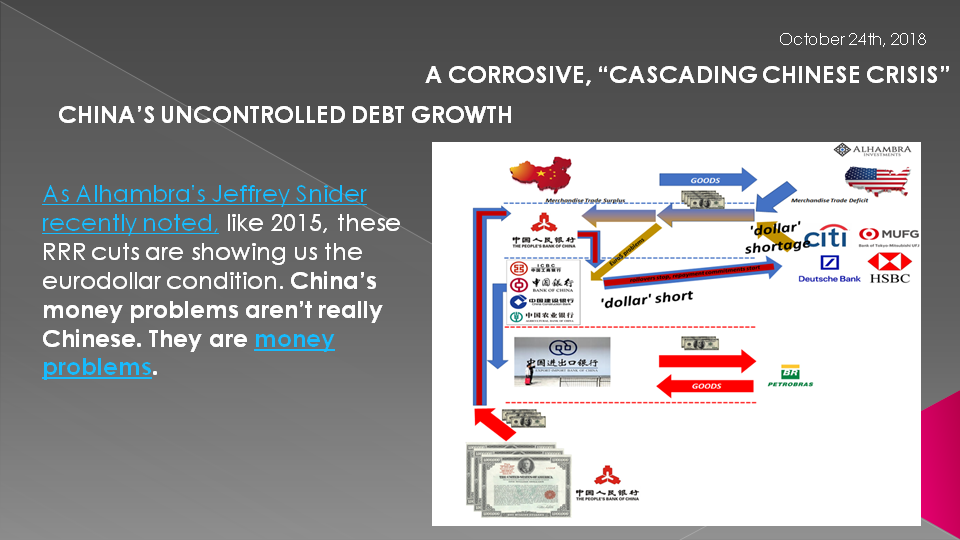
As Alhambra's Jeffrey Snider recently noted, like 2015, these RRR cuts are showing us the Eurodollar condition. China’s money problems aren’t really Chinese. They are global money problems.
I wish I had time to get into this here but don't. I refer you to the great work Jeff is doing on this subject at Alhambra Investments
SLIDE 35
The slide in the Yuan has become a concern for everyone on many fronts.
We talked about this in our July UnderTheLens video "TRADE WARS: Win the Battle, Lose the War!" which can be found in the Macro Analytics YouTube library

SLIDE 36
China is increasingly unable to attract the vast amounts of capital it needs to keep the liquidity flowing. It has been steadily reducing its FX Reserves in the form of selling US Treasuries but this is not at all what it wants to do (at least currently)
SLIDE 37
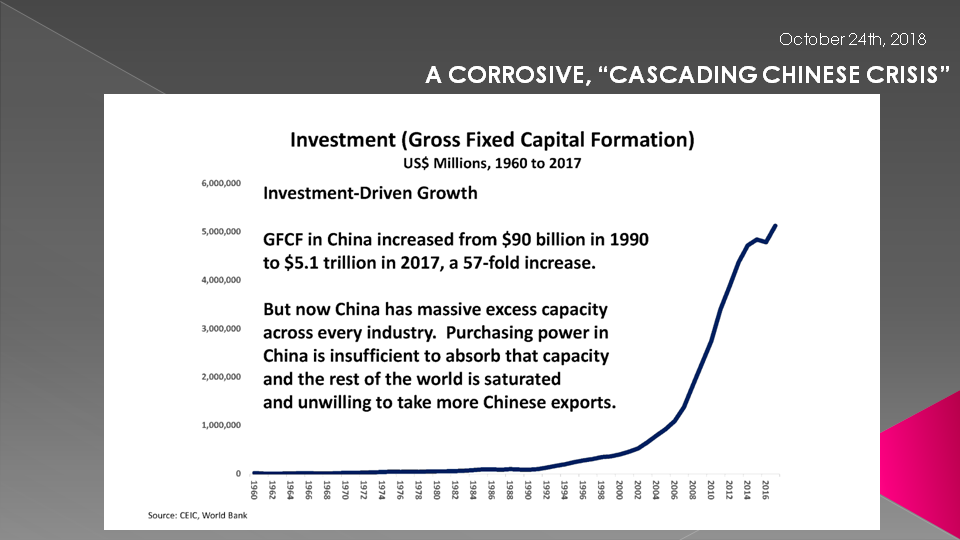
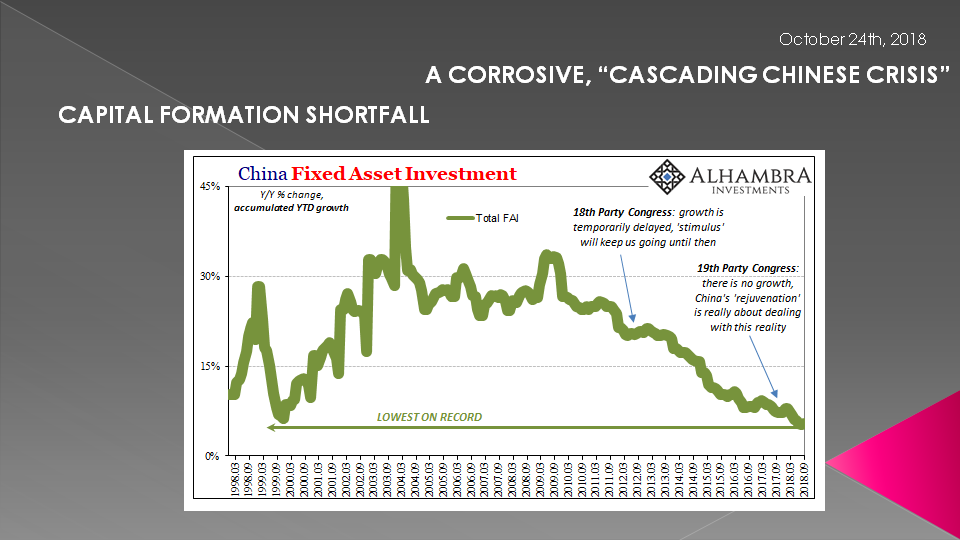
Gross Fixed Capital Formation in China has been massive since it entered the WTO.
SLIDE 38
This is the slide that is critical to appreciate in fully understanding China.
China's GDP is not about consumption as it is in the US. Nor is it about Exports because of the size of its Imports. It simply doesn't add significant value and presently is more or less a pass through operation.
China is about capital formation.
Capital either attracted as investment into China or domestically created.

SLIDE 39
It is failing to do the former in a sufficient fashion and until recently was actually attempting to restrict credit growth.
SLIDE 40
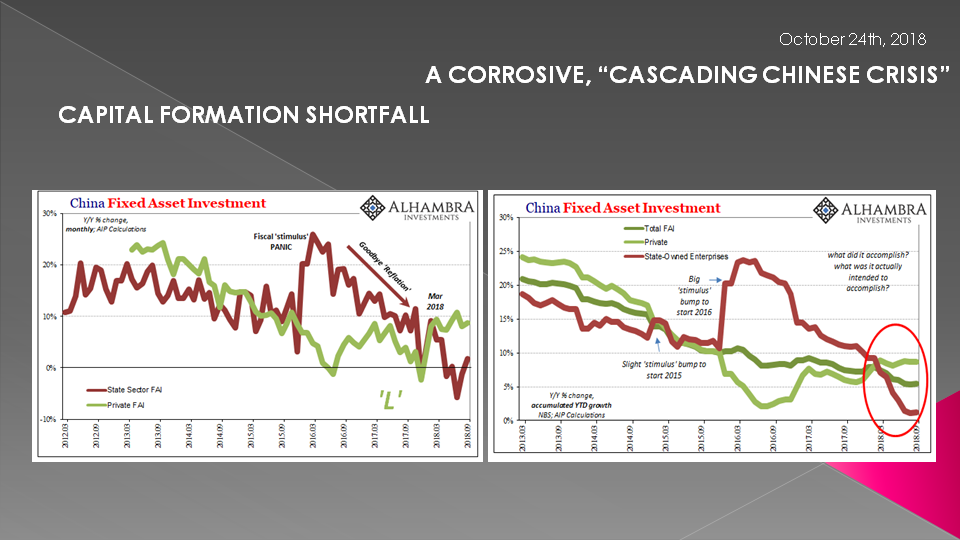
The problem has now become acute.
SLIDE 41
As the comparison here shows Capital Formation tracks the decay in the indicators I showed at the beginning of this session.
SLIDE 42
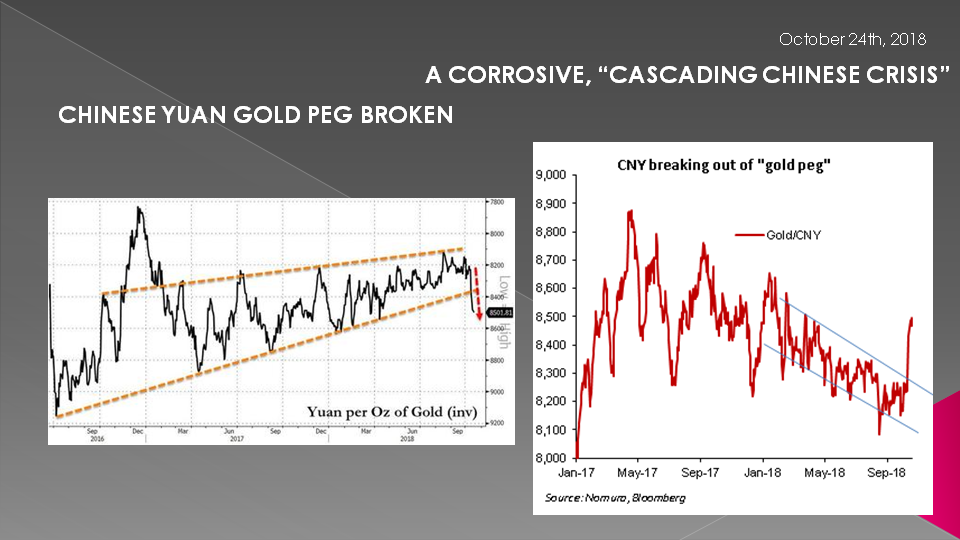
Not to diverge from our theme, but important to note is that the Yuan has actually been closely held to the price of gold (or visa versus) - until recently.

SLIDE 43
That "peg" has been broken which I believe says something about both Chinese problems (as an accumulator of gold) and the potential for gold itself.
SLIDE 44
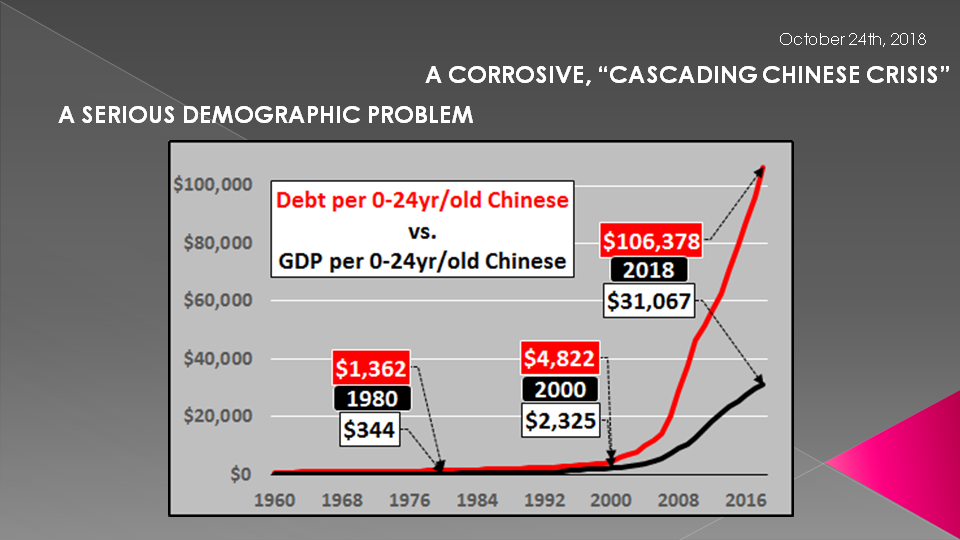
The problems China faces are both cyclical and structural - obviously.
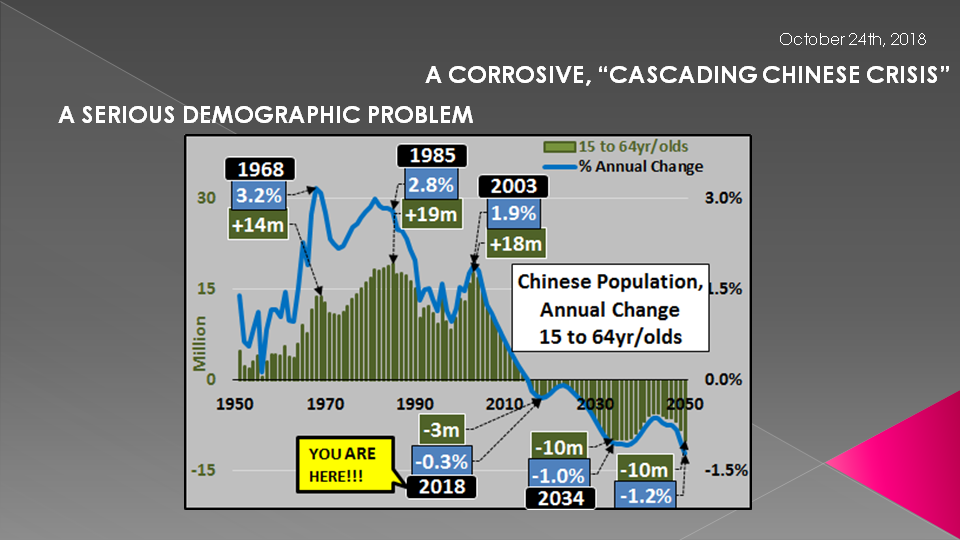
To put Chinese debt into perspective, this chart shows that total debt and annual GDP each divided by the 0 to 24 year old Chinese population. As of 2018, every child and young adult in China under the age of 25 is presently responsible for over $100 thousand dollars in debt while the annual economic activity (GDP) created by all this debt continues to lag ever faster.
And the coming decade only worsens as the young population continues its unabated fall and debt creation (absent concomitant economic growth) continues soaring... building more capacity all for a population that is set to collapse?!?
SLIDE 45
China's predicament and reaction to it are not particularly unique...but given China's size, the ultimate global impact of China's slow motion train wreck will be unprecedented... particularly as their 15 to 64 year old population is now in indefinite decline. The chart shown here shows annual change in Chinese 15 to 64 year old population, in both millions (green columns) and percentage (blue line).
Massive overcapacity (thanks to over a decade of government mandated mal-investment) versus a ever swifter declining base of consumption does not add up to a burgeoning middle class or a happy ending.
SLIDE 46
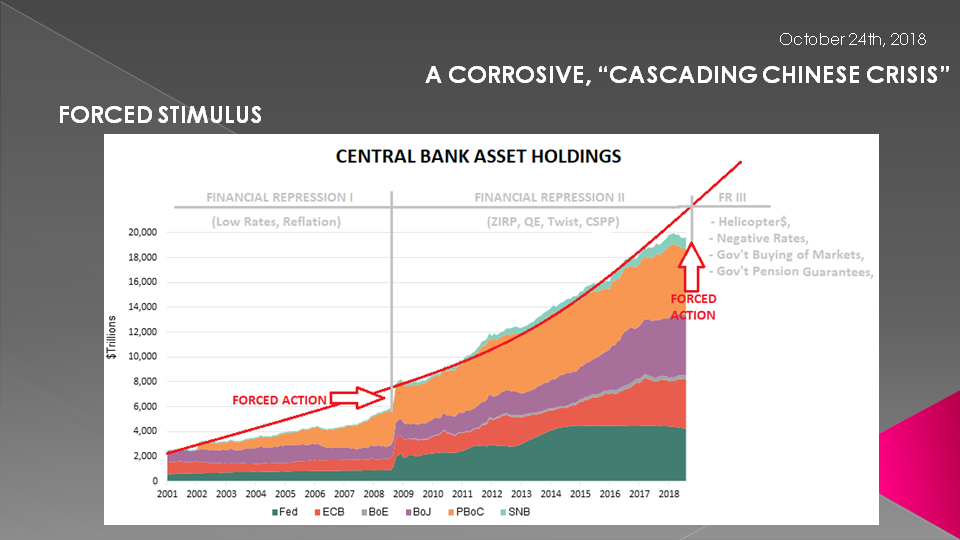
I fully expect China's PBOC to soon begin flooding the world with Yuan. This could potentially trigger a temporary sugar high for world markets and effectively "kick-the-can" of global imbalances further down the road.
I think the other central banks believe this is the only recourse for China's problem and hopefully for their own.
SLIDE 47
The problem as a laid out in our 2014 Thesis is the inevitability of the Globalization Trap (available as a white paper at MATASII).
SLIDE 48
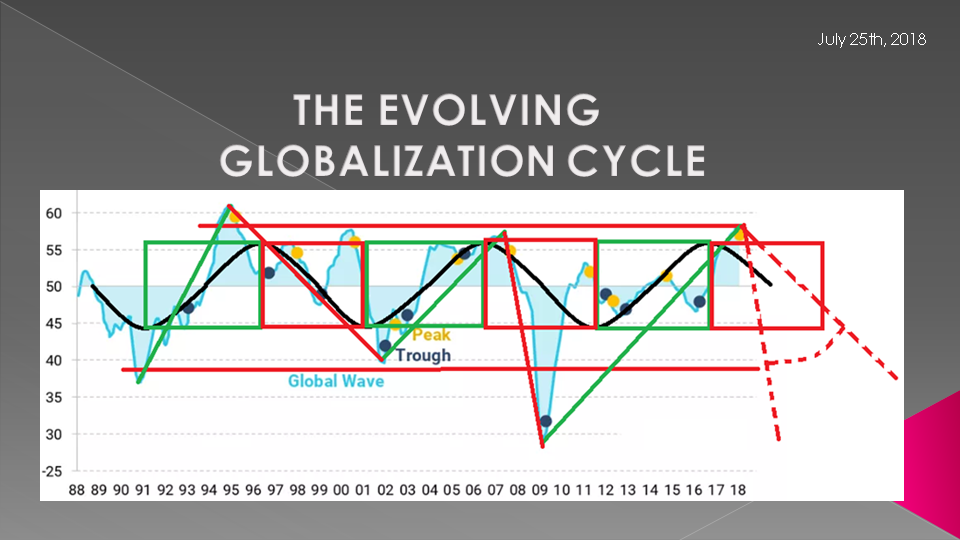
.... and "The Globalization Cycle" which I laid out in our August UnderTheLens video.
SLIDE 49
So, in closing, as I always remind you – remember the answer will be to print more money.
It is the only answer politicians will ever agree on.
Until No one wants it or Trusts It!
Invest accordingly.
