
IN-DEPTH: TRANSCRIPTION - A “SHRINKING POOLS” BULL MARKET?
COVER

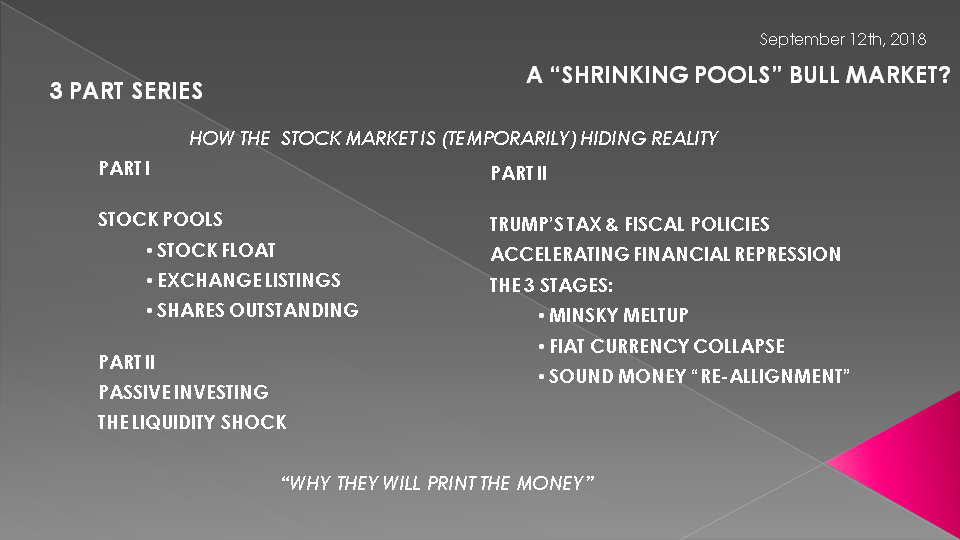
SERIES AGENDA
Today we are going to initiate a three part series on how the stock market is at least temporarily hiding economic reality and why the powers "to be" can be counted on to print the money.
We will expand on some foundation work in Part 1 & 2, which we have discussed to some degree previously, before moving to the three unfolding stages we see ahead over the next few years.
GOAL
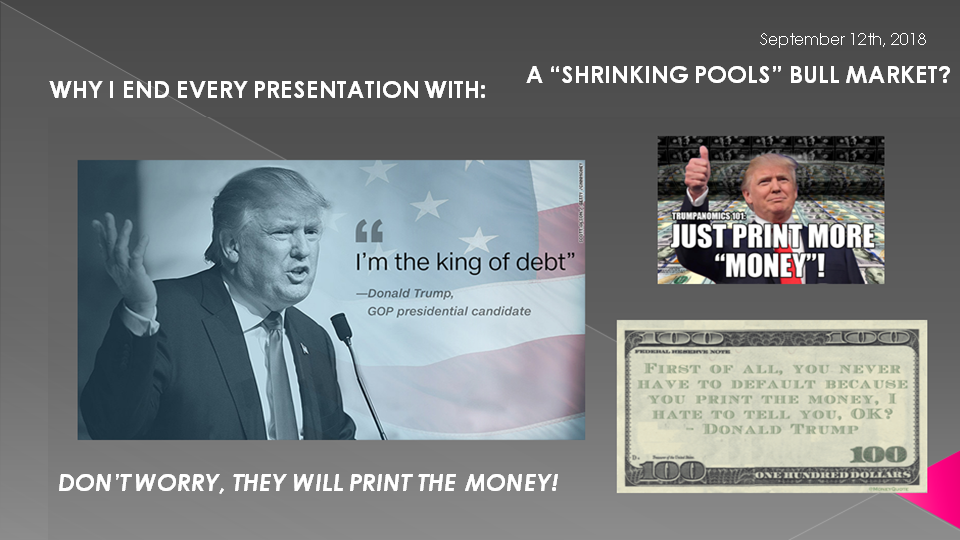
As you are only too well aware I have been ending these monthly video's with this slide for a very long time now. What I hope to achieve in this three part series is answer why this will happen (via the facts) as opposed to simply an educated opinion.
I believe the central bankers of the world are now trapped and will be forced to play out an already scripted series of policy initiatives.
GOAL
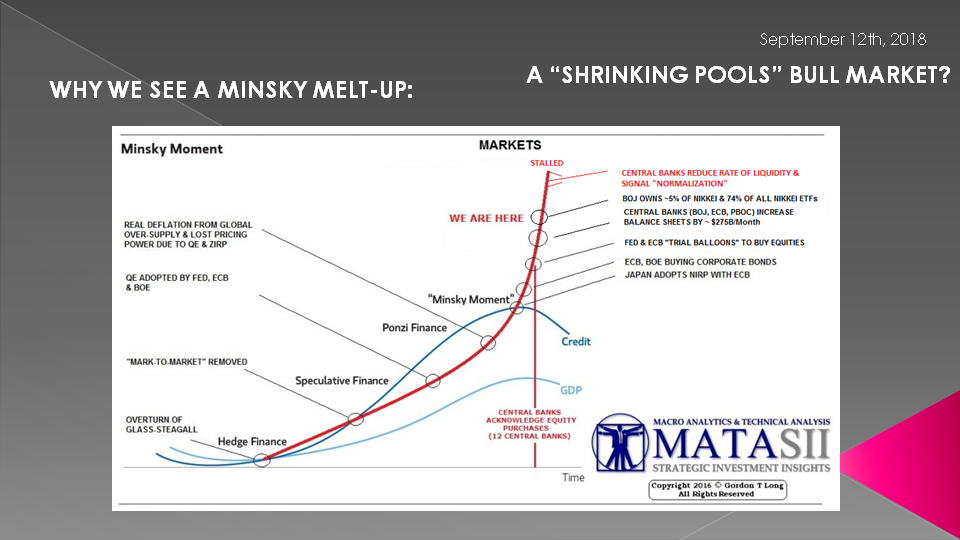
I also hope to show in the concluding Part III why a Minsky Melt-up will occur as part of three unfolding stages. We are already in Stage I as the Minsky Melt-Up is now underway. What I am sure is surprising to many, is it is still in its' early stages.
AGENDA PART I
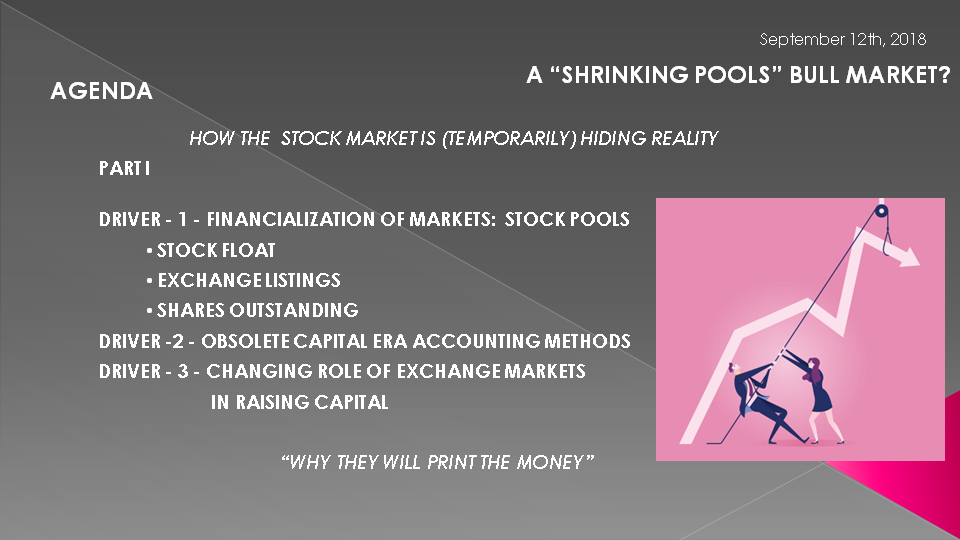
Today I want to cover a key set of drivers that are shrinking the public equity pools in ways that few fully appreciate:
- The Financialization of Markets & the resulting Shrinking of Stock Pools,
- How our "Capital Era" Accounting Methods are obsolete, and
- The Changing Role of Equity Exchange Markets as the traditional way of raising public capital.
All of which are resulting in elevated equity markets.
SLIDE 8
DRIVER - 1 - FINANCIALIZATION OF MARKETS: SHRINKING STOCK POOLS
Let's begin by specifically discussing the three distinct pools which I categorize as:
- The Stock Float Pool,
- The Exchange Listed Share Pool (that is the actual # of listings available to the public) and
- The Actual number of Outstanding Issued shares currently being reduced by the massive Buyback phenomenon.
We discussed the changes in the stock float pool earlier this year in a prior LONGWave video. I encourage you to revisit it in our Macro Analytics library.

SLIDE 9
For those that our new subscribers or missed it I will briefly summarize its key messages.
- The market Float is the number of shares actually available for trading.
- Float is calculated by subtracting the closely held shares -- owned by insiders, employees, the company's Employee Stock Ownership Plan or other major long-term shareholders -- from the total shares outstanding.
- The Float can be difficult to determine and therefore requires and depends on definitions. The public is unaware of how this is determined and generally have to pay service providers for this information.
SLIDE 10
When a firm reduces the number of shares available to trade, then so-called float manipulation can occur.
This is well documented and interestingly one detailed report by the Harvard Business School entitled "“Float Manipulation
& Stock Prices” spelled this out in 2005. We will come back to that 2005 date. They proved with a study of 2000 Japanese firms that the following occurs when the stock float is reduced:
- The price of the stock is often driven up,
- Stock prices are raised significantly when there are differing opinions about the value of shares,
- When risk averse investors have differences of opinion and are short-sale constrained, reductions in the float freeze out pessimistic investors, pushing up prices,
- When the float is released, prices fall.

SLIDE 11
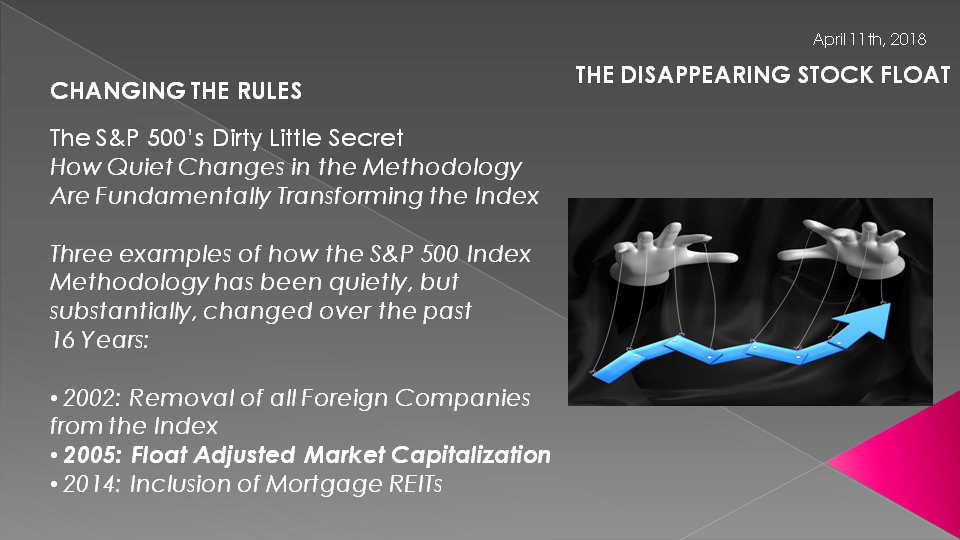
In actual fact this is part of the S&P 500’s 'Dirty Little Secrets" and how quiet changes in the methodology have fundamentally transforming the index.
Three examples of how the S&P 500 Index Methodology has been quietly, but substantially, changed over the past 16 Years:
- 2002: Removal of all Foreign Companies from the Index
- 2005: Float Adjusted Market Capitalization (there is that 2005 date)
- 2014: Inclusion of Mortgage REITs
All are interesting changes but we are only focusing on one today.
SLIDE 12
Since 2005, S&P 500 has been float weighted. That is it is a “Float Adjusted Market Capitalization” Index. What does that mean?
When the individual market cap is calculated for a company part of the index, only the outstanding shares that can be freely traded without any restrictions are taken into account.
As we previously mentioned, not all outstanding shares of a company are available for common investors to trade, for example shares held by individuals with access to insider information are under special regulation (another very interesting adjustment that could change the weighting of a stock for big holders and then be fluidly changed back when that circumstance changed because they asserted they no longer had insider info)
To put all this in perspective, the float adjusted value of S&P 500 index in 2016 was around one trillion dollars smaller than the un-adjusted total capitalization.
SLIDE 13
A research report from Horizon Kinetics (PDF) uses Microsoft as an illustration. Had these rules been in effect during the 1990’s, what would it have done for index fund investors?
- When added to the S&P 500, the share price was about $2.41.
- At January 1999, when the stock was $44.75, insiders still owned 31% of the shares.
- By September 1999, near the peak of the “great technology bubble,” when the shares were $47.50 (and when Microsoft’s weight in the S&P 500 exceeded 4%), inside ownership had been reduced to 26%, and by early September 2000, the very threshold of the collapse of that bubble, when the stock was $35, inside ownership had dropped to 19%.
- 13 years later, the shares were lower than that. Whether by fortune or perception, insiders were dramatically reducing their holdings going into a decade-plus period of decline and stagnation.
- What did outsiders do? Had the float-adjusted index weighting method been in place at the time, as insiders sold, such that the float increased, the Index rules would have increased the Microsoft weighting, and mutual funds and other index investors would have been buying more—more of what the insiders were selling.
SLIDE 14
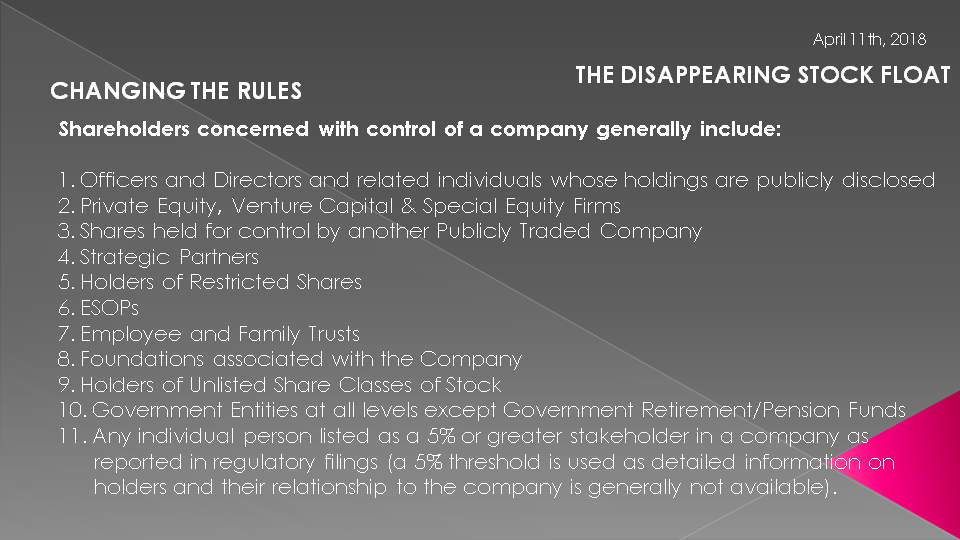
Shareholders concerned with control of a company generally include the folowing:
- Officers and Directors and related individuals whose holdings are publicly disclosed
- Private Equity, Venture Capital & Special Equity Firms
- 3. Shares held for control by another Publicly Traded Company
- 4. Strategic Partners
- 5. Holders of Restricted Shares
- 6. ESOPs
- 7. Employee and Family Trusts
- 8. Foundations associated with the Company
- 9. Holders of Unlisted Share Classes of Stock
- 10. Government Entities at all levels except Government Retirement/Pension Funds
- 11. Any individual person listed as a 5% or greater stakeholder in a company as reported in regulatory filings (a 5% threshold is used as detailed information on holders and their relationship to the company is generally not available).
SLIDE 15
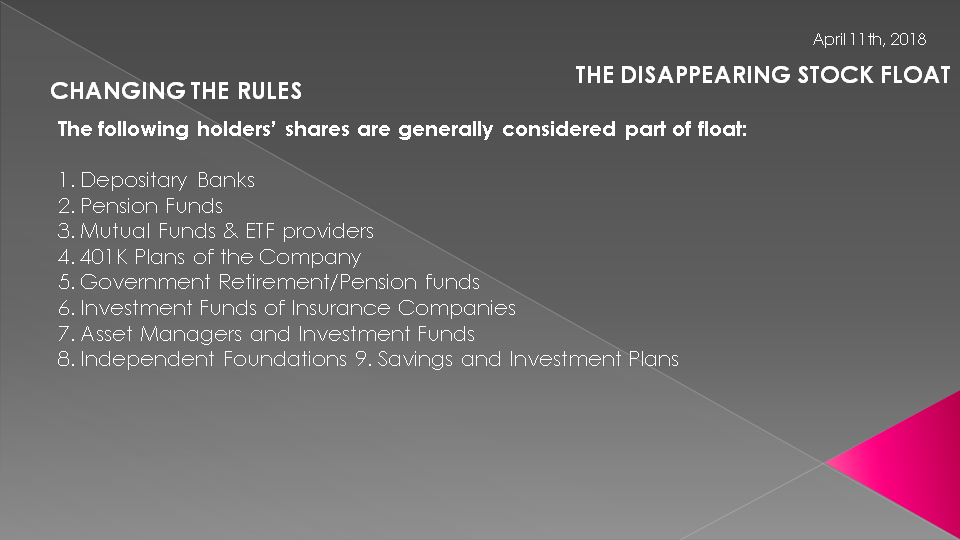
Additionally, the following holders’ shares are generally considered part of the control block:
- Depositary Banks
- Pension Funds
- Mutual Funds & ETF providers
- 401K Plans of the Company
- Government Retirement/Pension funds
- Investment Funds of Insurance Companies
- Asset Managers and Investment Funds
- Independent Foundations
- Savings and Investment Plans
In other words the actual float available to trade is shrinking dramatically.
As we will discuss in a moment Private Equity purchases are having a profound impact on the public available float.
SLIDE 16
But it gets worse - much, much worse!! The shrinking numbers of share listings & the shrinking volumes outstanding stock is ALSO shrinking!!
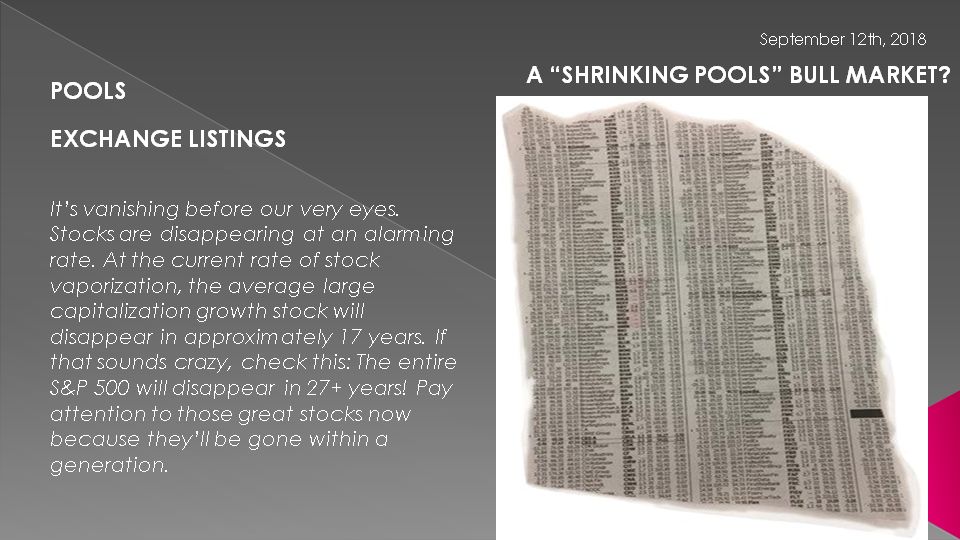
The phenomenon we are witnessing in this regard is both unprecedented and fascinating. Stocks are vanishing before our very eyes. Stocks are disappearing at an alarming rate.
At the current rate of stock vaporization, the average large capitalization growth stocks according to work by Louis Navellier will disappear in approximately 17 years. If that sounds crazy, check this; The entire S&P 500 will disappear in 27+ years! You may want to pay attention to those great stocks now because they’ll be gone within a generation.
SLIDE 17
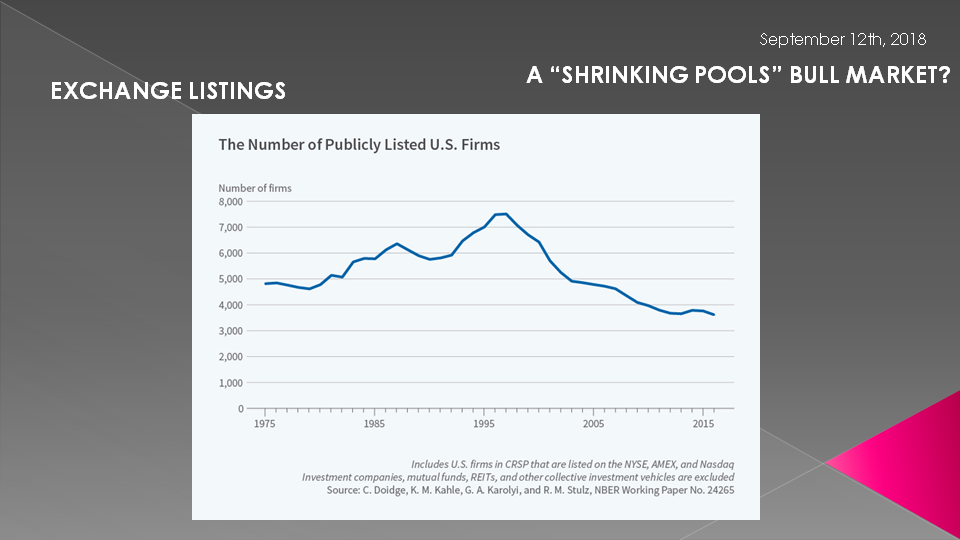
SHRINKING STOCK LISTINGS
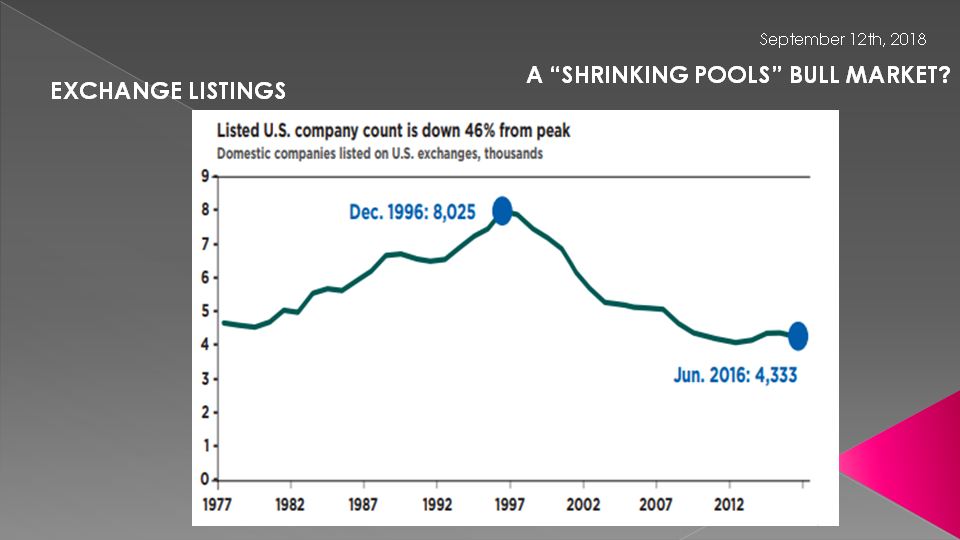
- Stock markets have in recent years been shrinking (by listings but not by market cap).
- There are fewer firms listed on U.S. exchanges than 40 years ago. In 1976, the United States had 4,943 firms listed on exchanges. By 2016, it had only 3,627 firms. From 1976 to 2016 the number of exchange-listed firms has dropped by 27 percent.
- According to data from the Center for Research in Security Prices at the University of Chicago Booth School of Business in the mid-1990s, there were actually more than 8,000 of them being reduced by 2016 to 3,627,
- The population of the United States has grown nearly 50 percent since 1976, the drop is even starker on a per-capita basis: There were 23 publicly listed companies for every million people in 1975, but only 11 in 2016,
- In Germany for example the number of listed firms fell by 41 percent during the past decade alone , to only 450.
- Listings are growing only in China and other parts of Asia which converted to capitalism only recently.
The number of publicly traded companies on the major U.S. stock exchanges has been cut nearly in half between the end of 1996 and 2016.
The reasons include:
- Mergers & Acquisitions,
- Fewer IPOs,
- More buyouts by private equity.
- A few bankruptcies along the way (and more to come when Zombie Corporations are forced to face realities when higher interest rates come home to roost)
SLIDE 18
Also many companies are going “all the way” into oblivion by buying up all of their shares over time, "Going Private" or "Dark".
Many executives become tired of the quarterly “rat race” of reporting numbers which may “beat” or “miss” the expected earnings target by a penny or two and so the stock gets hammered. They don’t want to manage toward quarterly expectations, which they consider to be an unhealthy short-term focus for a company’s long-term health, so they take the company private
SLIDE 19
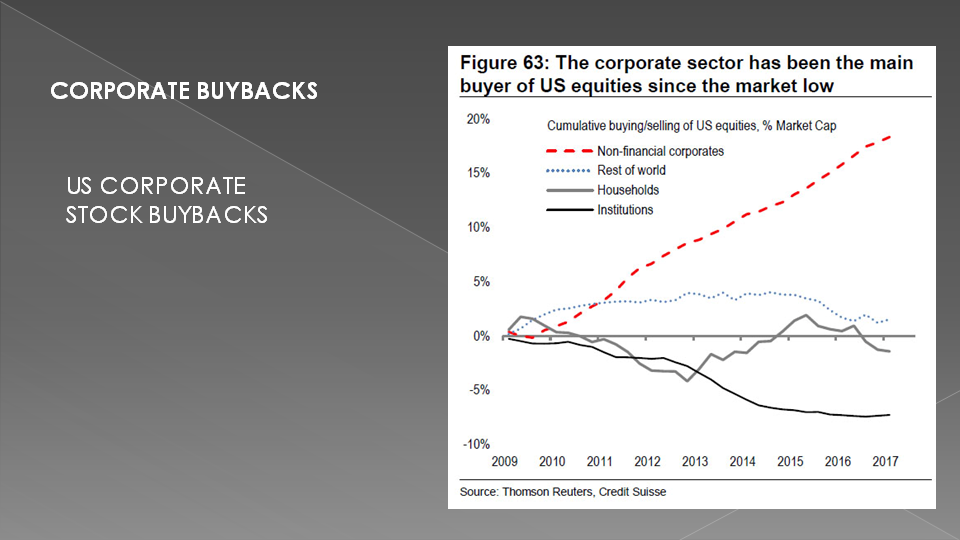
THE BIG KAHUNA
… however the Big Kahuna is Buybacks or the actual reduction of shares outstanding by major public traded entities. As big as $3.5T in buybacks has meant over the last 5 1/2 years, it is only getting larger.
Trump's Tax rate decrease have now meant even high rates of buybacks in 2018. Companies are expected to authorize more than $1 trillion in share buybacks for 2018, according to Goldman Sachs projections.
We have sequence of:
- Overseas money now coming home,
- Companies then buy even more of their own stock,
- Shares outstanding decrease, prices increase,
- While rates remain low, forecasted p/e multiples remain low
- Companies continue to buy back shares
- ….repeat cycle
Low interest rates spur corporate borrowing through debt issuance. They take the money and buyback shares. Tax reform is allowing a massive repatriation of foreign money to come back home. Corporations are taking the money and buying back shares. As the outstanding float goes down, share prices go up.
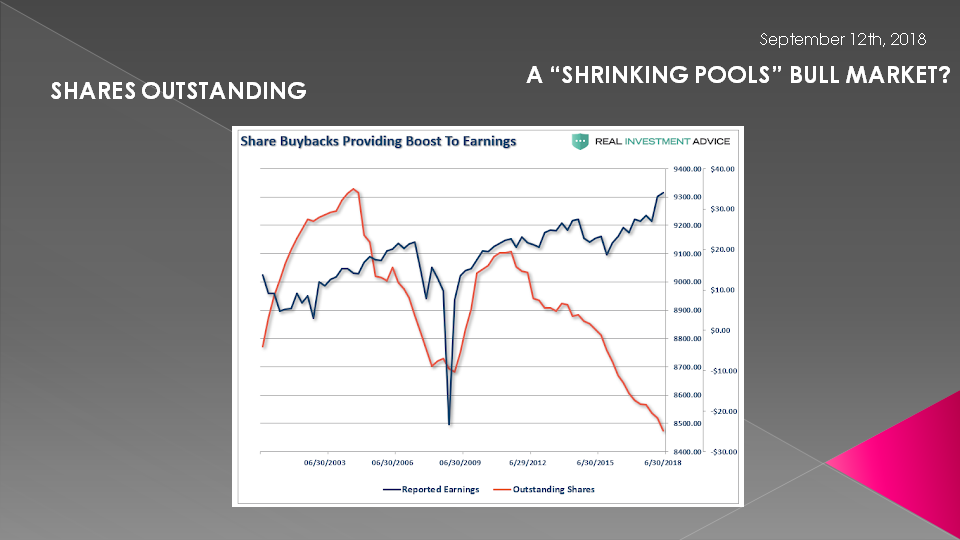
SLIDE 20
This chart shows the incredible shrinking stock market best of all.

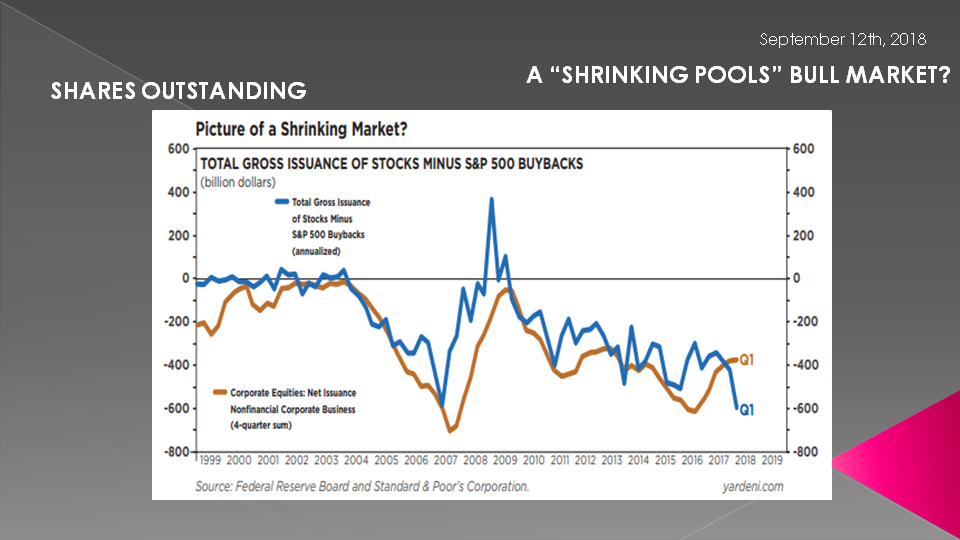
SLIDE 21
We can see that the gross issuance of new stock is rapidly decreasing. The number of outstanding shares is dwindling. The stock market is slowly vanishing. It’s dying in front of our very eyes.
SLIDE 22
“The bottom line is as long as bond yields and forcasted P/E ratios remain low, stock buy-backs will persist, especially while ROE remains high and cash flow remains strong. The average large capitalization growth will disappear in approximately 17 years at the current stock buy-back pace, while the S&P 500 will disappear in 27+ years. Naturally, as stock prices resume rising, it will raise forecasted P/E ratios and potentially postpone stock buy-back activity. However, right now Corporate America is buying back its outstanding
SLIDE 23
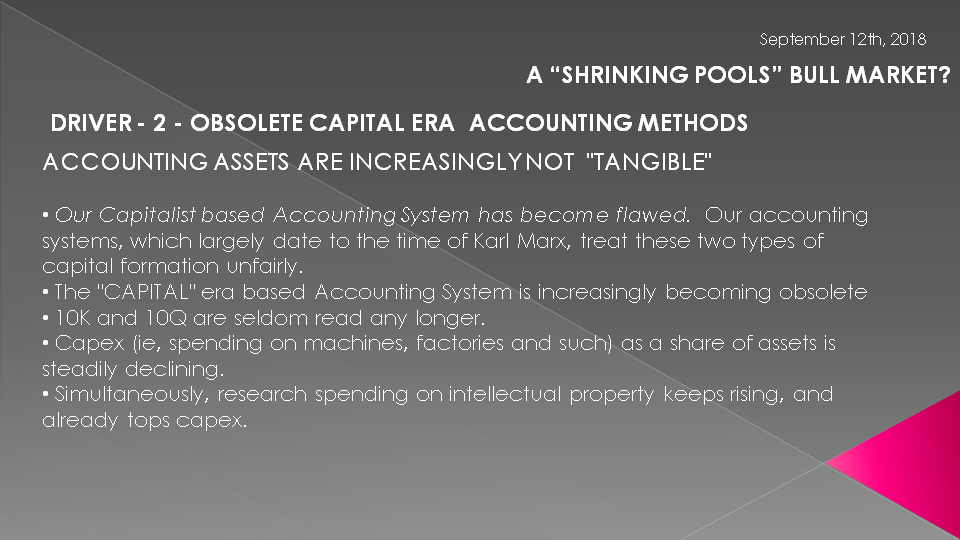
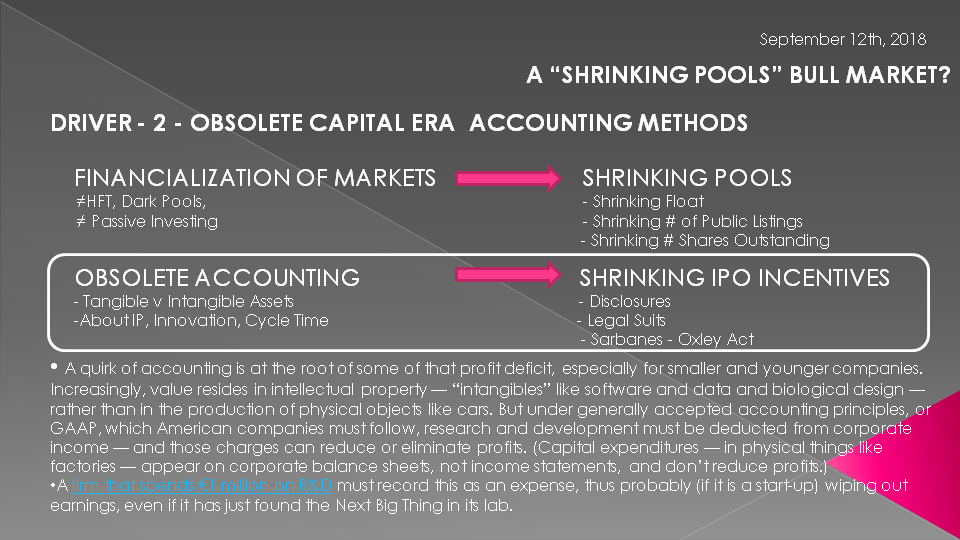
DRIVER - 2 - OBSOLETE CAPITAL ERA ACCOUNTING METHODS
ACCOUNTING ASSETS ARE INCREASINGLY NOT "TANGIBLE"
- Our Capitalist based Accounting System has become flawed. Our accounting systems, which largely date to the time of Karl Marx, treat these two types of capital formation unfairly.
- The "CAPITAL" era based Accounting System is increasingly becoming obsolete
- 10K and 10Q are seldom read any longer.
- Capex (ie, spending on machines, factories and such) as a share of assets is steadily declining.
- Simultaneously, research spending on intellectual property keeps rising, and already tops capex.
SLIDE 24
- A quirk of accounting is at the root of some of that profit deficit, especially for smaller and younger companies. Increasingly, value resides in intellectual property — “intangibles” like software and data and biological design — rather than in the production of physical objects like cars. But under generally accepted accounting principles, or GAAP, which American companies must follow, research and development must be deducted from corporate income — and those charges can reduce or eliminate profits. (Capital expenditures — in physical things like factories — appear on corporate balance sheets, not income statements, and don’t reduce profits.)
- A firm that spends €1 million on R&D must record this as an expense, thus probably (if it is a start-up) wiping out earnings, even if it has just found the Next Big Thing in its lab.
- Official profits are thus becoming almost irrelevant, while for company founders, they seem increasingly misleading. If managers tell the markets too little about their patents, their firms will be undervalued; if they tell too much, rivals will know their secrets. Better to just find private equity and be done with it.
Our visibility into the inner workings of public companies isn’t great, but we know far more about them than we do private companies, which aren’t required to disclose nearly as much information.
And these changing dynamics mean we know far less about many of the creators of American profits and jobs than would otherwise be the case.
SLIDE 25
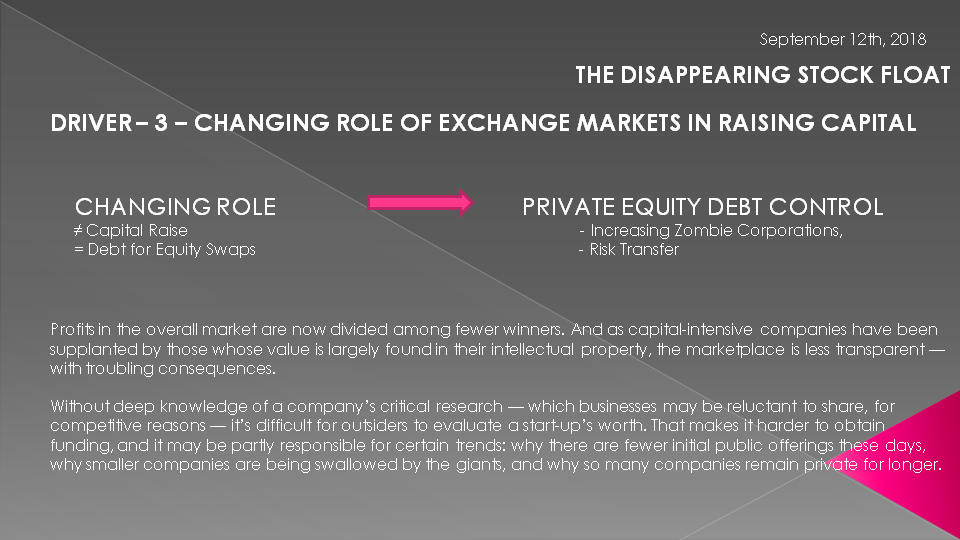
DRIVER – 3 – CHANGING ROLE OF EXCHANGE MARKETS IN RAISING CAPITAL
What we also need to appreciate is that the role of exchange traded markets is changing from primarily being about raising capital to being a payout machine to investors in the form of buybacks and dividends. Capital being raised differently, it is being raised through debt and by different players.
The reason is that:
STAGE 1 - Pre IPO Enterprises are about: INNOVATION & "CYCLE TIME" WHERE THE VALUE PROPOSITION (INVESTING IN VALUE) IS CRITICAL = INCREASINGLY PRIVATE EQUITY PLAYS HERE
STAGE 2 - Developed & Mature Enterprises are about: PROFIT GROWTH, DIVIDENDS AND STOCK APPRECIATION (THE OF RETURNING CAPITAL) = PUBLIC EXCHANGES & STOCK APPRECIATION

SLIDE 26
Without deep knowledge of a company’s critical research — which businesses may be reluctant to share, for competitive reasons — it’s difficult for outsiders to evaluate a start-up’s worth. That makes it harder to obtain funding, and it may be partly responsible for certain trends: why there are fewer initial public offerings these days, why smaller companies are being swallowed by the giants, and why so many companies remain private for longer.
Profits in the overall market are now divided among fewer winners. And as capital-intensive companies have been supplanted by those whose value is largely found in their intellectual property, the marketplace is less transparent — with troubling consequences.
SLIDE 27
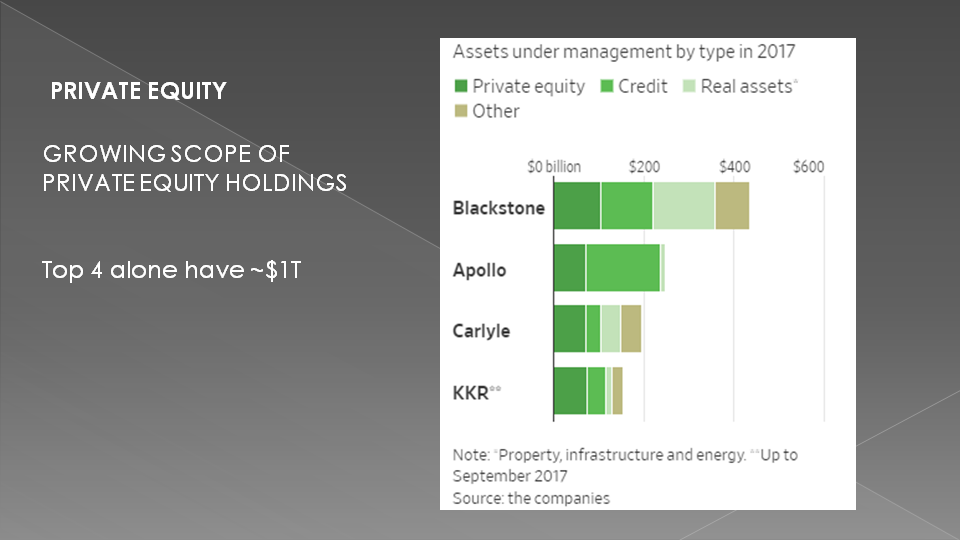
That creates opportunities for private equity firms, which have insider access to innovative start-ups that may never go directly to the public markets. Meanwhile, Main Street investors are consigned to a less diverse universe than they may realize.
The top four US PE firms had over $1T in assets alone. This is up dramatically in the last 10 years.
SLIDE 28
Shown here in tan you can see that the growth is going exponentially! Investors are clamoring to get in!
What is their strategy? One thing we do know is they TRADITIONALLY don't start new companies but rather buy existing public companies, leverage them up with debt, merger them or other strategies that are stock price oriented. Recall, that their shares are those removed from the float - of course until they are sold. Meanwhile as they hold them and their stock goes up they have more collateral with which to increase total buying leverage.
It must be a wonderful ride for them!!

SLIDE 29
Private Equity is notorious with loading up debt on takeovers. Things have progressed further in my view.
Today they don't need to have total equity control but rather just board room control. Board positions can come from being major debt holders or arrangers of debt versus simply their equity position holdings.
I have been told by reliable sources that Private Equity firms now have control of over 60% of the S&P 500
SLIDE 30
As we have discussed in our recent Zombie Corporation videos, the problem of debt payment levels versus cash flow and profits is becoming a global issue. Fed appreciate the role PE is playing in this shift.
Whether Zombie corporations or "Challenged" firms the number are once again worrying!

SLIDE 31
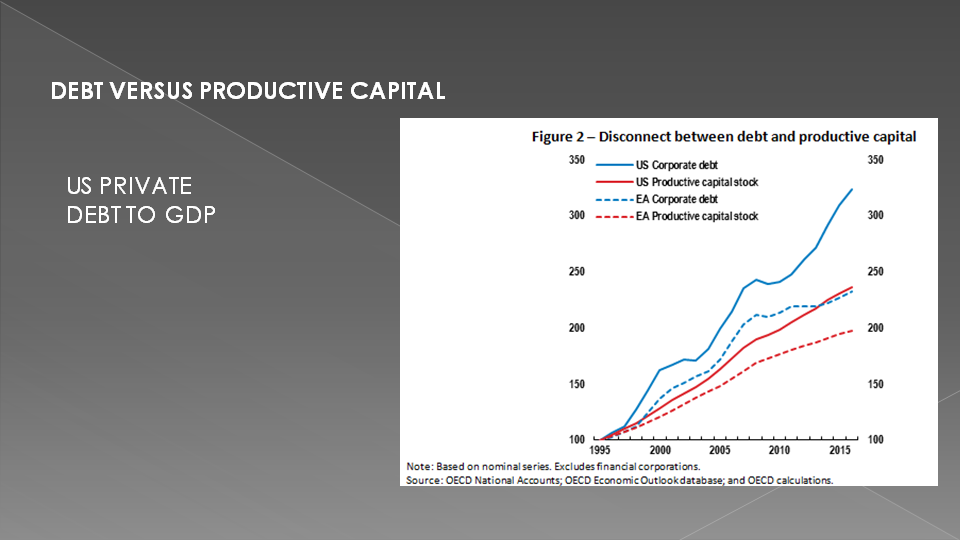
Clearly the disconnect between their debt and productive capital stock doesn't bode well for the future.
SLIDE 32
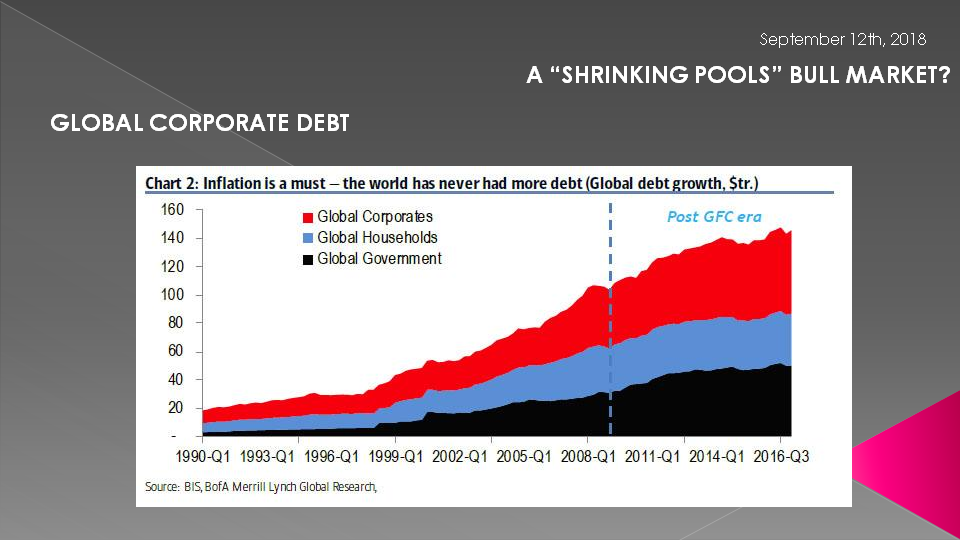
Debt issuance has actually been growing. Companies are issuing debt to help facilitate buying back more stock. This would mean outstanding stock is shrinking. That’s precisely what this chart shows.
Net new stock issues in non-financial corporations is -$391.3 billion at last count
What is going on is something we projected many years. A massive Debt for Equity swap. Corporations are swapping debt for their equity. The debt holders are becoming controllers of companies.
If and when stocks fall, equity holders may get wiped out but debt holders will be paid -unless the company goes bankrupt. Then the debt holders only squabble over the asset divison.

SLIDE 33
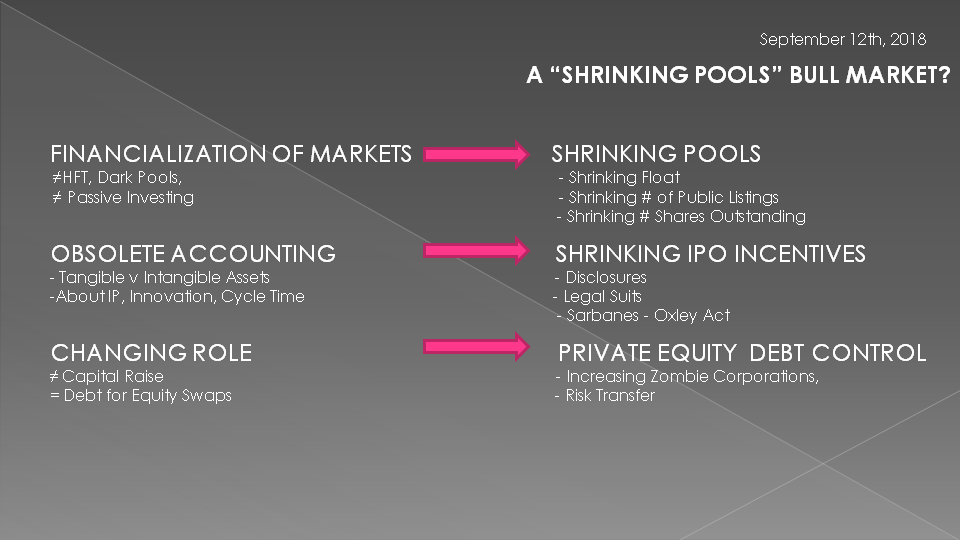
To summarize, we have shown the following:
FINANCIAL OF MARKETS SHRINKING POOLS
≠HFT, Dark Pools, - Shrinking Float
≠ Passive Investing - Shrinking # of Public Listings
- Shrinking # Shares Outstanding
OBSOLETE ACCOUNTING SHRINKING IPO INCENTIVES
- Tangible v Intangible Assets - Disclosures
-About IP, Innovation, Cycle Time - Legal Suits
- Sarbanes - Oxley
CHANGING ROLE PE DEBT CONTROL
≠ Capital Raise - Increasing Zombie Corporations,
= Debt for Equity Swaps - Risk Transfer
SLIDE 34 - PART II
In part 2 we will discuss the distortions and problems associated with Passive Investing.

SLIDE 35
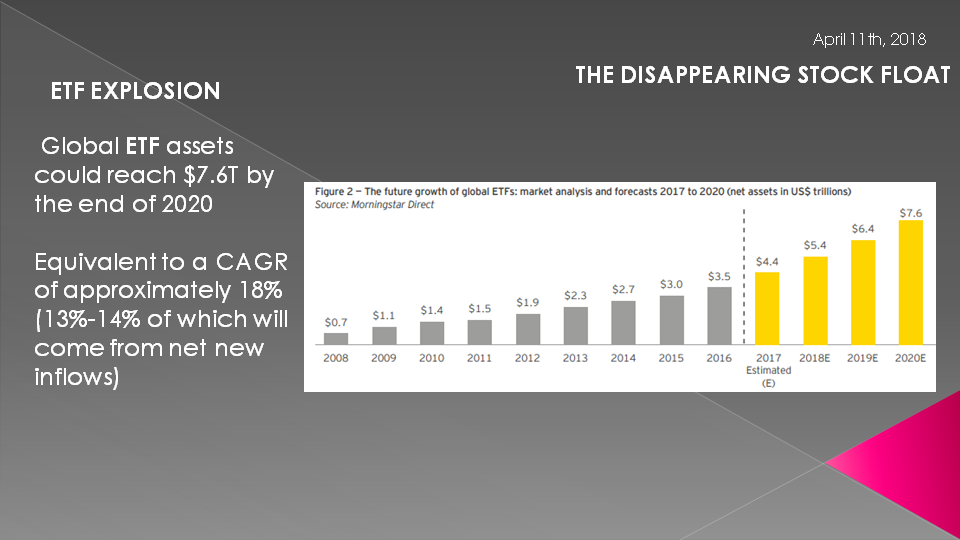
The growth of ETF Index trading has grown dramatically as have the issues associated with it.
SLIDE 36
I have mentioned numerous time my concerns with the ETF Dynamo. We will discuss it further in the context of what we have just discussed.

SLIDE 37 - WE WILL SPEND THE MONEY
As I often remind our listeners, remember they will print the money to solve any and all problems until such time as no one will take the money or it is of no value.
That day is still in the future so take advantage of the opportunities as they currently exist. Investing is always easier when you know with relative certainty how the powers to be will react. Your chances of success go up dramatically. The powers to be are effectively now trapped by policies of unsound money and fiat currencies.
SLIDE 38
I would like take a moment as a reminder:
DO NO NOT TRADE FROM ANY OF THESE SLIDES - they are for educational and discussions purposes ONLY.
Thank you for listening and until next month may 2018 be an outstanding investment year for you and your family.
Thank you for listening!