VIDEO TRANSCRIPTION: IN-DEPTH - IS CENTRAL BANK TIGHTENING REALISTIC?
THE GREAT CONUNDRUM
WHAT IS THE CONUNDRUM?
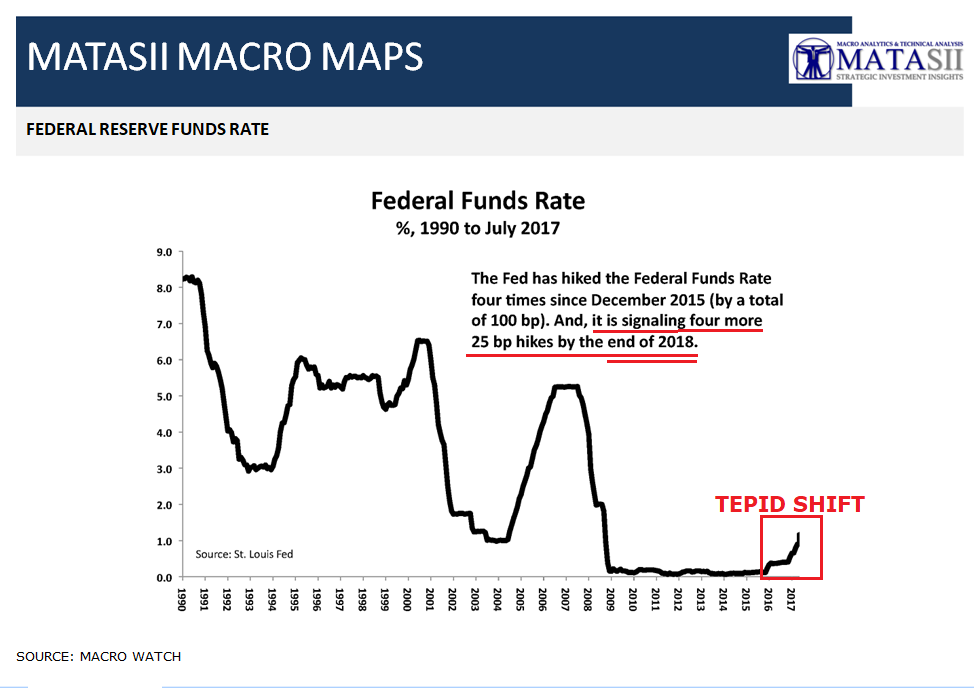
The Federal Reserve has been very clear through its' forward policy guidance that it will slowly increase the Fed Funds Rate. "Slow" however should more appropriately described here as at a "Glacial Pace"!
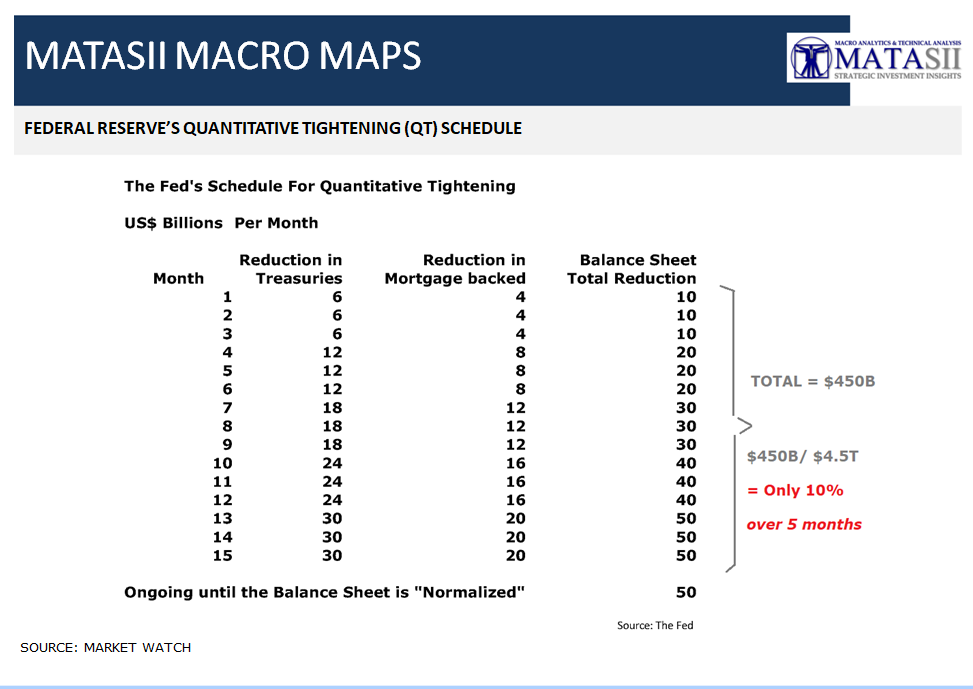
Additionally the Fed plans to gradually reduce the central banks balance sheet at a slowly increasing rate. A rate that over 15 months totals only 10% of the $4.5T growth in the Fed's Balance Sheet since the beginning of the Fed's Quantitative Easing (QE) and ZIRP.
The general perception is that going forward the Fed will either:
- Raise Rates & Reduce Balance Sheet as is being presently signaled,
- Do Little (in reality what they are actually doing) or Marginally Do Nothing Further, or
- Resume another version of QE ∞, plus Negative Interest Rate Policy (NIRP) and possibly Helicopter Money.
WHY QUANTITATIVE TIGHTENING?
The expressed reasons for the requirement for "Normalization" of US Monetary Policy is that the US Economy is now over 8 years into the recovery with low unemployment rates and signs of a broad based (though weak) recovery. It is my opinion both of these conditions are not valid, however I will leave that for another day.
Instead I would like to suggest what may be a few publicly undisclosed considerations on the table in the closed door discussions or at sides bar.

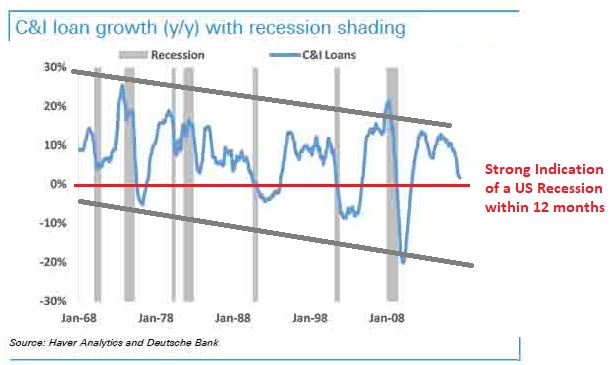
The above Fed Chart has been Extremely Accurate In Warning the Fed of Recessions (shown in grey)
WHAT THE FED SEES
Having lived through and as an investor participated in 1987, 2000 and 2007 I learned a number of lessons. One is the importance of advanced shifts in the Currency, Credit and Yield markets prior to major reversals in the equity markets.
The yield curve is of particular note since it is presently almost completely ignoring the Fed and has been steadily flattening. This is problematic, especially for the Fed!
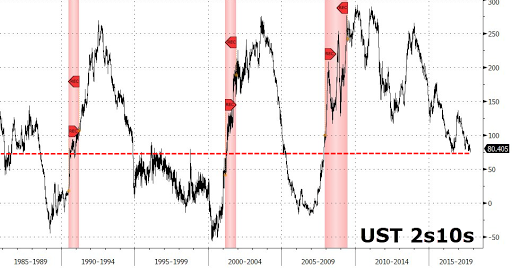
We an see that the 2-10 US Treasury spread is below the dotted red line which has always preceded a major market correction, as well as a US Recession.
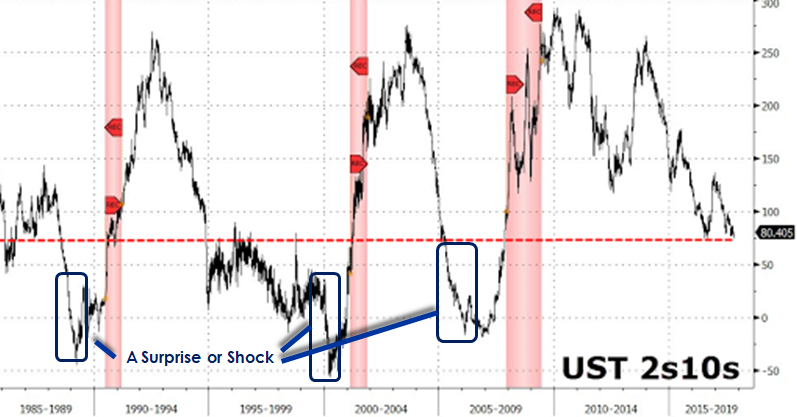
What I learned was that there is always a shock or surprise (shown in Blue) which comes out of "nowhere".
What that surprise is doesn't really matter except it occurs because of hidden underlying market dislocations. Extreme valuations, low volatility, market speculation, excess leverage etc. etc. all contribute, but are not in themselves the direct cause. Together they all contribute.
The only thing you can be certain of is that market fragility will abruptly fracture. The Fed is acutely aware of this and knows it must be fully prepared!
The irony is that QT will likely contribute to this fragility and shock. There in lies the FOMC's Conundrum!
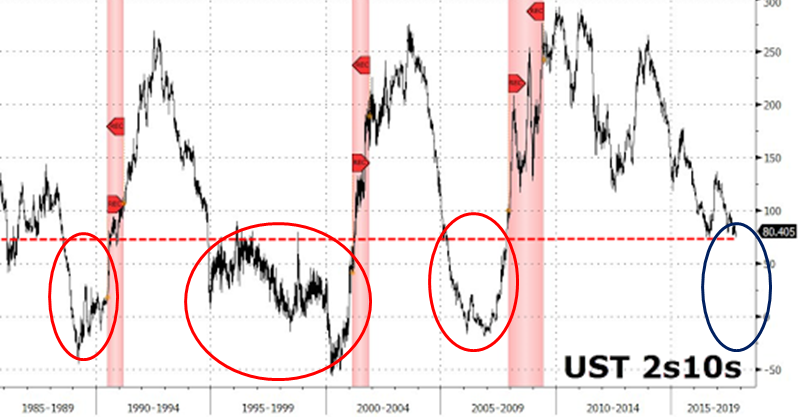
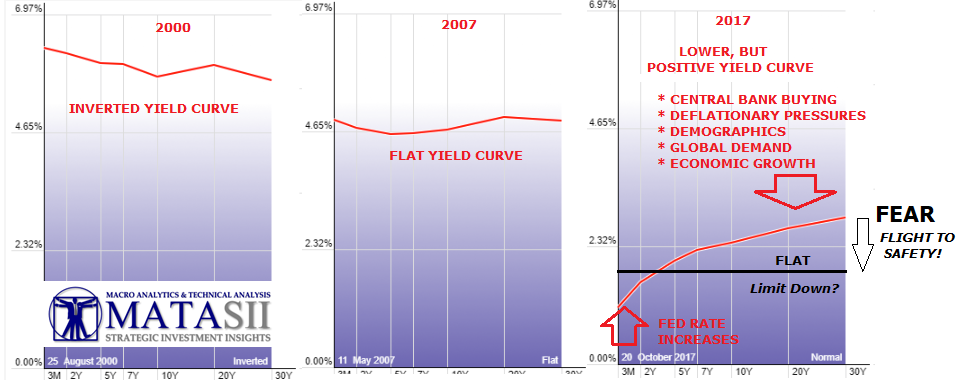
We can see the yield curve comparison prior to the 2000, 2007 tops along with today's level. Though the yield curve is not flat or inverted (yet) it is setup for exactly that to occur.

The black line shows that a couple of minor Fed rate hikes on the short end, and a shock which precipitates the normal "Flight to Safety" into the security of longer dated US Treasuries and the yield curve would be flat-to-inverted in a "New York Minute"!
In a recent Seeking Alpha article "Euphoria And Greed: The Final 5% Is Always The Most Expensive" I pointed out how the Consumer Comfort sentiment indicator is historically an important institutional tool in assisting with timing. Since posting that article "US Consumer Comfort Plunged the most in 13 months as 'Personal Finance Fears Mounted".
What may be a conundrum for the FOMC next week, need not be a conundrum for you!
AN UNHOLY TRINITY
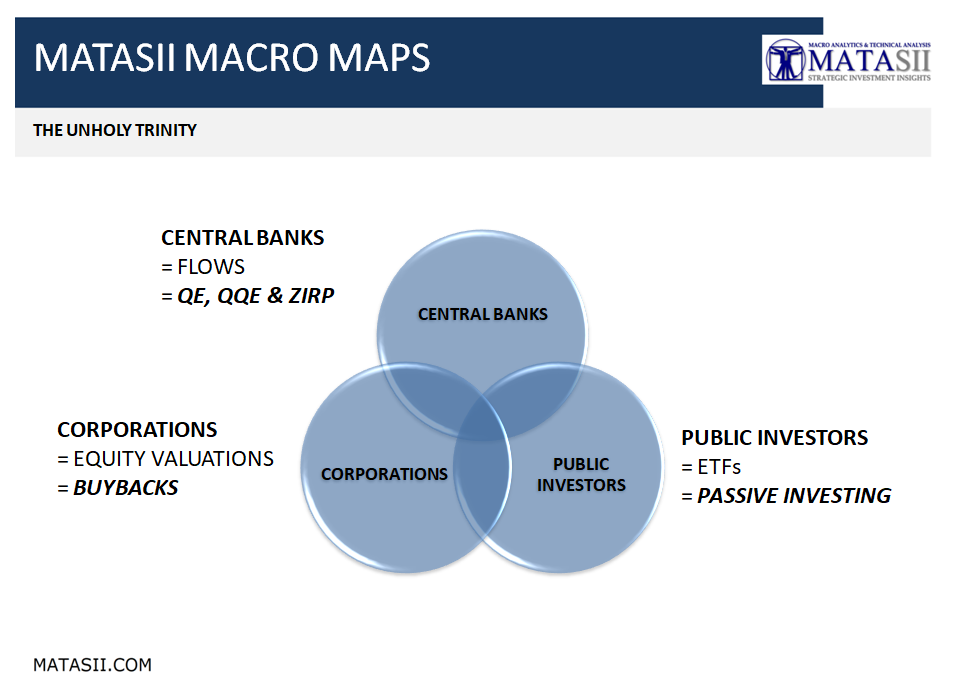
To fully appreciate the conundrum the Fed presently faces we need to understand the importance of three major activities operating independently yet intertwined in three different areas of investment influence.
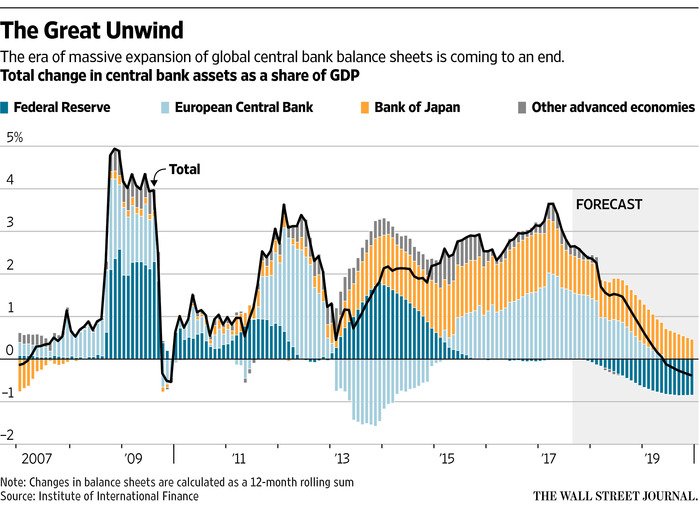
- CENTRAL BANKS have been heavily committed to QE & ZIRP after the 2008 Financial Crisis. The has produced Credit & Liquidity which I will label FLOWS.
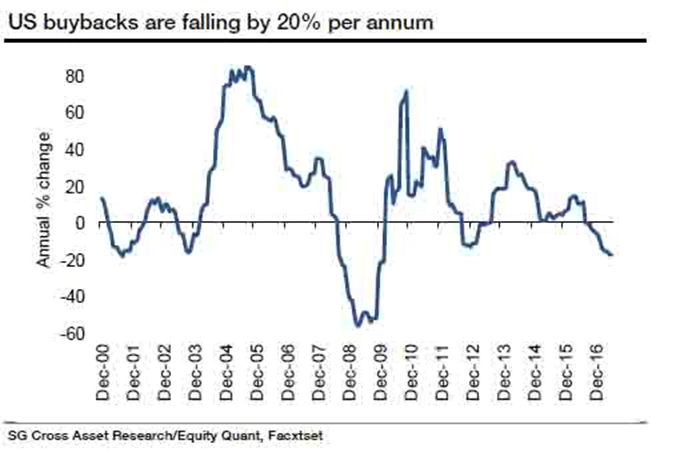
- CORPORATIONS have been heavily committed to Stock Buybacks since the advent of QE & ZIRP. These activities have fostered major movements in EQUITY VALUATIONS.
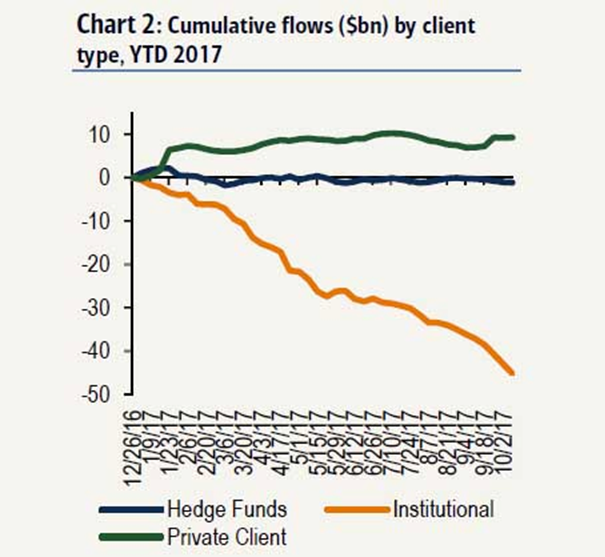
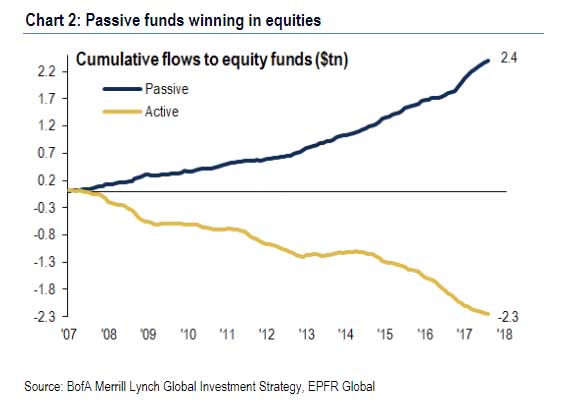
- PUBLIC INVESTORS have shifted from the use of Active Managers (ie Mutual Funds) to Investments vehicles using quick entry and exit ETF's which have become dominated by those tracking the major indexes or popular assets such as the FAANGS. This shift has fostered PASSIVE INVESTING.
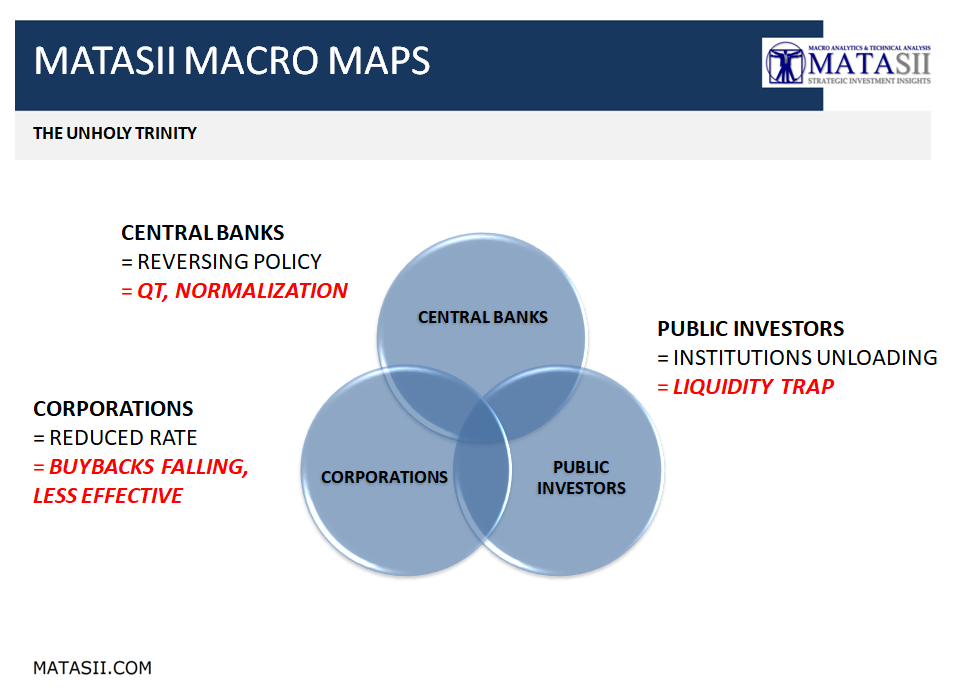
Unfortunately, the Unintended Consequences of these three entities has the potential to now create a perfect storm.
- CENTRAL BANKS are REVERSING POLICY to Quantitative Tightening (QT)
- CORPORATIONS are REDUCING THE RATE of Stock Buybacks,
- PUBLIC INVESTORS are heavily into Passive Instruments that may LACK LIQUIDITY if aggressive selling occurs which is specifically the reason they were bought in the first instance.
Consider the degree which these shifts are occurring:
- CENTRAL BANKERS: QE, QQE & ZIRP going to QT, Normalization
- CORPORATIONS: SHARE BUYBACKS now Falling & Affect being Reduced
- INVESTORS: PASSIVE INVESTMENT (ETF GROWTH) now seeing Professionals Leaving & Public Rushing In
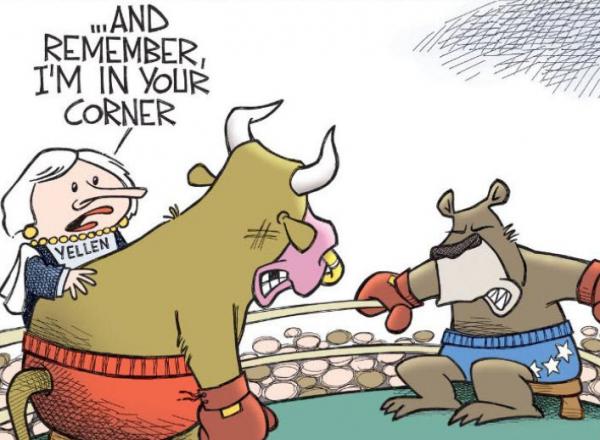
The psychological issue with the collapsing Unholy Trinity will be the perception of the withdrawal of the Bernanke / Yellen “PUT”. The Central Bank will no longer be seen to be supporting higher asset values in its quest to stimulate consumer demand through the “Wealth Effect”.
This may be a bigger issue then the reality of the individual components?
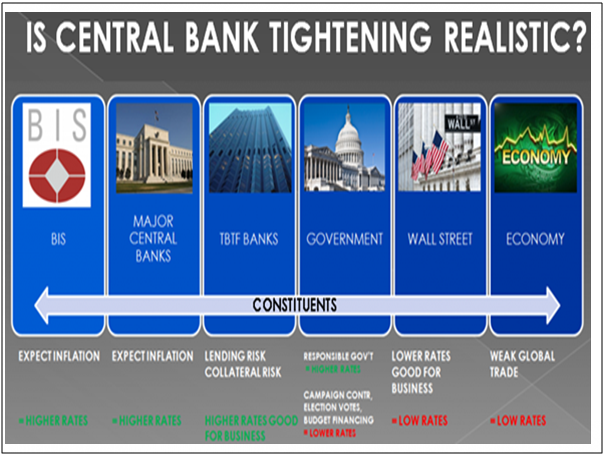
CONSTITUENTS
The Federal Reserve is being pulled in different directions by major stakeholders in the US & Global Economy.
On the one side (in this chart), we see the Central Bankers Bank, the Bank of International Settlements in Basel Switzerland is out with a major paper concerning the magnitude of the coming inflation problem which they feel country central banks must be aggressively preparing for. I will be talking more about this BIS research in an upcoming Macro Analytics video with Charles Hugh Smith.
Meanwhile the Major Central Banks of the world are all talking about various levels and time frames for QT. The question is just how much of this is nothing more than "spin" or just trying to talk the markets into more fiscal discipline less speculation and more prudence.
On the other side (of this chart) we have both the US Economy and Wall Street basically promoting continued low rates and stimulus - for differing reasons.
In the middle we have the Government needing both for conflicted reasons.
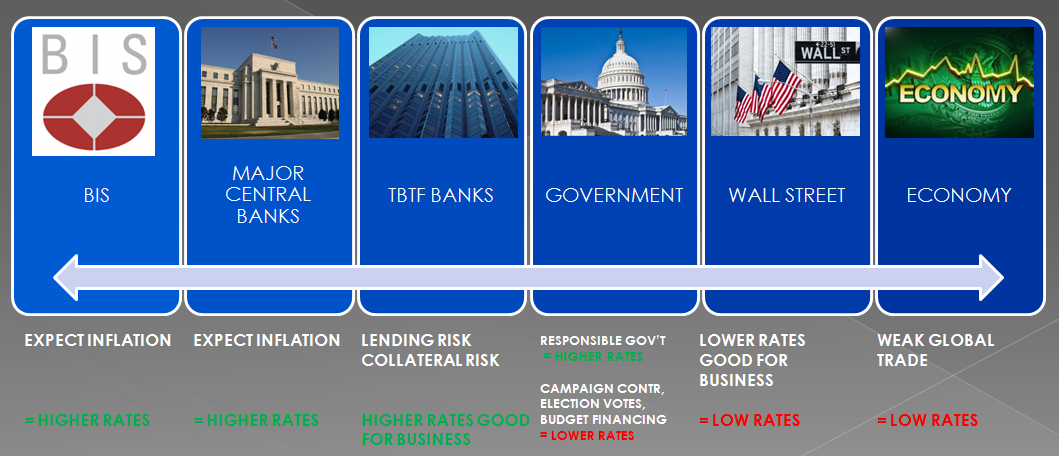
An equilibrium balance must somehow be struck.
The chances are high that the solution will be minimally superficial change until the choice is made for them. At that point the central banks will be forced by all the constituents to react.
However, as you would suspect there is a problem in continuing to 'kick the can down the road' which has been occurring for 8 years. The Fed is quickly running out of roadway!! As long as our 2010 Thesis paper entitled "Extend & Pretend" we have witnessed this as we papered over the underlying issues causing the Financial Crisis.
EQUILIBRIUM v STABILITY
Though we perceive things to be currently stable, in actual fact this is not the case. Unusually high market levels as measured by a large basket of historic metrics (which we are currently experiencing) is inherently unstable. We may have equilibrium, but it is likely going to be short term on a relative basis.
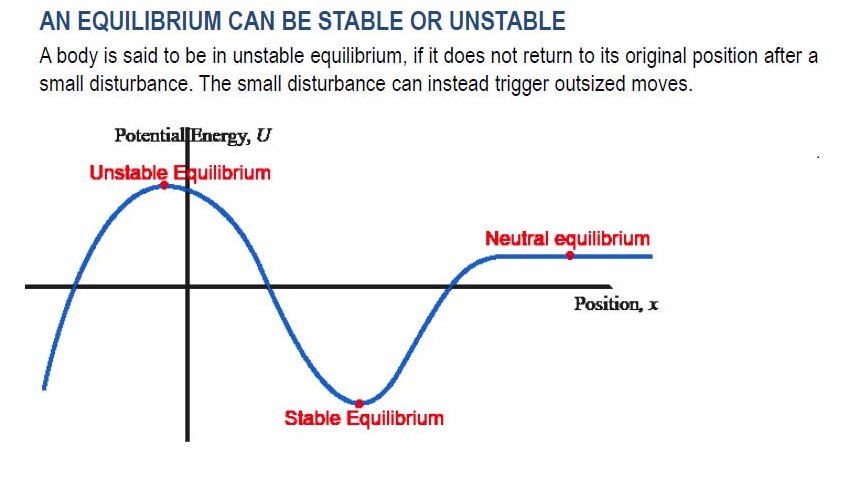
A better way to view this equilibrium or temporary stability is shown here. Something always occurs which tips the balance. Then we quickly discover whether something is stable or in fact unstable. Like an avalanche, everything appears stable and in equilibrium until abruptly it isn't!
It is a delicate balance the Federal Reserve is attempting to manage. They may be successful near term but the chances of sustaining this are against them.

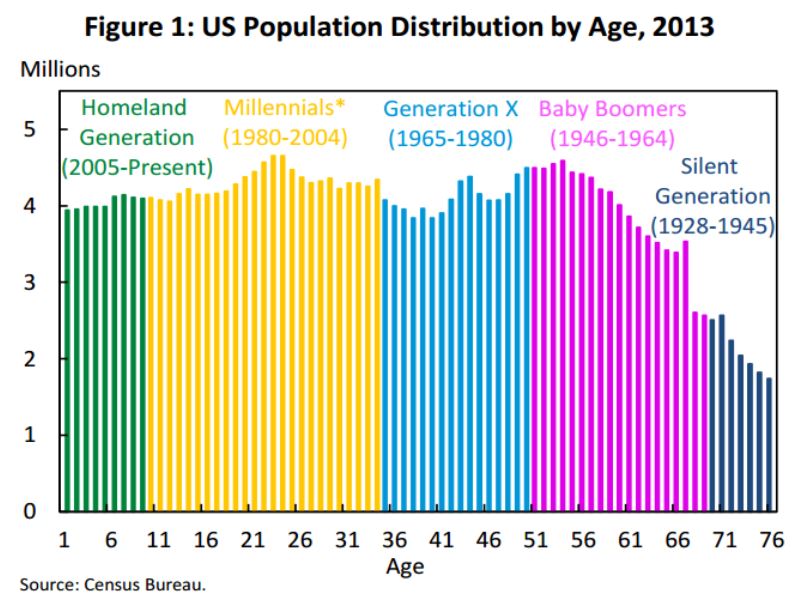
DEMOGRAPHIC DAM
Lets consider just one o the many factors working like a glacier. Occurring massively without little apparent notice - the shift in population distribution.
We have approximately 84M Baby Boomers now retiring at a rate of over 10,000 per day. These are people who
- Have Assets,
- Have Pensions and the like,
- Are past there High Consumption years,
- Will be drawing down their pensions and assets to support their later years,
- Will consume less and spend that on different things ( ie Travel, Health & Medial etc)
On the other hand we have nearly 75MMillennials taking their place in the job market and high consumption years.
These are people who:
- Have little money and even less unencumbered assets,
- Who are broke with high Student Loans debt levels,
- Are Finding high paying jobs scarce,
- Who are getting married, starting families an buying houses much later,
- Who are forced to consume less with basic subsistence needs being the priority.
How does this bode for the Fed who are reliant on a 70& consumption economy for GDP growth?

CONCLUSIONS
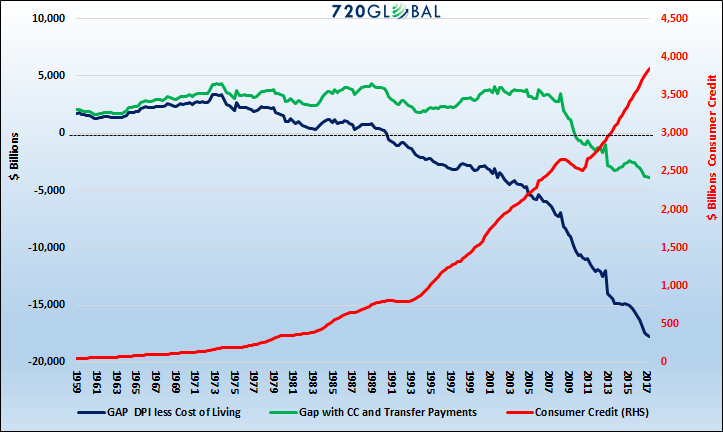
This chart shows how things have been held together before this shift fully accelerates.
The shell game has been cheap and readily available Consumer Credit (like FNM & FDE Government Conservatorships funding 95% of all US residential mortgages) and Government Transfer Payments (like 54M on Food Stamps and other government assistance programs).
The Fed's choices to not destabilize border on the impossible.
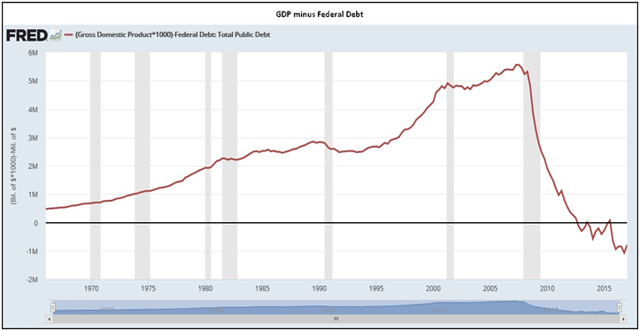
But it gets worse. The reason is because our current economic growth is an accounting illusion. I laid this out in this year's 2017 Thesis Paper "The Illusion of Growth".
This chart from a recent post on MATASII.com illustrates what happens if we reasonably consider that debt is not income.
Let me explain.
Consider that someone not employed and making no income, yet receiving some sort of government subsidy or transfer payment to live which is financed through government debt - that debt is considered income in out 70% consumption economy. Does that make sense to you.
It may have been well and good when overall debt levels were low, government entitlements were low, government debt was low and consumption was 35% of the economy but not today. One of the things I learned early in studying Engineering as a young man was that formula's often had boundary conditions. Outside of these Boundary Conditions the formula would no long provide accurate and reliable results (if it even worked at all), often because the underlying assumptions were no longer valid.
This chart shows that by simply not allowing debt to be considered as income, the US is in a Depression. Economic growth has been plummeting for the last 10 yeas.
DO LITTLE UNTIL THE DAM BREAKS
What we have is minimally:
- Problem 1: An Illusion of Growth (Debt considered Income)
- Problem 2: High Levels of Government Dependency (TP & CC)
- Problem 3: Underfunded Global Entitlements ($400T in Pensions alone)
The list goes on but it sufficient to see that somehow the Fed must keep things going - somehow.
The Federal Reserve is likely to continue to do little to nothing until the "Dam Breaks" - then we will see forms of QE after QE, NIRP, Helicopter Money, Guarantee Facilites and more entitles placed in government sponsored Conservatorships.
Let me give you a final though for you to think about before we end.
If you are confused with the terror, social unrest and near police state you see on your nightly TV news, as well as the issues we have just outlined: then remember what Vladimir Lenin observed 100 years ago - Fascism is Capitalism in Decay. Just maybe we shouldn't be allowing central planning and control institutions like the Federal Reserve be making these monumental decisions for us.
Aren't they are partially responsible for getting us into this position in the first place.