
IN-DEPTH: TRANSCRIPTION - LONGWave - DECEMBER - Gold Will Test Your Courage
SLIDE DECK
TRANSCRIPTION

COVER
Thank you for joining me. I'm Gord Long.
A REMINDER BEFORE WE BEGIN: DO NO NOT TRADE FROM ANY OF THESE SLIDES - they are COMMENTARY for educational and discussions purposes ONLY.
Always consult a professional financial advisor before making any investment decisions.
AGENDA
Precious metals have been selling off in a corrective / consolidation since early August. We warned of this in our fall newsletters and specifically outlined the “handle” formation pattern we were expecting, as part of a classic “Cup and Handle” pattern formation in the early October LONGWave video entitled: “Will 2021 Be the Year of Hard Assets?”
SLIDE 5
The bottom line is there are major profits ahead for precious metals but it will take Courage to realize them. That Courage needs to be built on a foundation of what will be at play impacting precious metals.
SLIDE 6
We are going to explore this illustration in more detail.
- You will immediately note that the swings are major and not for the weak,
- The swings are simplified into 5 legs.,
- You will also see major influencers and terms such as Reflation, Deflation and the Commodity Super Cycle labeled.
This is an illustration and as such it is intended as a roadmap with guide posts to show you the way and what to be prepared for. The targets are areas we expect but will be determined by macro analytic and technical factors and ratios which we will discuss.
SLIDE 7
We are going to start with the big picture and what the LONG Cycles and the Commodity Super Cycle suggests we consider.
As we go, remember what I pointed out in November UnderTheLens video entitled “Markets versus Economics”. they are no longer the same. So just because the economic cycles are headed down does not mean the financial markets are going down! No time in history has this been more evident.
They do however give us insights into how the powers to be will likely respond regarding policy, regulatory and taxation decisions
SLIDE 8
The Macroeconomic Cycles from the foremost Cycle expert, Harry Dent, warned of economic weakness in the last decade and into the early part of this decade. We had that and it prompted unprecedented monetary stimulus which distorted the capital markets and created one of the largest market advances in history
SLIDE 9
The Kondratieff long wave cycle shows the K6 low at the top occurring by mid decade or 2025. So we know we are in for unprecedented turmoil for the next few years.
SLIDE 10
This is supported by the ground breaking work of Strauss & Howe in their work “The Fourth Turning”.
SLIDE 11
We need to appreciate the profound impact of an aging “baby boomer” generation will have on a US economy dependent on 70% consumption and younger generations that can’t take up the yoke, being burdened with student debt and employment issues.
Though these are both expected foundational contributors for Long Cycles, the policy responses are not nearly as precise.
SLIDE 12
Therefore though my colleague Charles Hugh Smith’s work show here shows 2021, the unfolding window should likely be considered a little broader.
SLIDE 13
2021 will be a tumultuous year but we may want to consider our window of turmoil and social strife extending through 2023.
SLIDE 14
With that consideration in mind let’s look at the Commodity Super Cycle. This chart from 2016 suggested the expanding oscillations ending with 29 year lows in approximately 2025.
SLIDE 15
However there is a good chance that this may occur a little sooner and more abruptly because of the damage already done to the entire global commodity sector.
SLIDE 16
This chart of the US Commodity Price Index suggests by 2025 the bounce may already be well on its way.
The bigger point is that major advances in tremendously undervalued commodities (both materials and foods) will soon see major advances. Material commodity prices and value will likely gain from massive fiscal stimulus policy driven Infrastructure spending targeting aging and overdue existing infrastructure. Global Food inflation is already rising and precious metals have clearly begun reacting to currency debasement and economic reflation policies.
SLIDE 17
What this distills down to is:
- The Reflation leg #3 taking us through 2021,
- The fall-out from the pandemic lock-down driven business failures, bankruptcies and just too many for the governments to save, will result in almost uncontrollable global deflation. Deflation was a problem central bankers were facing unsuccessfully even prior to Covid-19.
- All assets will be impacted by the ravages of a protracted double-dip major global recession. Precious metals will be no exception and will see weakness. During this period, exploding fiscal spending and currency debasement will be found lacking.
- Expect currency controls and predatory regulations to possibly impact gold prices. Silver may escape this?
- By 2024 the Commodity Super Cycle will have exploded higher and taken precious metals with it.
You are likely wondering:
- Why only $2250/oz for gold as a high before the 2022 deflation wave hits?
- No doubt the $1100/oz support low in 2024 you find shocking!
- Also you are likely scratching your head wondering about $5000/oz way out in 2038?
First we need to understand that at this point these are big picture projections. They highlight the critical need to fully appreciate the degree of global financial turmoil ahead which will impact precious metals and additionally the time it will take to resolve issues during times of financial stress.
This why it will take Courage to hold gold!
SLIDE 18
It will also take analytic tools to continuously reassess the milestones I am suggesting here. The pivot levels WILL NO DOUBT change. Therefore you will need the tools to know what, why and by how much as we tune what I will refer to as the big picture MARKERS.
I now want to show you how WE PLAN to be continuously assess the validity of these MARKERS through Gold Ratios and Technical Analytics.
First however let me briefly revisit the critically important Inflation / Deflation Waves in process.
SLIDE 19
As we discussed in our October UnderTheLens video entitled “Inflation PLUS Deflation” are both occurring simultaneously, but impacting different areas of the economy. Inflation is steadily rising while Deflation is steadily falling. What changes in a cyclical fashion is our sentiment towards and focus on either “flations”.
Humans are cyclical in nature.
- Call them “mood” shifts if you would.
- Or seasons.
- Or Days and nights.
This is versus time which is linear.
SLIDE 20
In effect we see Inflation as coming in waves because of the counter currents of Deflation. Inflation is continuing to steadily rise and broaden in its economic scope.
SLIDE 21
Deflation is also continuing and broadening. To many Americans this is not intuitively obvious but for most of the rest of the world it is abundantly clear.
SLIDE 22
We see as shown, here we have more monetary / fiscal driven inflation ahead in 2021 as part of global reflation policies. We have continuing to mount inflation in global food prices.
However, a Global Recession as fallout to the Pandemic, won’t fully be seen in the context of permanent job losses, bankruptcies, a demand shock and wage and benefit cuts until 2022, but evidence will be everywhere throughout 2021.
SLIDE 23
We have explained this road map in previous videos. Stagflation is an environment of both heightened inflation while having slow growth which brings increasing deflationary pressures.
SLIDE 24
This is the era we see as labeled leg #4 in red from 2022-2024.
It is going to be hard and though it will continue out past 2024, precious metals will separate from it as the Commodity Super Cycle kicks in.
SLIDE 25
Now let’s look at how you discern these pivot points and the associated “markers” that go with them.
SLIDE 26
We have previously outlined how Gold tracks very closely to the 10 Year US Treasury REAL yield rate on a long term basis……
SLIDE 27
.. and on a short term almost daily basis.
SLIDE 28
To understand this correlation you first need to understand what is happening with the real rate. The real rate is the nominal rate less the breakeven inflation rate.
The 10 year UST Treasury Yield chart shown here is the nominal rate. It is rising as we have predicted and feel it will rise further.
It is rising since earlier in the year for a number of reasons but one is the fact that the 10Y Breakeven Rate is rising as well as the 10Y US TIPS rate.
SLIDE 29
The 10 Year Breakeven Rate and the 10Y US TIPS Rate are closely coupled. Both are driven by inflation whereas the TIPS rate has a supply / demand component associated with it because it is a trading instrument.
Shown here is the US Breakevens for both the 10Y and 5 Year.
SLIDE 30
Shown here in the top green line is the 10Y Breakeven. Below it in blue is the 10Y Nominal rate. When we subtract the breakeven from the nominal we get the red 10Y Real Rate.
You can again see the lift in breakevens since earlier in the year but that real rates have been falling since late 2008.
SLIDE 31
With is foundation in place lets show how you predict the changes. That comes from China! Specifically, the China Credit Impulse.
The China Credit Impulse leads the 10Y Real Rate by approximately 12 moths and has on a consistent basis since the beginning of the last decade.
It is signaling rising 10Y UST Real Rates in first quarter 2021 which will sustain itself throughout 2021 and could be quite a jolt to the markets..
And as we showed earlier Gold mirrors the 10Y UST Real Yield.
This chart is somewhat dated as on November 30th, Beijing "Unexpectedly" Injected an additional $30 Billion into its Financial System, sparking doubts about the true state of the Chinese economy. More may still be coming.
This historically has been good for precious metals but will be a shock to an overleveraged US economy and financial markets.
SLIDE 32
The upper $2250 will be blown-out if the Fed is unable to counter this by aggressively controlling US Treasury rates and the Yield Curve. It will be an interesting tug of war that you will have to watch closely.
SLIDE 33
You will also need to watch how the 10Y TIPS performs versus the S&P forward PE Ratio. Multiple expansions which have been driving the market can be expected to compress as money moves into inflation protected TIPS.
SLIDE 34
Also watch the correlation of Global Negative-Yielding Debt versus Gold.
Right now with Gold and the US Dollar both weakening together, it is sending a signal of potential problems ahead. This is supported in this chart with Global Negative-Yielding Debt advancing.
SLIDE 35
Yet another ratio to follow is the Copper/Gold ratio versus its correlation with the US 10Y Nominal Yield.
It is suggesting that 10Y US Treasury yields will soon catch-up to the Copper/Gold Ratio. It could be a violent catch-up!
SLIDE 36
Let’s consider some Technical Analysis for a moment.
We have a long term Cup and Handle formation shown here on the right going all the way back to the early 80’s.
SLIDE 37
We now see smaller degree fractals of the same pattern now emerging.
We have shown this chart since we first signaled the gold breakout shown in the red circle, and confirmed it with the blue circle.
Both confirmed the long term elliptical structure overall.
SLIDE 38
Our Elliott Wave count shows the current “marker’ for the red circled 3rd wave at approximately 2250.
Our analysis shown here is only for your consideration and is intended to be added to your own research.
SLIDE 39
The “markers” and times will no doubt change but hopefully we have given you a conceptual framework and some tools to assist you.
SLIDE 40
Our further analysis, other important considerations and real time charts are all available in the subscription side of the MATASII.com web site.
We hope you have the Courage to take advantage of what lies ahead.
SLIDE 41
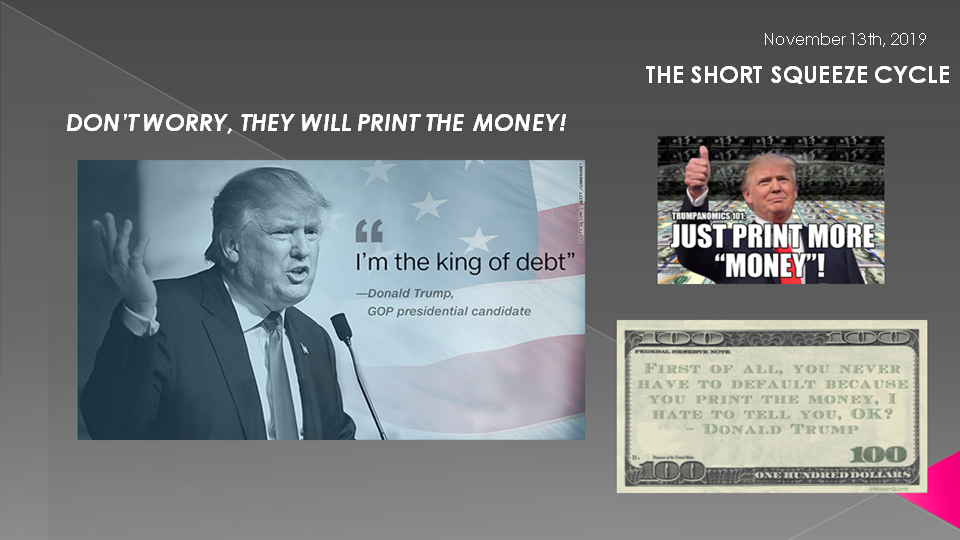
As I always remind you in these videos, remember politicians and Central Banks will print the money to solve any and all problems, until such time as no one will take the money or it is of no value.
That day is still in the future so take advantage of the opportunities as they currently exist.
Investing is always easier when you know with relative certainty how the powers to be will react. Your chances of success go up dramatically.
The powers to be are now effectively trapped by policies of fiat currencies, unsound money, political polarization and global policy paralysis.
SLIDE 42
I would like take a moment as a reminder
DO NO NOT TRADE FROM ANY OF THESE SLIDES - they are for educational and discussions purposes ONLY.
As negative as these comments often are, there has seldom been a better time for investing. However, it requires careful analysis and not following what have traditionally been the true and tried approaches.
Do your reading and make sure you have a knowledgeable and well informed financial advisor.
So until we talk again, may 2020 turn out to be an outstanding investment year for you and your family.
Thank you for listening
