
IN-DEPTH: TRANSCRIPTION - LONGWave - SEPTEMBER 2019
WHAT IS KEEPING THE MARKET UP?

COVER
Thank you for joining me. I'm Gord Long.
A REMINDER BEFORE WE BEGIN: DO NO NOT TRADE FROM ANY OF THESE SLIDES - they are COMMENTARY for educational and discussions purposes ONLY.
Always consult a professional financial advisor before making any investment decisions.


AGENDA
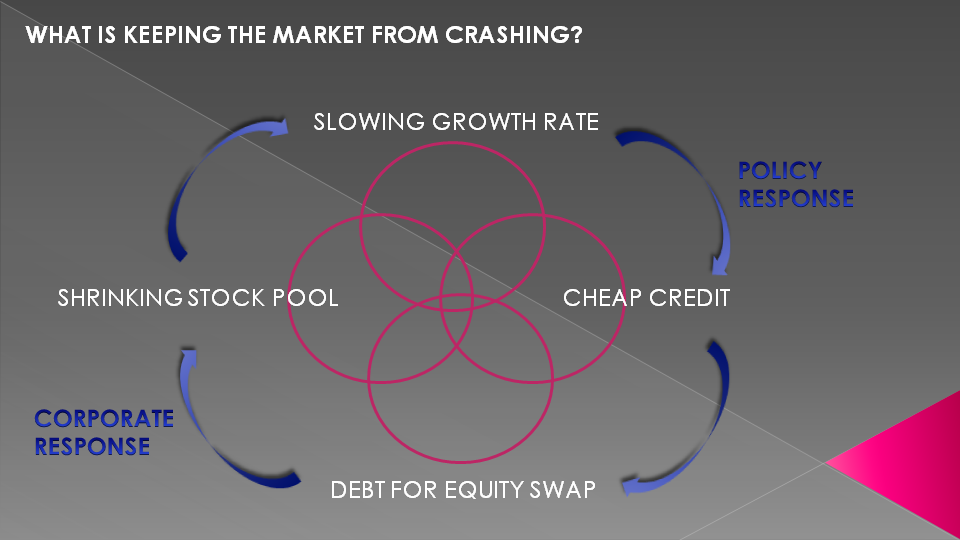
In this Month’s LONGWave video I would like to discuss what we believe is holding the markets up despite:
- Failing Fundamentals,
- Elevated Risk and the
- Public not participating in this historic rally
-- all in concert with what our MATASII charts tells us lies ahead.
As such I would like to cover the items shown here.

SLIDE 5
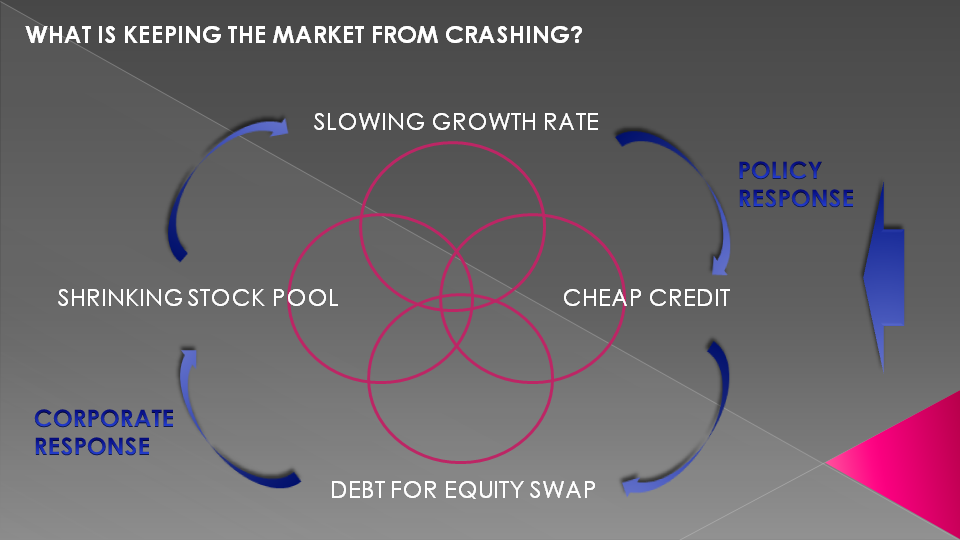
I have been writing & producing videos since the 2008 Financial Crisis laying out the facts that we were headed down a road which will inevitably lead to a Minsky Melt-up in financial asset prices. This wasn't to say there wouldn't be scary pull backs on the way, but in the bigger picture they would matter little to the path that four inter-related & contributing factors had placed investors & the financial markets on.
The final outcome will be a Fiat Currency Collapse or more hopefully a global re-ordering and re-balancing of global trade & finance.
Meanwhile this path has afforded investors unprecedented opportunities that the overall public has not fully taken advantage for reasons that I will leave to other videos.

SLIDE 6
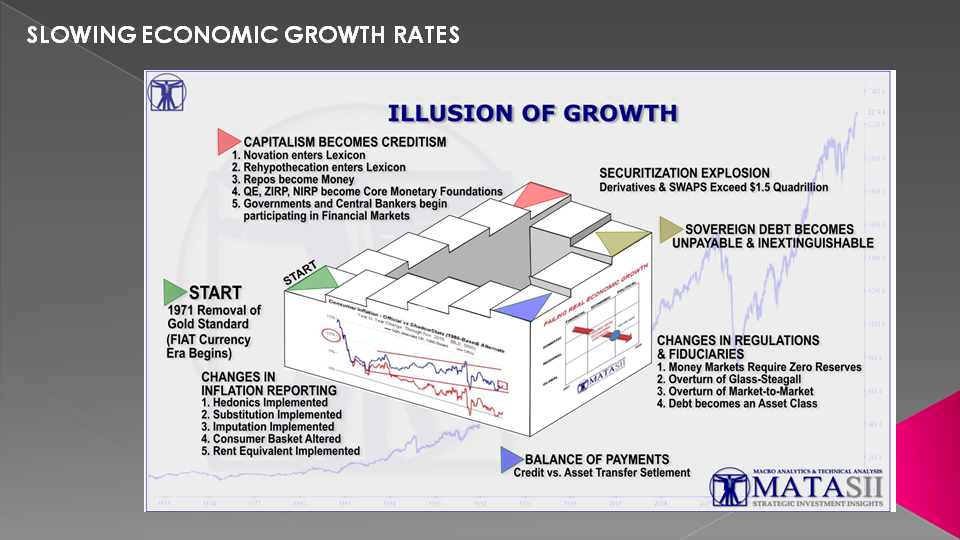
The major driving force which has lead to the crippling effects of 'Unsound Money' is the slowing RATE of Global Growth.
In our 111 page, 2017 Thesis paper "The Illusion of Growth - When Leverage Fails" we laid out the undeniable fact of slowing REAL global economic growth RATES. The first and second derivatives of this trend are having profound impacts.
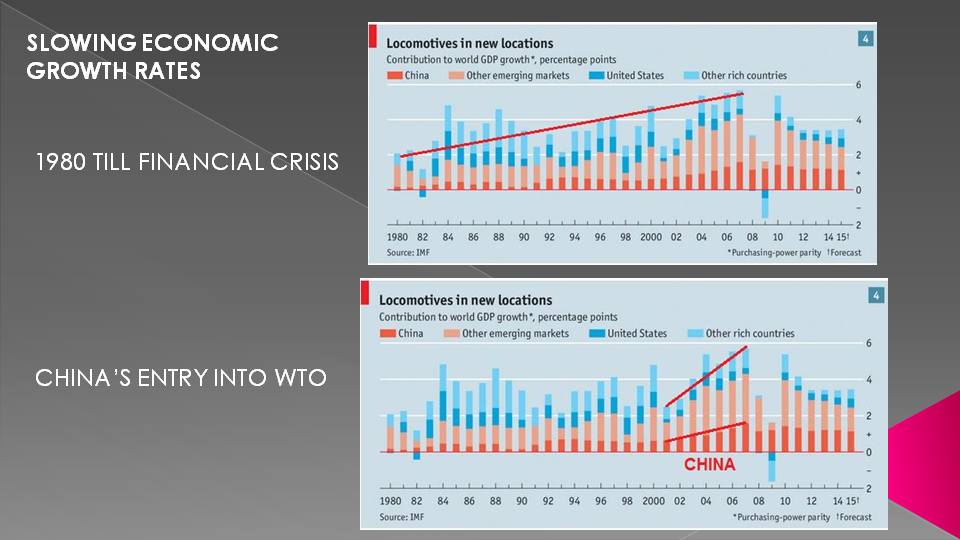
SLIDE 7 - 1980 TO FINANCIAL CRISIS
Superficially, Global Economic Growth has been rising since 1980 (we will come back to that date in a moment) with a major "spurt" after China entered the WTO. But as we laid out in our thesis paper the whole formula for Real GDP is hopelessly flawed in today's society - from the Inflation Deflators being used, to Growth in Government's contribution through massive Debt increases, to Consumption through Government transfer payments and entitlements. I will leave you to read the Thesis paper on the MATASII site.
SLIDE 8
The reality is even without factoring in all the flaws in the formula, since the 2008 Financial Crisis even the official GDP numbers are falling at unprecedented levels - the result of public policy initiated being unable to fix the problem.

SLIDE 9 - POLICY RESPONSES
Public, Fiscal & Monetary Policy responses have been a disaster which we have chronicled on a regular basis. The biggest and most obvious policy has been cheap money, credit & leverage via policies such as Quantitative Easing, QQE & TLTRO.
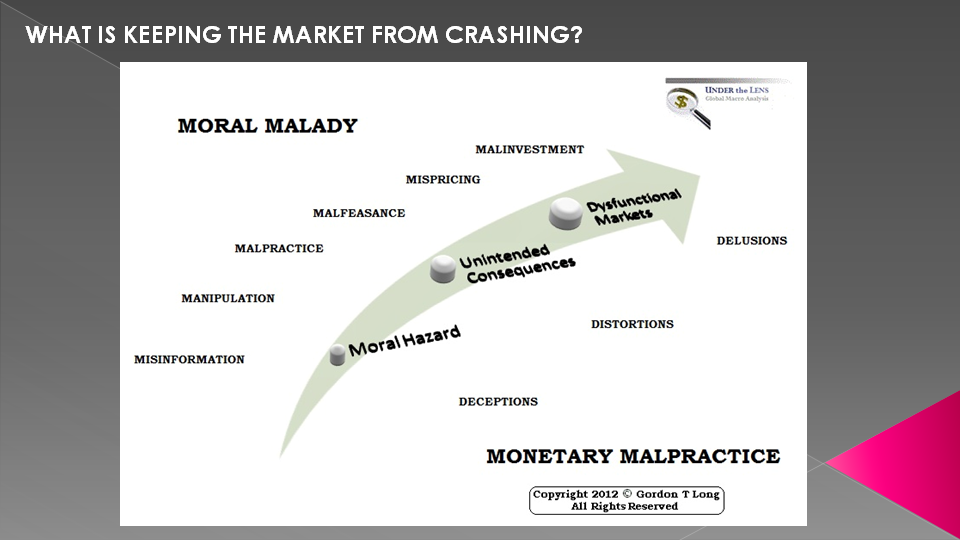
SLIDE 10 - MONETARY MALPRACTICE
What we have often referred to since 2012 is a Monetary Malpractice road-map that would inevitably lead to Dysfunctional Markets, Mali-investment and Inventor Delusion and Speculation.
7 Years later we are now unquestionably there!!
SLIDE 11
Since that Fed Chairman Volcker driven 1980 date we have been living in a world of almost continuously falling yields, making everything cheaper to finance from Consumer consumption to massive Governments debt financing to Global Corporate debt financing.

SLIDE 12
This has fundamentally and dramatically changed the behaviors of all three - maybe most importantly for the Capitalist System's underpinnings as it moved us from traditional Capitalism to Creditism and with it Corporate Strategy steadily changed to "Debt for Equity Swaps".
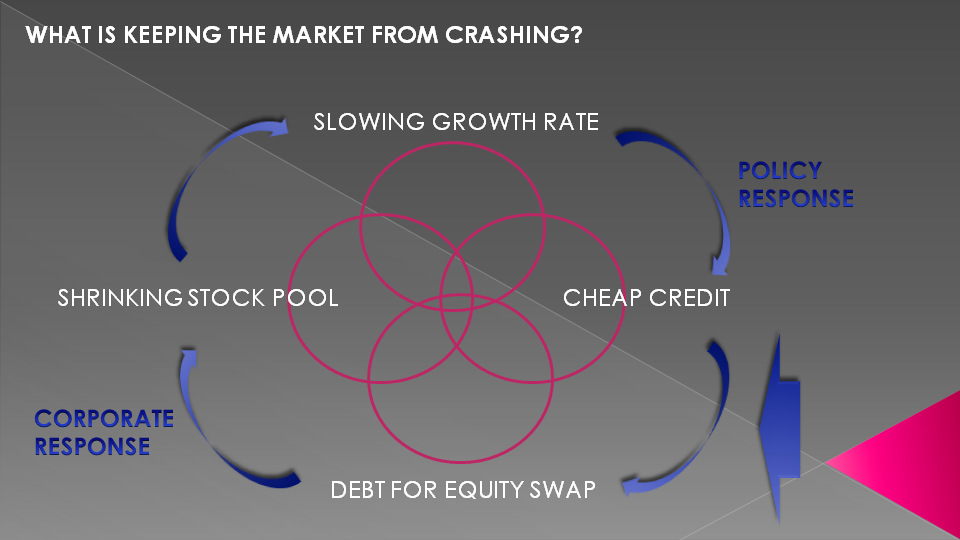
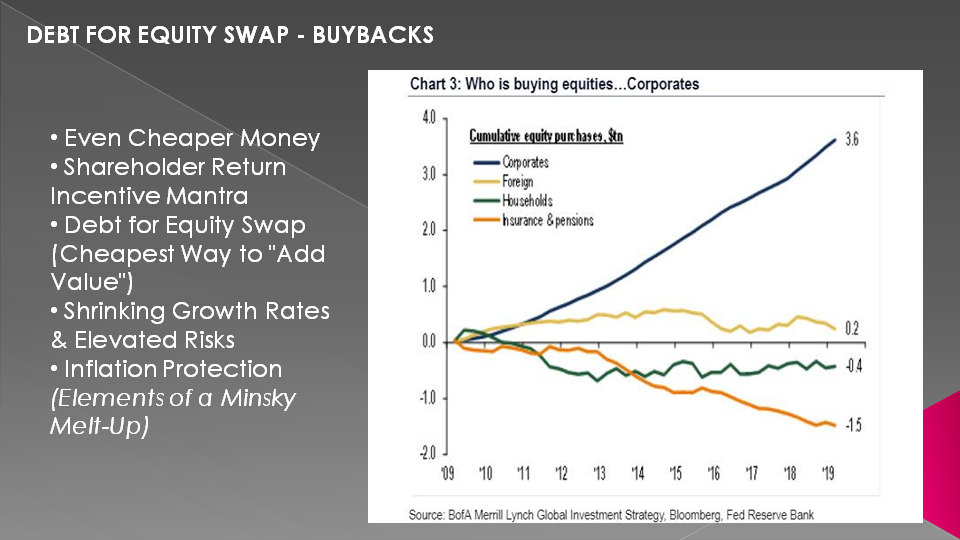
SLIDE 13
Corporations began buying back their stocks using debt offerings in a way never seen before for a raft of reasons.
Presently, it is almost solely Corporate Buybacks that are buying the markets as can be seen here. Institutions and Individuals are standing aside.
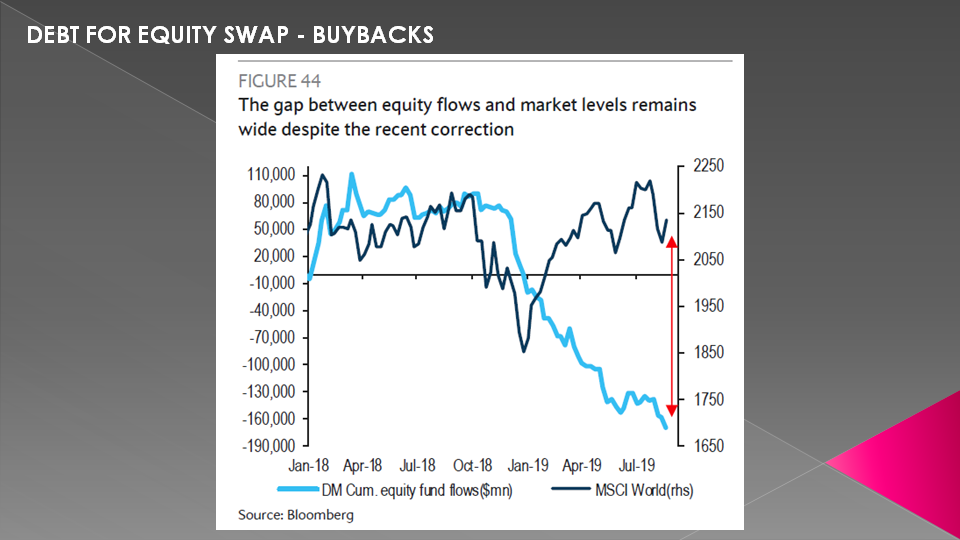
SLIDE 14
Equity Fund Flows from investors are falling but Equity levels remain elevated due to Corporations buying back their shares.
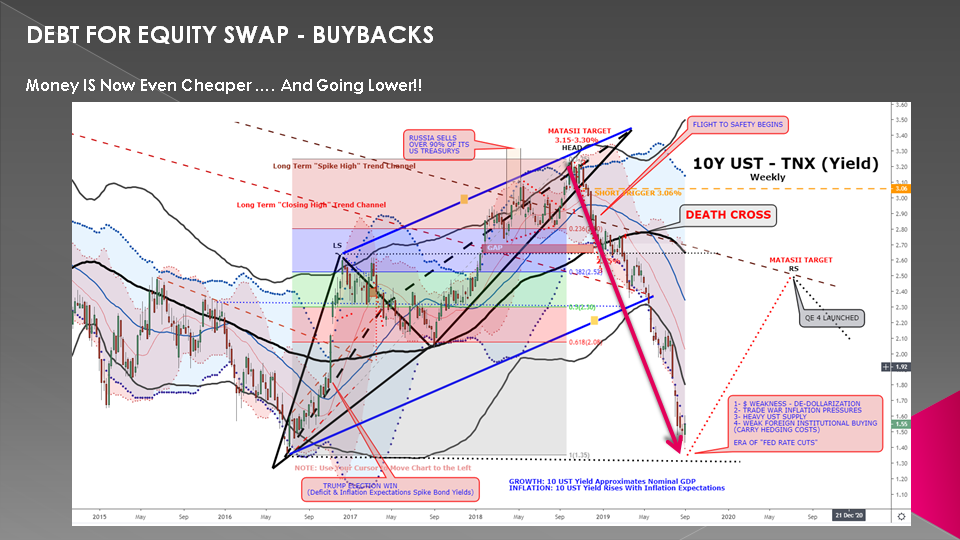
SLIDE 15
With money again becoming cheaper, as the central banks reverse policy back to cheap money, reduced Fed Funds Rates, stoppage of Fed Balance Sheet reductions and likely more QE it is getting cheaper for corporations to keep buying.
SLIDE 16
As I said there are many reasons for Corporations to follow this strategy when overall global economic growth slows and the risks involved in establishing new markets increases due to:
- Technology change & obsolescence,
- Regulatory hurdles,
- Shortening product life cycles,
- Decreased ability to establish "Barriers to Entry" or as Warren Buffett describes as "Economic Moats"
The strategy has become increasingly about buying growth versus generically developing it. That is "buy it" versus "make it".
Let others take the risk and then buy the winners as their business and markets begin to take form. Minimize the risk and use you stock as the acquisition currency.
A higher stock prices allows this, precludes a takeover and rewards shareholders and executives.
Cash of your balance sheet makes a company a corporation a takeover target while high debt levels acts as a deterrent.

SLIDE 17
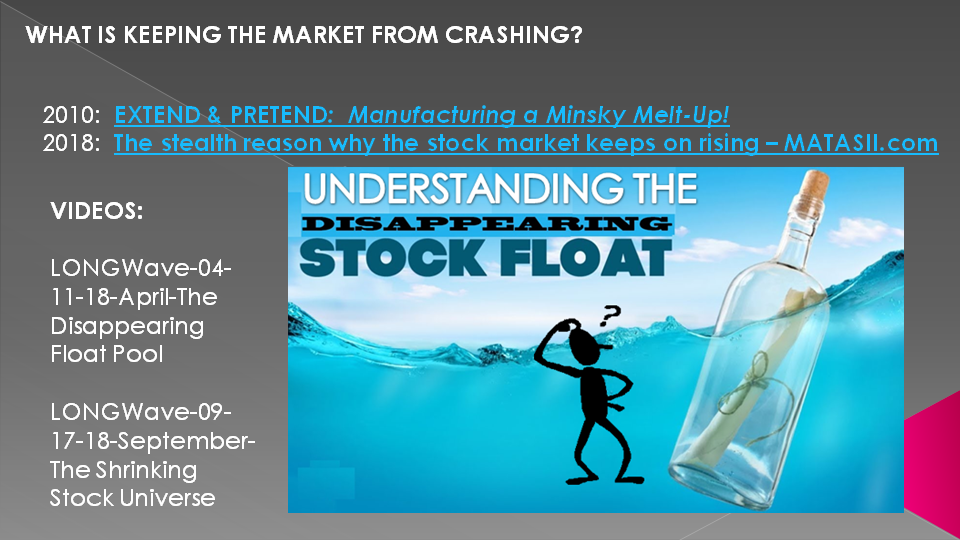
Much of the discussion so far may not come as much of a surprise to most investors. What I have found is that what is often not properly appreciated is that we have a dramatically shrinking stock pool!
SLIDE 18
This is an involved discussions that took a couple of MATASII videos to fully lay out, which I would refer you to within our Macro Analytics YouTube Channel archives.
It basically started in 2005 when when key stock indices were changed to a "Float Adjusted Market Capitalization" basis. This factor alone accounted for ~$1 Trillion in Market Cap if the the markets had been left 'unadjusted'.
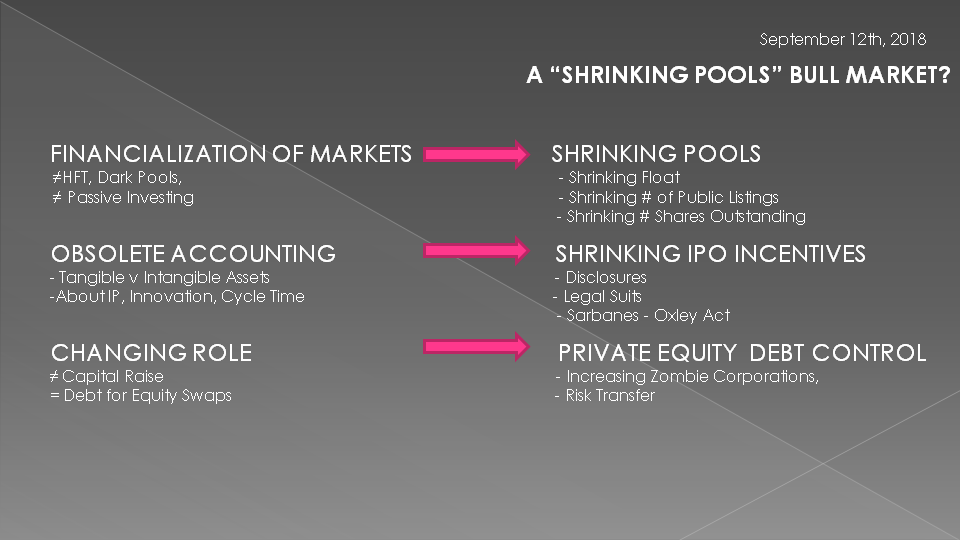
SLIDE 19
However, it is much more than just this. We have:
1- SHRINKING POOLS LISTINGS - In 1996 prior to the explosion in IPO's associated with the Dot Comm bubble and its implosion in 2000 there were 8025 public listed companies trading in the US.
By 2016 that number had fallen to 4333 or a 46% drop in 20 years. This can be attributed to a number of factors but most notably to M&A activity and the growth of Private Equity takeovers.
Additionally we have:
2- TAKEAWAYS FROM THE FLOAT associated with insider trading restrictions. This is a shocking large list which continues to grow in size thereby further reducing the public trading float pool.
Private Equity purchases of the top 4 players alone total over $1T with the industry now having over $10T. Hugh amounts of this money is in public traded companies and is outside the stock pool based on insider trading restrictions.
Thirdly we have:
3-BUYBACKS which have further reduced available shares of a shrinking stock pool by ~$3.5T in the last 5 1/2 years and more than > $1T in 2018. This number is still forecast to top 2018 in 2019
Additionally we have:
4- DISINCENTIVES TO GO PUBLIC is another major factor that has emerged since the Sarbanes-Oxley Act
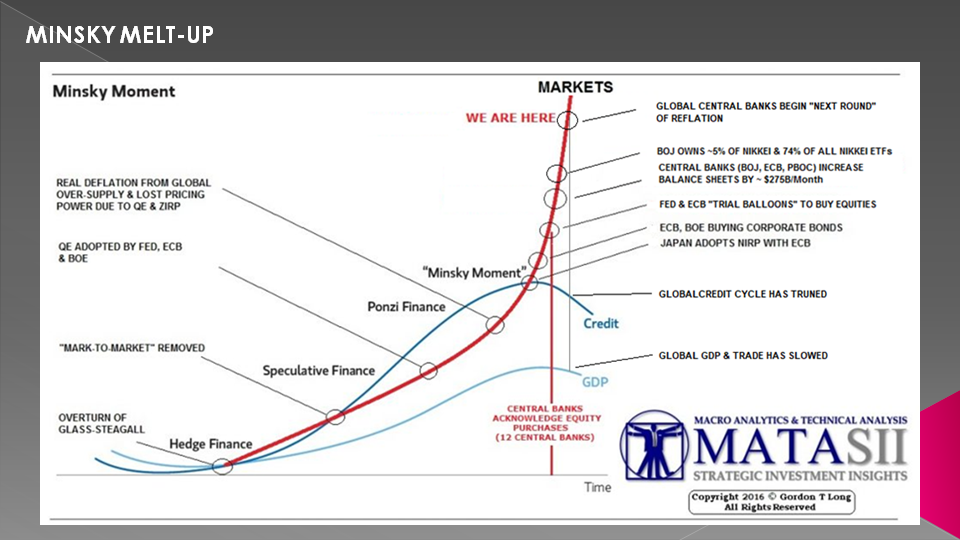
SLIDE 20
The bottom line is that we have a new form of Minsky Melt-up underway with realistically nothing to effectively stop it anytime soon. We have been showing this chart for a few years now and it only appears to go more parabolic.
SLIDE 21
This is an Elliott Wave analysis using a log scales to 'linearize' the parabolic growth underway which can be found on the MATASII site. Yes we experience tough pull backs but in the bigger picture they are nothing more than temporary adjustments.
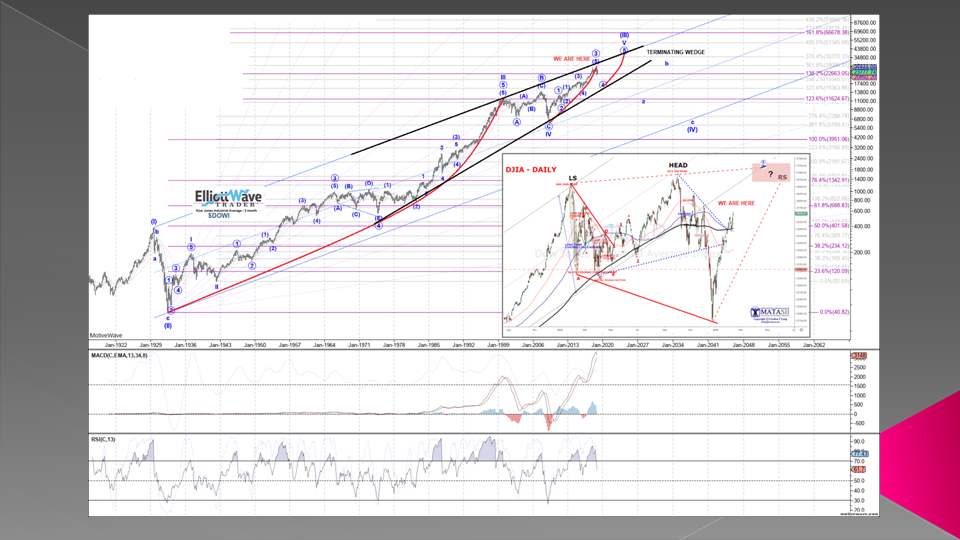
SLIDE 22
Our Macro Analytics charts are suggesting we are near another correction likely between now and year beginning 2020
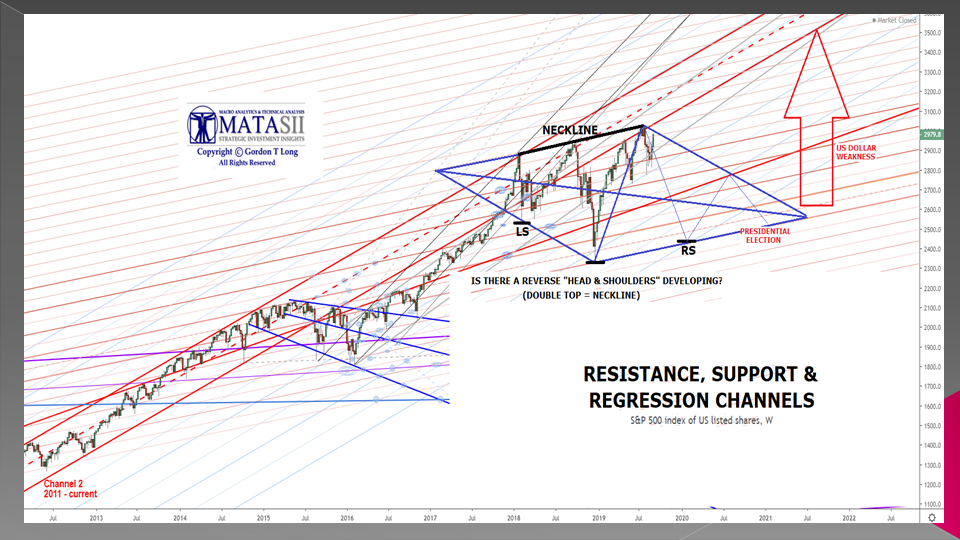
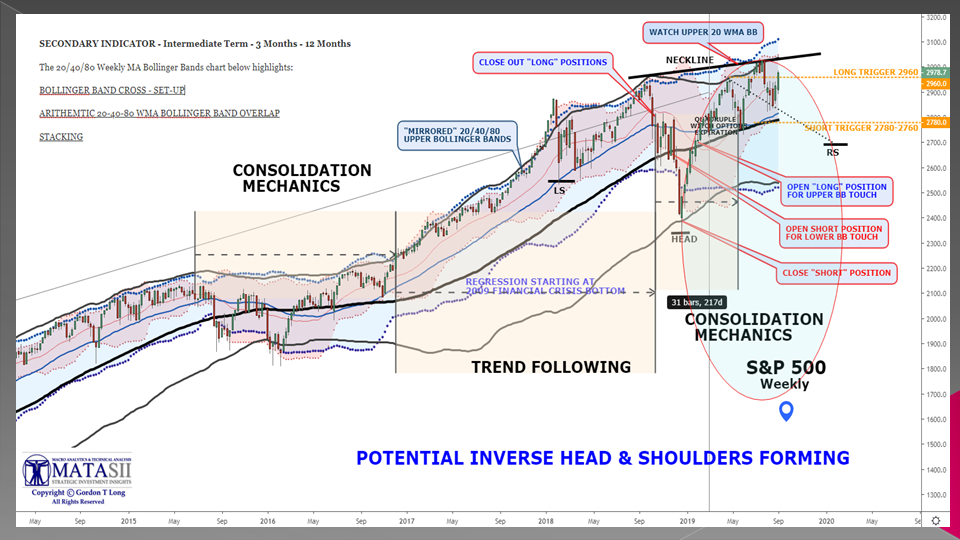
SLIDE 23
Ever indications are it will deliver a likely Reverse Head and Shoulders pattern. Notice the red ellipse.

SLIDE 24
On a smaller scale it looks something like this
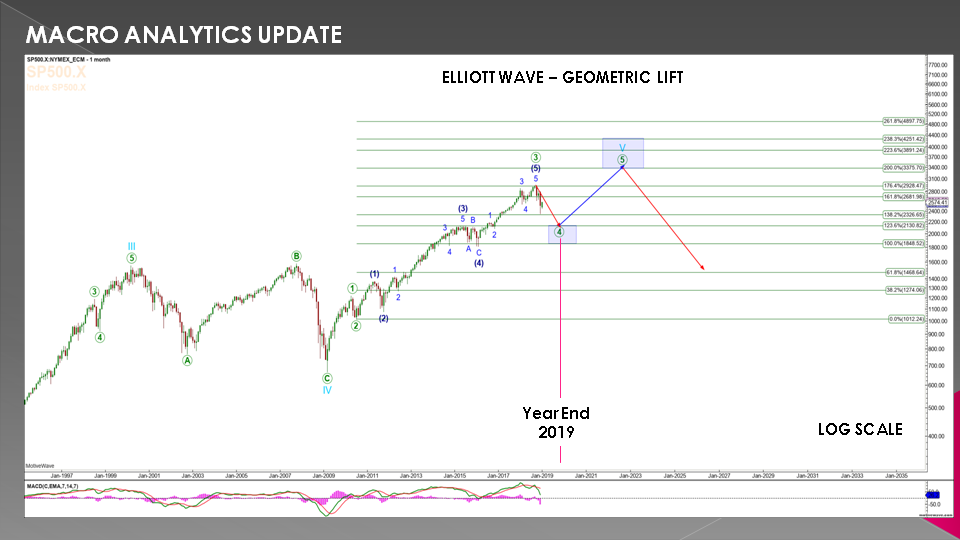
SLIDE 25
The supporting Elliott Wave count maps like that shown here.
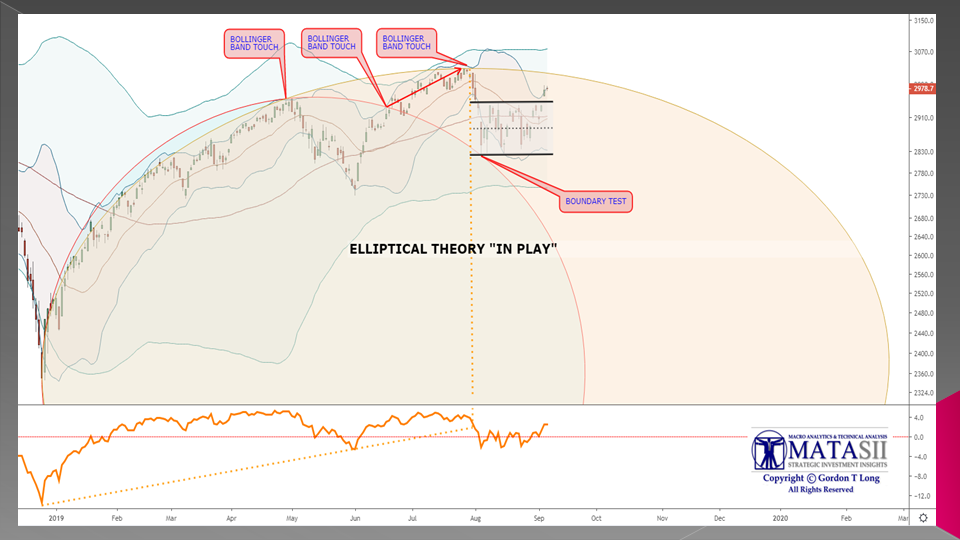
SLIDE 26
This in turns fits perfectly with our Elliptical Theory projections ....
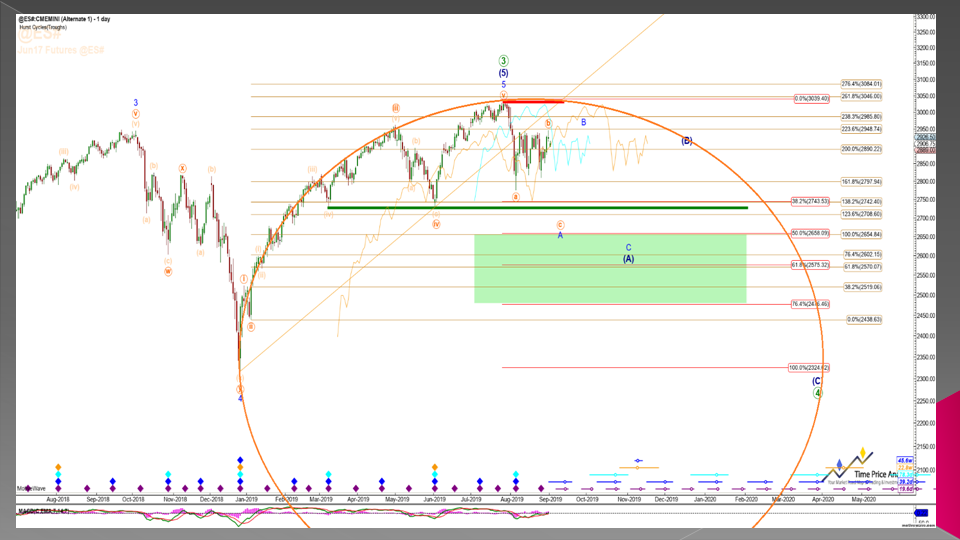
SLIDE 27
... and a consolidation diamond pattern.
All of which are tracked in real time on MATASII.com.
SLIDE 28
We don't have time in this video to describe all the factors that go into our Macro Analytics Primary, Secondary and Tertiary Trend analysis but I would like to quickly show some of these charts to you to give you an idea of the support behind our conclusions regarding the upcoming correction. Shown here is one of our Primary Trend charts for the S&P 500 showing the red ellipse.
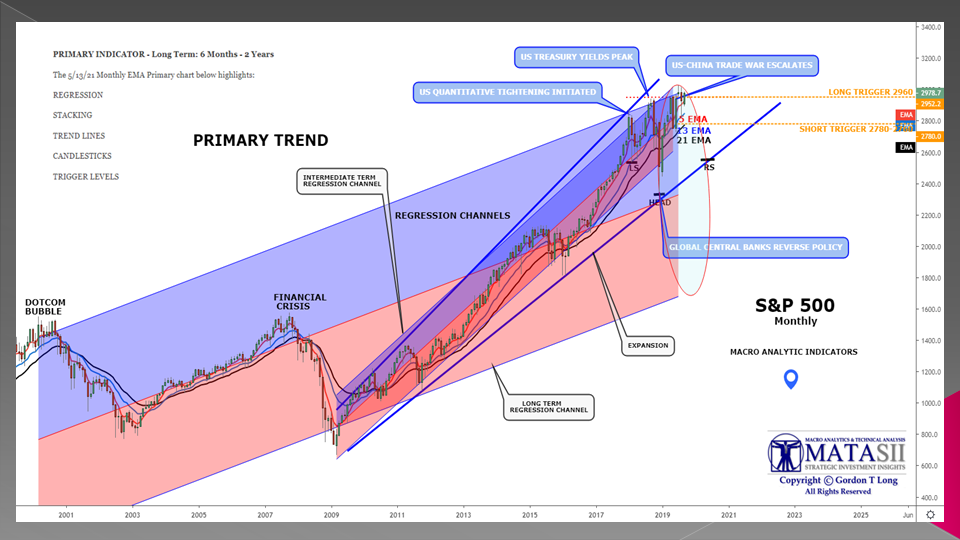
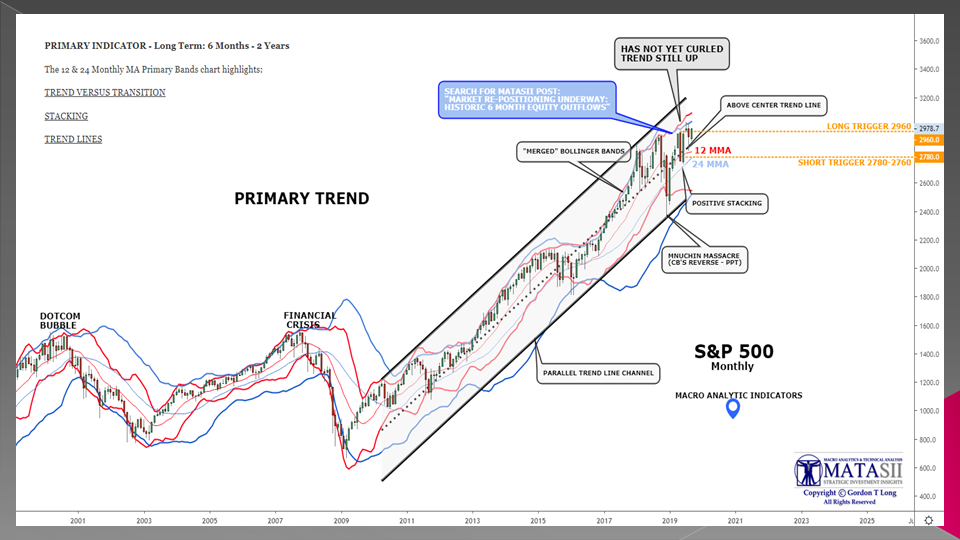
SLIDE 29
Our second Primary Trend chart also suggests the longer term trend is still up and will likely continue to be after the correction is complete.
SLIDE 30
Our last S&P 500 Macro Analytic chart update on our site we showed this particular Secondary Trend chart
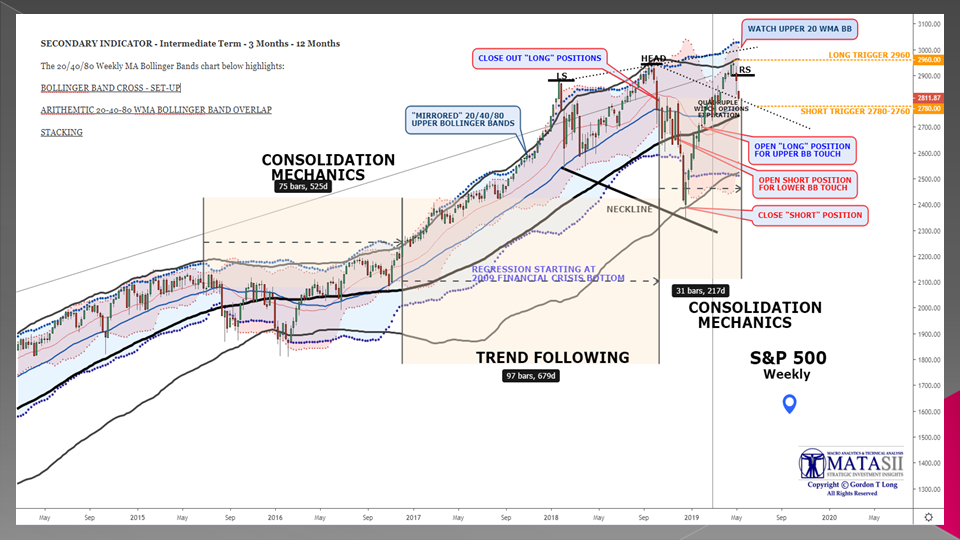
SLIDE 31
The latest update of that chart is shown here which strongly suggests our forecast has a high probability of occurring.
SLIDE 32
Another Secondary Trend chart analysis further confirms this with the proprietary MATA Momentum indicator shown here on the bottom panel in orange.

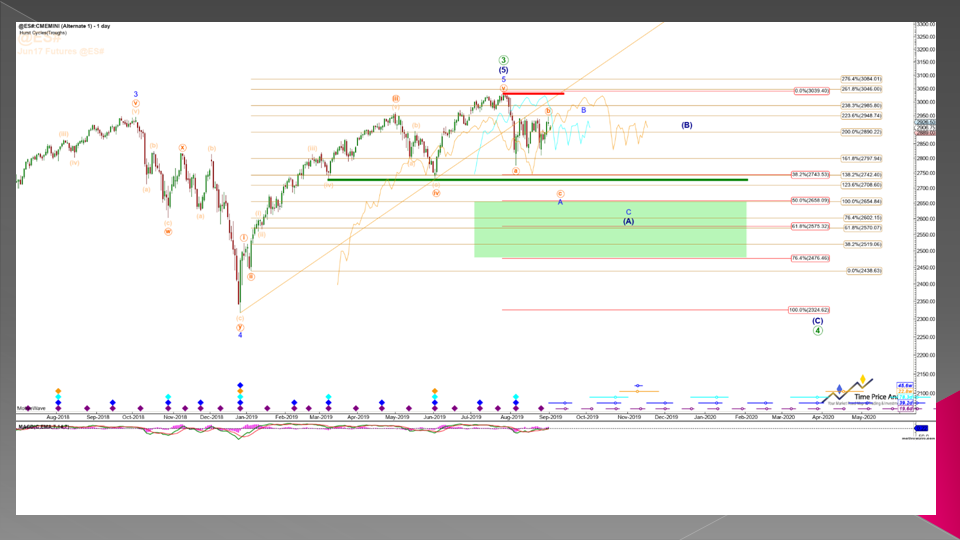
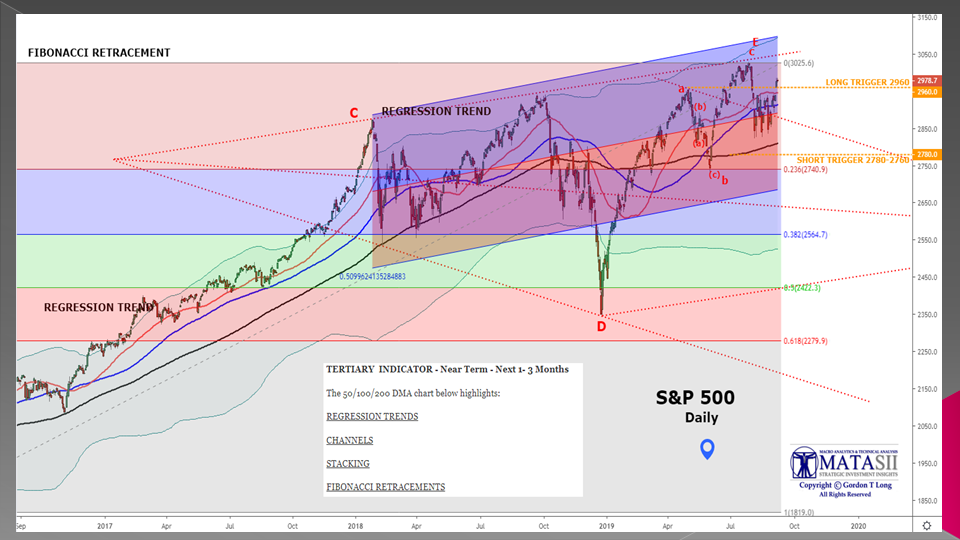
SLIDE 33
Our Tertiary Trend indicators, one of which is shown here, support what we consider the 'measured potential' of the correction.
SLIDE 34
That correction is shown here where open gaps still need to be filled.
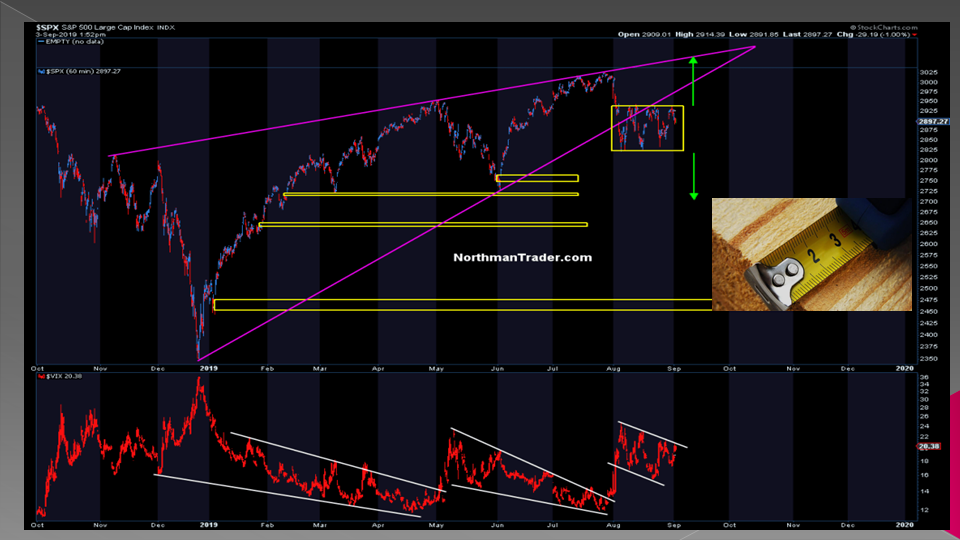
SLIDE 35
The correction is likely to be over by early in year beginning 2020.
I apologize for moving through a lot of these charts too fast and therefore encourage you go to the MATASII subscribers site for the granularity you are likely looking for.
All the narrative detail for the Primary, Secondary and Tertiary Macro Analytics Trend analysis can be found there in the subscribers section.

SLIDE 36
As I always remind you in these videos, remember politicians and Central Banks will print the money to solve any and all problems. That is unfortunately the system we are operating in. This will continue until such time as no one will take the money or it is of no value.
That day is still in the future so take advantage of the opportunities as they currently exist.
Investing is always easier when you know with relative certainty how the powers to be will react. Your chances of success go up dramatically.
The powers to be are now effectively trapped by policies of unsound money and fiat currencies.

SLIDE 37
I would like take a moment as a reminder: DO NO NOT TRADE FROM ANY OF THESE SLIDES - they are for educational and discussions purposes ONLY.
Thank you for listening and until next month may 2019 be an outstanding investment year for you and your family.