IN-DEPTH: TRANSCRIPTION - MAY - ENDING DIAGONALS EVERYWHERE!
COVER

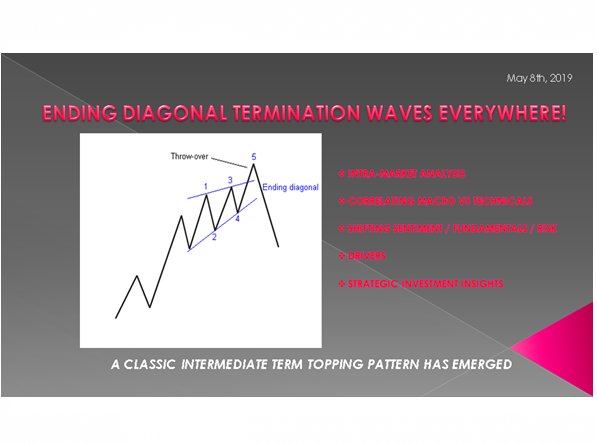
AGENDA

SLIDE 5 - INTRA-MARKET SIGNALS
I would like to begin this session as I did last month with a discussion regarding the Intra-Market signals .
Let's again start with the currency market and specifically the US Dollar.
As you have seen before I show here the dollar chart we drew not long after the Financial Crisis. This Elliptical Theory chart has turned out to be an extraordinary chart in calling both the bottom in the US$ and the time frame of its expected rally.
You can see it hit our HPTZ (circles located on the right side of the Ellipses ring).
We are now however, at a very critical time regarding the dollar and whether it follows the Ellipse higher or trades within the red channel. On a more detailed view which you can find on the MATASII site you will see we have broken outside the Ellipse with significant overhead resistance not much higher than we are presently trading.

SLIDE 6
This US$ chart shows that we appear to be within an "Ending Diagonal" pattern pointing us towards a "Right Shoulder" termination in 2019..... before heading lower into the Presidential Election Cycle year.
Quantitative Tightening and higher rates have been good for the dollar since they were initiated but both are being reversed since the Fed recently changed policy direction guidance.
There appears to be more lift left in the US dollar (likely a "fight to safety" shock of some sort - Brexit? a Geo-Political event?), before heading lower.

SLIDE 7
The Bond Market as represented by the 10 Year US Treasury is also signaling a possible "Right Shoulder" in 2019. This TNX chart of the 10 Year's Yield, which we initiated in 2016, has also turned out to be very accurate and you have seen it many times as it has unfolded.
We are not sure we have quite found the bottom in this drop in yields but currently do see 10 Year yields rising towards 2.80-3.05% later in 2019.
We noted that recently Morgan Stanley also changed their year end yield target to 2.8%.
I need to add that neither of us are in the mainstream on this outlook.

SLIDE 8
A Boundary Condition Ratio that has helped us significantly over the years is the SPX: TNX ratio plotted on a log scale.
We see yet another Head & Shoulders here, within a clearly emerging "Doomed Top".
The ratio suggests for this to occur we need to see yields fall a little further while equities continue to strengthen a little further - at least in the short to intermediate term in 2019.
We see this to be the case in the 10Y US Treasury but what about equities?

SLIDE 9
This is another chart you have seen many times as it has unfolded. As you not doubt recall we called the bounce to the right shoulder prior to the bottom reversal shown at the bottom of the chart.
Though we called for a "W" bottom versus a "V" we were fairly accurate on the level we would reach to achieve our foretasted "Right Shoulder". We took less time than we predicted and also broke the "black" trend line which we initially felt would contain the lift.
We are watching closely to see whether the "dotted" red line holds - giving us a double top - or whether we lift higher than originally anticipated ... towards the labelled convergence shown by "?" markets.
Concerns this week with an impasse in the Chinese Trade Agreement may trigger a near term consolidation around some of our PHI and Bradly dates - before we head higher when a deal is again rumored to be once again on track. When an actual deal is reached we are likely to see a "Buy on the Rumor -- Sell on the News" event.

SLIDE 10
Shown here is the DJIA ETF or DIA chart we have also had in place since early 2018. The Right Shoulder is higher in the DJIA and this may the final level we see, being a slightly different pattern than the S&P 500.
Time will tell, but you can see why we called 2019 the year of the "Right Shoulder" and that appears to have been a great call. - so far at least.

SLIDE 11
Another chart to watch is Credit as represented by High Yield Bonds. We show here the "JNK" for the higher credit risk Junk bonds.
The year end reversal has been absolutely dramatic. Money has poured back into this higher yield area.
The as yet "unfilled" gaps is something we are watching closely and had troubled us when they weren't filled when the High Yield market appeared to be crashing.
A little more strength would satisfy this chart.
All in all looking across the Intra-Market charts we have a pretty strong case of evidence for a possible "Right Shoulder" correlation.

SLIDE 12 - FUNDAMENTALS
We talked about Valuations last month.
Six companies represent 37% of all the S&P 500’s value creation over the last 5 years:
- Amazon (10.1%),
- Apple (6.5%),
- Facebook (4.7%),
- Google (6.4%),
- Microsoft (7.8%), and
- Netflix (1.8%).
The US stock market, or at least the S&P 500, is inextricably tied to the present and future of disruptive technology.
- Over a third of the S&P’s 44% value accretion in the last 5 years comes down to a handful of now-super cap tech disruptors. Without them, the S&P’s total value would only have compounded annually at 5.0% instead of 7.6%.
- Disruption at global scale can add as much market value as a much larger but old-school business even if the latter is very well-run.
- What will be the source of the S&P’s value creation over the next 5 years (i.e. where is the next $3-5 trillion of market cap coming from)? Here’s how we handicap the odds: 65% chance it will be these same companies. They have the scale and scope to develop the next wave of disruptive technologies and get them to market.
US equity valuations reflect present and future Tech disruption.

SLIDE 13
The salient point from the Q1 Earnings season is that the results have not been bad enough to stop the U.S. stock market from getting back to an all-time high.
- Companies that disappointed were strongly punished (with Google parent company Alphabet the latest and most spectacular example), while those that won the game of massaging expectations gained little reward.
- Companies that missed on both their earnings and sales were punished with a 5.9 percent decline in their shares on average; those that managed a positive surprise on both measures gained only 1.7 percent,
- S&P 500 margins are coming in narrower than they did in the same quarter of last year, and that is the first time this has been true for some years,
- Narrower margins are afflicting virtually every industrial sector.
- Many companies are complaining about higher costs,
- This picture could be consistent with a broad rise in labor costs eating into margins?
- Revenues have not beaten expectations as much as they usually do but overall they still show little or no sign of a global downturn in Q1 earnings,
Where once they could not bring themselves to recommend a sell, now they cannot stomach the notion of predicting that earnings per share will go down

SLIDE 14
- Contrary to popular belief, a deceleration of GDP growth is a very bullish development for US equities at this stage of the US business cycle.
- Slow GDP growth will tend to extend the probable length of the current US economic expansion and the US equity bull market.
- The optimal range of GDP growth for US financial markets at this stage of the US business cycle is probably about 1% to 2%.
James A. Kostohryz recently expanded on this in Seeking Alpha:
At this particular stage of the US business cycle, below-trend GDP growth of 1.0% to 2.0% - to the extent that it stabilizes within this range - will actually maximize the length of the current economic expansion and will most probably increase the length and intensity of the current bull market in US equities. This is one of the most important inferences that should be drawn from the GDP report. The inflation data released in this same report have even greater bullish implications.
We show here the US Business Cycle and the Strategic Window of Favorable Conditions for US Equities

SLIDE 15
I am becoming increasingly concerned about Flows & Liquidity. The Fed's sustained QT measures are still occurring and the cumulative effect is now reverberating through the financial markets.
Money Supply as the primary driver of the market has recently begun to diverge from the equity markets.
It appears that:
- The brief rebound in domestic US money supply growth triggered by repatriation of funds from the euro-dollar market in the wake of last year's tax cuts has by now dissipated,
- Preliminary data indicate that the slowdown in TMS-2 growth continues so far in April - currently the y/y growth rate stands at just 1.7%.
- The continuing slowdown in money supply growth represents a palpable threat to the bubble in asset prices.

SLIDE 16
In our view there are three reasons that Global FDI Flows are falling. One is a "one time" event (which everyone quickly acknowledges as the reason) but the other two are structural.
- The 2017 change to US Tax Incentives for Foreign Repatriation of large amounts of earnings held with foreign affiliates,
- Slowing Global Trade and Economic Growth,
- Slowing rate of growth in Financial Leverage due to a "Unencumbered" Collateral shortage

SLIDE 17
The AAII Investor Sentiment Survey shows that Neutral sentiment saw a sharp decline falling to 39.63% from 46.31%.
That is the largest decline since the final week of 2018 when the market bottomed and a very large portion of investors reported outright bearish sentiment. This time around, the decline in neutral sentiment predominantly went towards the bulls. The percentage of investors reporting an optimistic outlook rose slightly to 39.02% from 33.52%. This is still only modestly above the historical average.
... and away from the Bears. Bearish sentiment also rose 1.2% to 21.3% this week. In the grand scheme of things, though, even with this increase, bearish sentiment still remains at very low levels.

SLIDE 18
The surge once again in shorting volatility tells us how once again the Fed has instilled an unprecedented level of market complacency.
The last time we saw this it resulted in violent market reactions in February 2018 with a traumatic, single one day 1000 point DOW shocker.

SLIDE 19
Small businesses are often said to be the backbone of the United States economy. Many small business owners have already begun their own preparations for the next financial downturn; maybe they know something we aren’t being told by the mainstream media.
According to a new survey by Bank of America Corp, small business owners across the United States are bracing for the next recession.
More than two-thirds of small business owners surveyed by the bank said they had taken steps to prepare for an economic downturn

SLIDE 20 - DRIVERS - CURRENCIES
We have built markets bubbles based on false assumptions that have consequences. Accelerating De-Dollarization will soon be the "grim reaper" of reality! The coming Black Swan is De-Dollarization!
TWO MAJOR FALSE ASSUMPTIONS
- The 1999 repeal of the Glass-Steagall Act of 1933 was in the best interests of the American economy and its citizens through the increased investment of borrowed money.
- What was put aside is the fact that the original act was intended to assure that banks would never again recklessly create loans to the public that could never be repaid.
- The repeal ushered in a period of reckless loans & a mammoth debt bubble
- Quantitative pumped money back into a failing economy. In fact it did not.
- Most of the money that was created through quantitative easing never actually hit the streets. It was simply gobbled up by the banks!
- The pretense was that QE would be used to pay off bad loans, re-energizing the economy. Interestingly, enough money was pumped into the banks through QE1, 2 and 3 to literally write off every mortgage in the country. Had that been done, those cleared of debt would indeed have had the ability to re-invest in the economy.
CONSEQUENCES
1- A GREATER DEPRESSION
2- DEBT BUBBLE
3- VELOCITY OF MONEY
DE-DOLLARIZATION
All that’s required to eliminate the notion and to send the economy into a tailspin is a black swan event.
- Will it be the dumping of treasuries back into the US system, as is now on the increase?
- Will it be the full implementation of CIPS, the Chinese inter-bank payment system?
- Will it be the elimination of the dollar as the petrodollar, as is now underway?

SLIDE 21 - DRIVERS - COMMODITIES

SLIDE 22 - DRIVERS - INFLATION
Meat costs are finally going up, and that’s weighing on a dining industry that’s already reeling from rising minimum wages.
- McDONALDS: McDonald’s Corp. warned investors Tuesday its 2019 commodity costs in the U.S. could rise as much as 3 percent, more than the 1 to 2 percent inflation it had forecast just three months ago.
- BJ RESTAURANTS (MATASII Watch List): Brewhouse chain BJ’s Restaurants Inc.last week said it’s expecting increases in pork prices,
- TEXAS ROADHOUSE (MATASII Watch List): Texas Roadhouse Inc., an American chain specializing in steaks, higher prices are on the menu, with customers paying as much as 3 percent more as it tries to offset rising costs. “That’s going to go a long ways on margins,” said President Scott Colosi.
- YUM CHINA HOLDINGS (KFC): China’s KFC operator Yum China Holdings Inc. said spiking poultry costs will weigh down margins for the rest of the year.

SLIDE 23
We have talked extensively in prior months about the forced inflation occurring in Domestic Services versus Globally manufactured Goods.

SLIDE 24 - PIVOTS & PATTERNS
Last month I focused on 2019 being the year of the Right Shoulder. In that context lets have a look at some patterns that show we are being overrun by Ending Diagonals that are signaling the achievement of the right shoulder or a a double top.
1- $WLSH - A DOUBLE TOP
Here we have the overall market as represented by the Wilshire 5000. It appears to have broken is wedge and we may expect an underside test before heading lower.

SLIDE 25
2- $SPX - A DOUBLE TOP
Here our SPX which we showed earlier shows an ending diagonal having completed a Double Top.

SLIDE 26
3- $NDX - ENDING DIAGONAL AT NEW HIGHS
The NASDAQ also shows the completion of an ending diagonal

SLIDE 27
4- DJIA - HEAD & SHOULDERS
The DJIA shows the completion of the Right Shoulder of a Head and Shoulders with some open gaps that need to be filled.
These charts don't mean we will not see new higher highs! What they do tell us is that we are soon going to see a corrective consolidation at lower levels. How low and how fast will tell us something about the ongoing trend.

SLIDE 28 - OBSERVATIONS
On a separate subject, our Strategic Investment Insights Watch List of over 150 securities gives us some interesting observations that we don't see covered in the mainstream media.
We have seen increasing interest in precious Metals which as you can see on the right side has delivered some strong returns - whether short or long. We are not saying Precious Metals are about to takeoff but rather the manipulation of "paper" gold going on has increased the volatility of key players. Our Technicals are keeping us on the right side of the LONG / SHORT positioning - so far.
We are also seeing changing market thinking and behavior. We don't have time to delve into them in detail but let me say a couple of words on each and save the details for future LONGWaves.

SLIDE 29
The rise of Zombie's & Unicorns is further proof that the markets have disconnected from Fundamentals. The hot players (not too dis-similar to prior to the Dotcom bubble bursting) are being valued differently.
Recent IPO's like Uber and Lift are quite clear in their prospective that profit, both in the short term and long term, are serious concerns. Like Amazon and Tesla it doesn't matter to investors.
They and others are being valued on the basis of the degree of their "Disruptive Technologies". The damage they will do rather than the money they will actually make. Is it hope they will find a way to eventually make money or those trying to protect their established business models and profit "moats" will be forced to take them out and blend into a new business model? Time will tell.

SLIDE 30
We are continuously seeing short squeezes which is typical of Bear market counter rallies. This time however it is by sector. For example we recently reported that we had outsized upward movements in our Auto sector which was heavily shorted. There was no news, just this wave of targeted buying forcing covering before, just as quickly exiting.
We are once again seeing through various measures such as complacency that the Fed is trapped and has instilled in the markets once again the belief that the central bankers have investors backs. Japan's outright and blatant (what I will call) "nationalizing" of the markets heads further evidence to this belief.
There is heavy evidence that the central bankers will soon be forced to cut rates, bring in a new form of QE (likely called QE-for-the-People) and then head towards NIRP. The market seems to acting as though this is a given..

SLIDE 31
We see that the PPT (plunge Protection team) has once again been activated. This was blatant on Monday when the DOW was down 500 points in the pre-market but buying arrived at the US Open. Secretary Mnuchin was rumored to be working the PPT behind the scenes. Our proprietary PPT measure from days gone by showed this to be clearly the case.
The vol complex is showing we may be on the verge of another VIXmaggedon like that last seen in early February 2018.
.. as I said I just wanted to share soom observations in closing without delving into them further.

SLIDE 33 - KEY DATES
Pay particular attention to our Key Dates which we just updated. We have a PHI Date on May 8th and a Bradley Turn Date on May 16th (+ / - a couple of days). it is time for a consolidation which we have not had since this historic rally kicked off the from 2018 year end market lows and the Mnuchin Massacre.

SLIDE 34
As you are fully aware I always end with a reminder that they will print the money to solve these and all problems. It is the only answer politicians will ever agree on.
As these two charts show, both China and Japan already have and continue to.
When the BOJ's estimated aggregate ETF balance totals 29 trillion yen (about quarter trillion dollars) you know it is only a matter of time before other central banks follow suit to keep asset prices from falling.

SLIDE 35
They will print the money to solve any and all problems until such time as no one will take the money or it is of no value.
That day is still in the future so take advantage of the opportunities as they currently exist.
Investing is always easier when you know with relative certainty how the powers to be will react. Your chances of

SLIDE 34
I would like take a moment as a reminder:
DO NO NOT TRADE FROM ANY OF THESE SLIDES - they are for educational and discussions purposes ONLY.
Thank you for listening and until next month may 2019 be an outstanding investment year for you and your family.
I sincerely thank you for listening!

