IN DEPTH - TRANSCRIPTION: THE DISAPPEARING STOCK FLOAT
COVER
AGENDA
SLIDE 5 - THE STOCK FLOAT
The Float is the number of shares actually available for trading.
Float is calculated by subtracting closely held shares -- owned by insiders, employees, the company's Employee Stock Ownership Plan or other major long-term shareholders -- from the total shares outstanding.
This can be difficult to determine and therefore requires and depends on definitions. The public is unaware of how this is determined and generally have to pay service providers for this information.

SLIDE 6
When a firm reduces the number of shares available to trade, then so-called float manipulation can occur.
This is well documented and interestingly one detailed report by the Harvard Business School entitled "“Float Manipulation
& Stock Prices” spelled this out in 2005. We will come back to that 2005 date. They proved with a study of 2000 Japanese firms that the following occurs when the stock float is reduced:
- The price of the stock is often driven up,
- Stock prices are raised significantly when there are differing opinions about the value of shares,
- When risk averse investors have differences of opinion and are short-sale constrained, reductions in the float freeze out pessimistic investors, pushing up prices,
- When the float is released, prices fall.
SLIDE 7 - CHANGING THE RULES
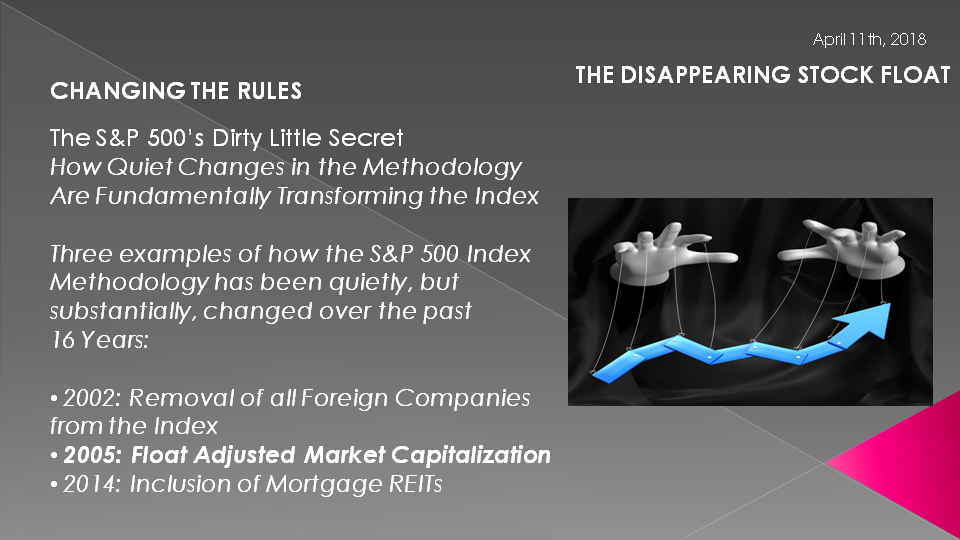
I actual fact this is part of the S&P 500’s 'Dirty Little Secrets" and how quiet changes in the methodology have fundamentally transforming the index
Three examples of how the S&P 500 Index Methodology has been quietly, but substantially, changed over the past 16 Years:
- 2002: Removal of all Foreign Companies from the Index
- 2005: Float Adjusted Market Capitalization (there is that 2005 date)
- 2014: Inclusion of Mortgage REITs
All are interesting changes but we are only focusing on one today.
SLIDE 8
Since 2005, S&P 500 has been float weighted. That is it is a “Float Adjusted Market Capitalization” Index. What does that mean?
When the individual market cap is calculated for a company part of the index, only the outstanding shares that can be freely traded without any restrictions are taken into account.
As we previously mentioned, not all outstanding shares of a company are available for common investors to trade, for example shares held by individuals with access to insider information are under special regulation (another very interesting adjustment that could change the weighting of a stock for big holders and then be fluidly changed back when that circumstance changed because they asserted they no longer had insider info)
To put all this in perspective, the float adjusted value of S&P 500 index in 2016 was around one trillion dollars smaller than the un-adjusted total capitalization.

SLIDE 9
A research report from Horizon Kinetics (PDF) uses Microsoft as an illustration. Had these rules been in effect during the 1990’s, what would it have done for index fund investors?
- When added to the S&P 500, the share price was about $2.41.
- At January 1999, when the stock was $44.75, insiders still owned 31% of the shares.
- By September 1999, near the peak of the “great technology bubble,” when the shares were $47.50 (and when Microsoft’s weight in the S&P 500 exceeded 4%), inside ownership had been reduced to 26%, and by early September 2000, the very threshold of the collapse of that bubble, when the stock was $35, inside ownership had dropped to 19%.
- 13 years later, the shares were lower than that. Whether by fortune or perception, insiders were dramatically reducing their holdings going into a decade-plus period of decline and stagnation.
- What did outsiders do? Had the float-adjusted index weighting method been in place at the time, as insiders sold, such that the float increased, the Index rules would have increased the Microsoft weighting, and mutual funds and other index investors would have been buying more—more of what the insiders were selling.
SLIDE 10
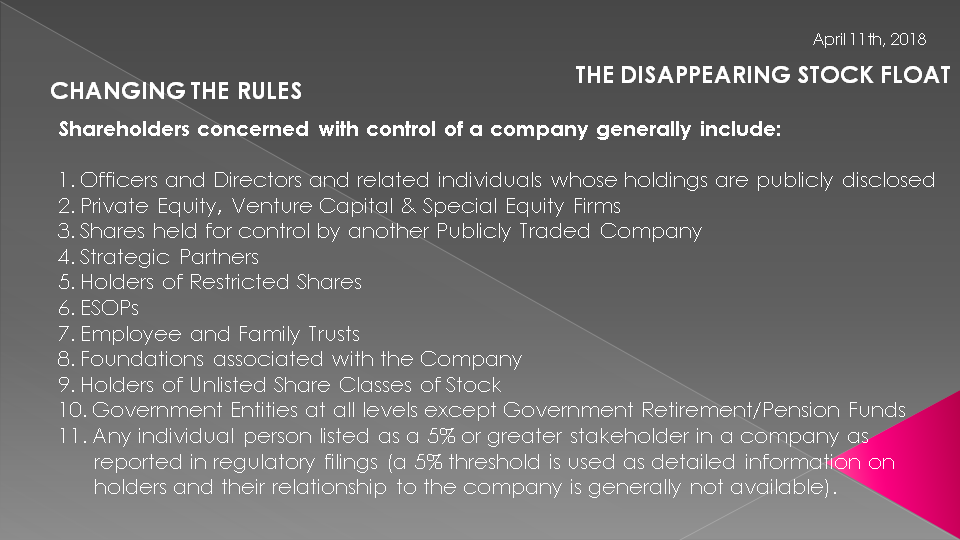
Shareholders concerned with control of a company generally include the folowing:
- Officers and Directors and related individuals whose holdings are publicly disclosed
- Private Equity, Venture Capital & Special Equity Firms
- 3. Shares held for control by another Publicly Traded Company
- 4. Strategic Partners
- 5. Holders of Restricted Shares
- 6. ESOPs
- 7. Employee and Family Trusts
- 8. Foundations associated with the Company
- 9. Holders of Unlisted Share Classes of Stock
- 10. Government Entities at all levels except Government Retirement/Pension Funds
- 11. Any individual person listed as a 5% or greater stakeholder in a company as reported in regulatory filings (a 5% threshold is used as detailed information on holders and their relationship to the company is generally not available).
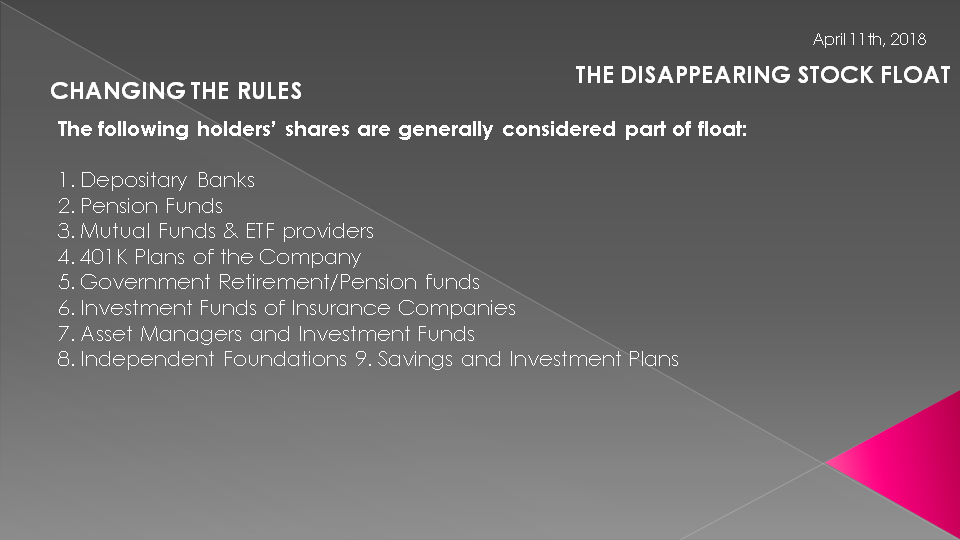
SLIDE 11
Additionally, the following holders’ shares are generally considered part of the control block:
- Depositary Banks
- Pension Funds
- Mutual Funds & ETF providers
- 401K Plans of the Company
- Government Retirement/Pension funds
- Investment Funds of Insurance Companies
- Asset Managers and Investment Funds
- Independent Foundations
- 9. Savings and Investment Plans
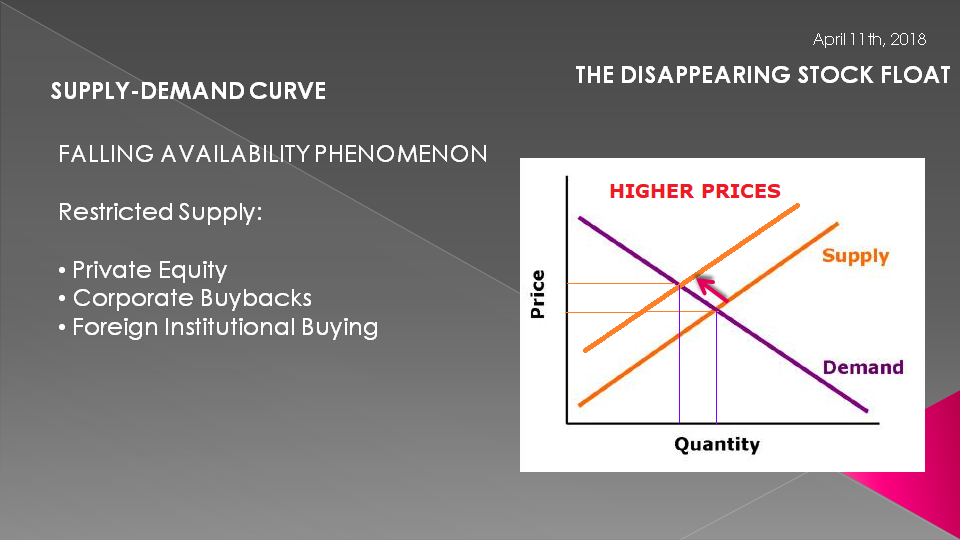
SLIDE 12 - SUPPLY / DEMAND
I know a lot of you hated this back in scholl but it important to revisit the well proven Supply-Demand Curve.
When you have restricted supply or supply is reduced it moves the "S", the Supply Curve to the left - as the arrow shows. This means Price would be expected to rise with the same amount of demand. We will soon show you exactly how reduced supply occurs through Private Equity, Buybacks and Foreign Buying with regards to the Float Adjusted Market Capitalization weighting.
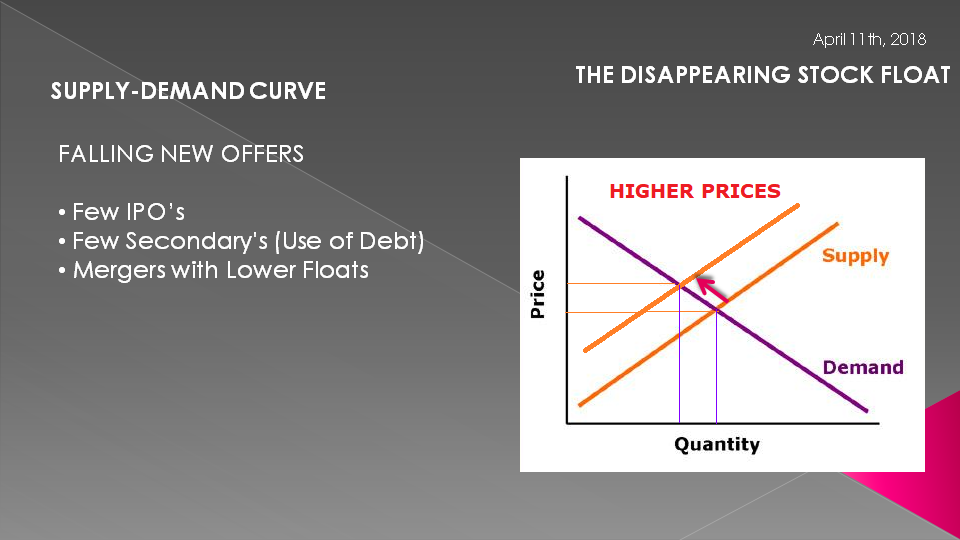
SLIDE 13
Though I haven't got time today to talk about it, a dramatic reduction in IPO's (likely associated with the predatory Sarbanes Oxley legislation), fewer secondaries stock offering (as a result of corporations using bond debt instead) and increased M&A over the last decade have also additionally contributed to a shrinking stock float.
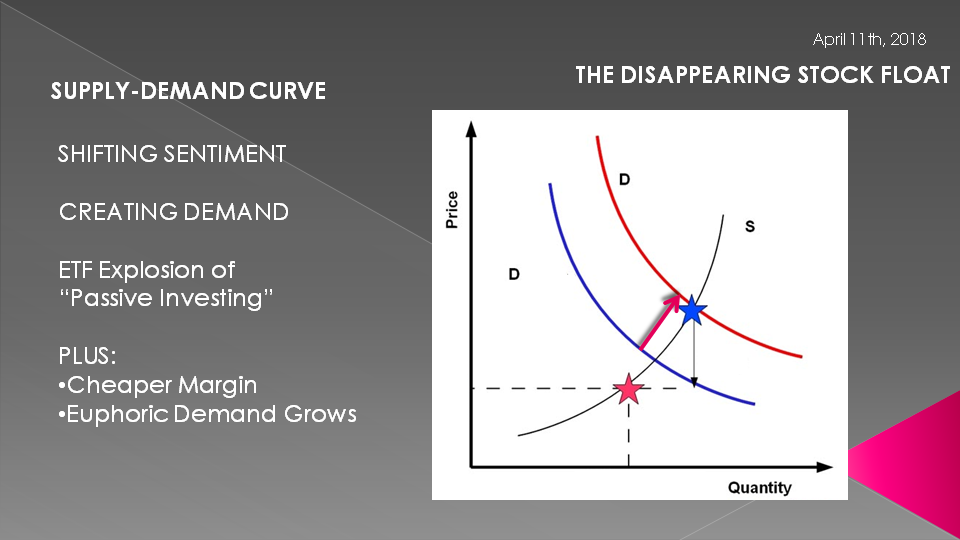
SLIDE 14
So far our Supply-Demand have been about Supply. But demand has certainly been contributing since we just experienced an unprecedented Bull Market since the advent of also unprecedented Monetary Policy associated with QE & ZIRP. Cheaper margin and euphoric investor demand growth has have no doubt pushed on demand but critically important is the explosion in Passive ETF buying. These ETF are dominated by holdings associated with the major Float Adjusted Market Capitalization Indexes.
They feed on themselves pushing the demand curve to the right - also pushing prices up.
I think you can see what is going on here!! Don't you wish you were taking your Microeconomics 101 course today - you could really challenge your prof! Unless he of course is out trading the market with your inflated tuition - sorry - I digress!
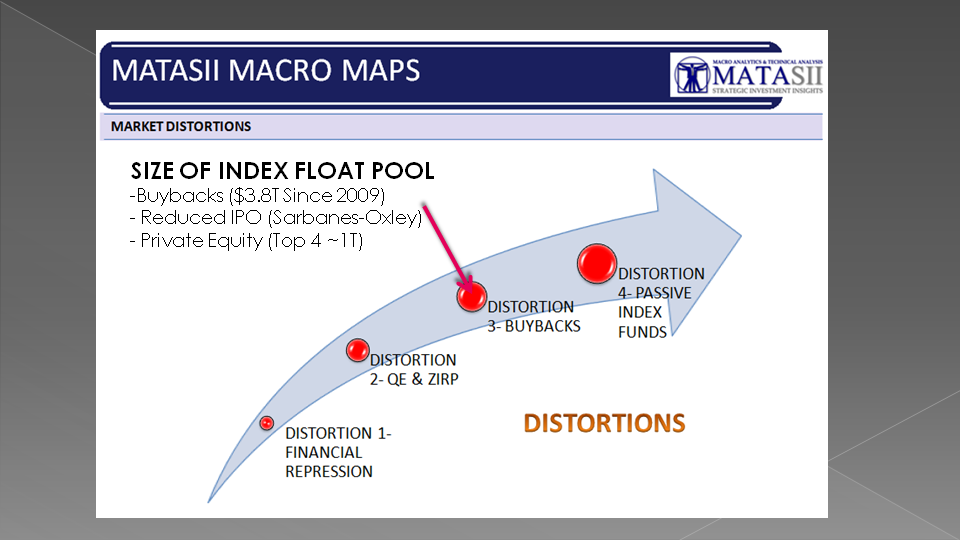
SLIDE 15
In a previous video where I outlined a reflexive Cycle we have creatred, I showed this slide regarding the major distortions which have been driving the market. Buybacks are up $3.8T since 2009 while Private Equity of the Top 4 Priavate Equity firms are now above $1T in assets!
SLIDE 16 - FOUR PHENOMENON
We have four phenomenons now working to capitalize on this Stock Float Opportunity - whether by happenstance or by strategy.
I think it is the later because of the dramatic growth in corporate debt, degree of leverage these players are willing to assume and the dramatic growth in Zombie corporations (which I am also addressing in other subscriber videos for you).

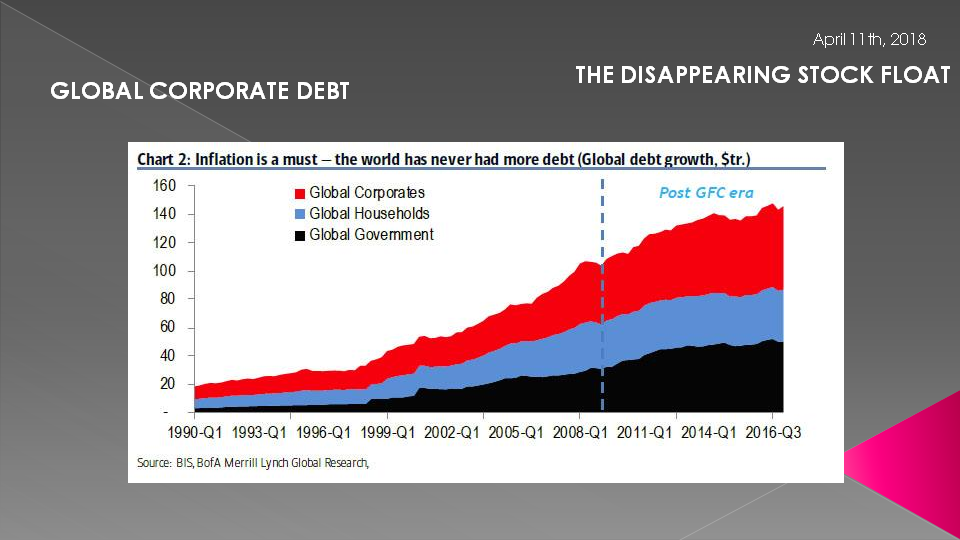
SLIDE 17 - GLOBAL CORPORATE DEBT
Just look at this chart. We all talk about government debt and household debt (and it is massive) but it a relatively contained compared to Global Corporate Debt shown here in red.
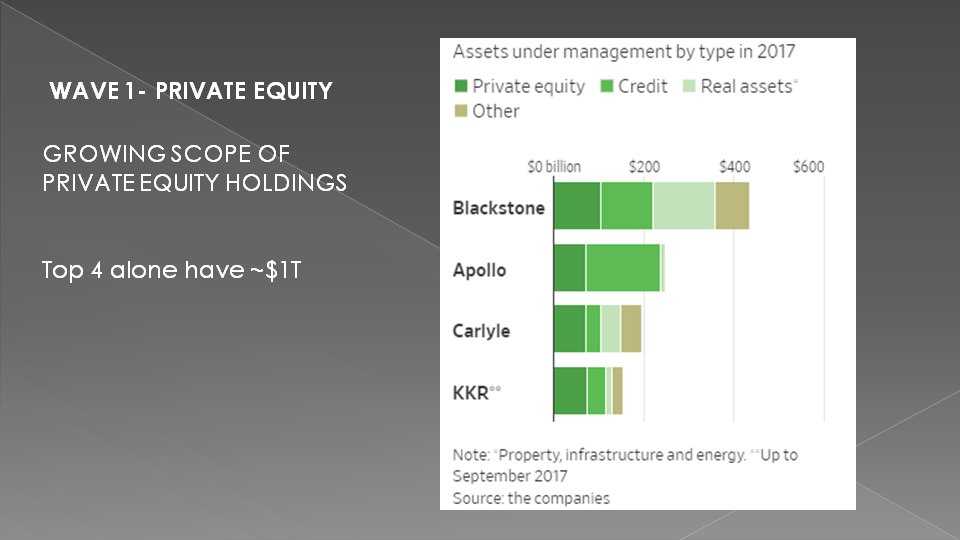
SLIDE 18 - WAVE 1 PRIVATE EQUITY
Let's just take a quick look at Private Equity. I mentioned the top four US PE firms had over $1T in assets alone. This is up dramatically in the last 10 years.
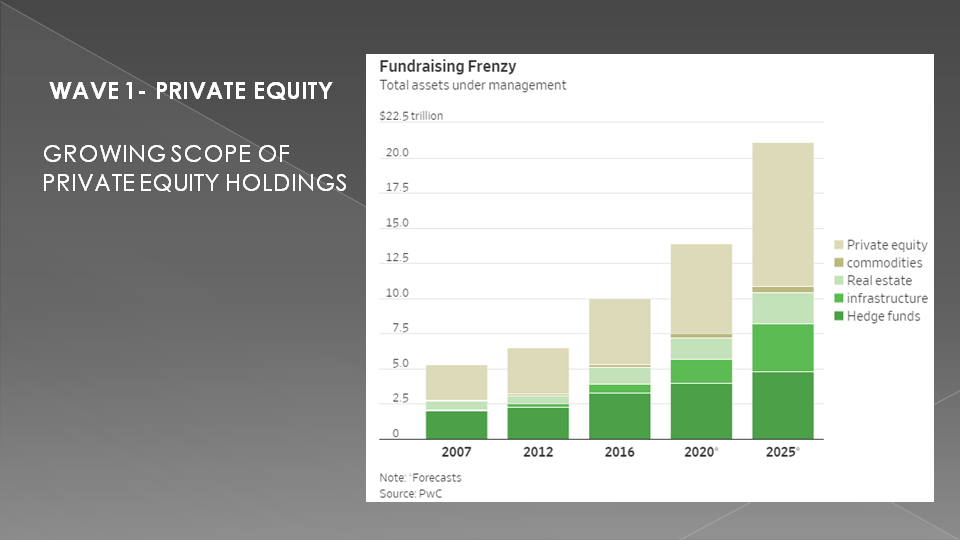
SLIDE 19
Shown here in tan you can see that the growth is going exponentially! Investors are clamoring to get in!
What is their strategy? One thing we do know is they don't start new companies but rather buy existing public companies, leverage them up with debt, merger them or other strategies that are stock price oriented. Recall, that their shares are those removed from the float - of course until they are sold. Meanwhile as they hold them and their stock goes up they have more collateral with which to increase total buying leverage.
It must be a wonderful ride for them!!
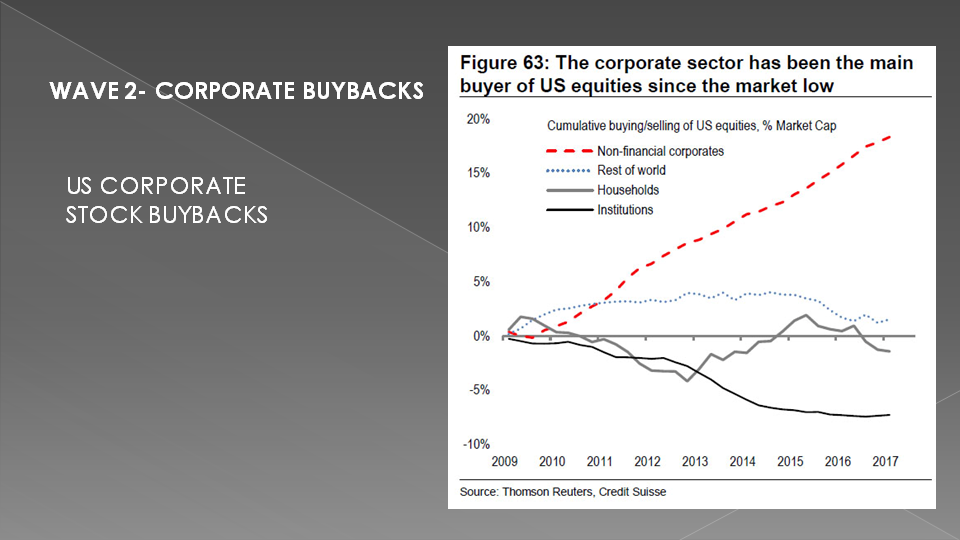
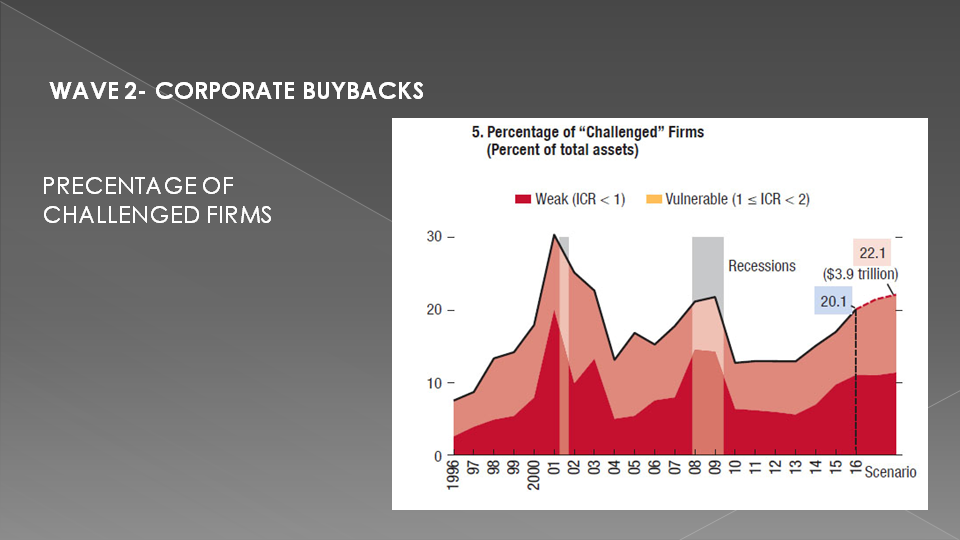
SLIDE 20 - WAVE 2 CORPORATE BUYBACKS
We have talked almost endlessly over the last 6-7 years about the degree of stock buybacks occurring. It is now well above the $3.8T shown here - and climbing.

SLIDE 21
The corporate sector has been the main and dominant buyer of US Equities since the market low. Nothing even comes close.
This market has been overbought for so long that few believed in it any longer and exited. But price insensitive corporations didn't. Why? They aren't stupid and clearly must have a strategy.
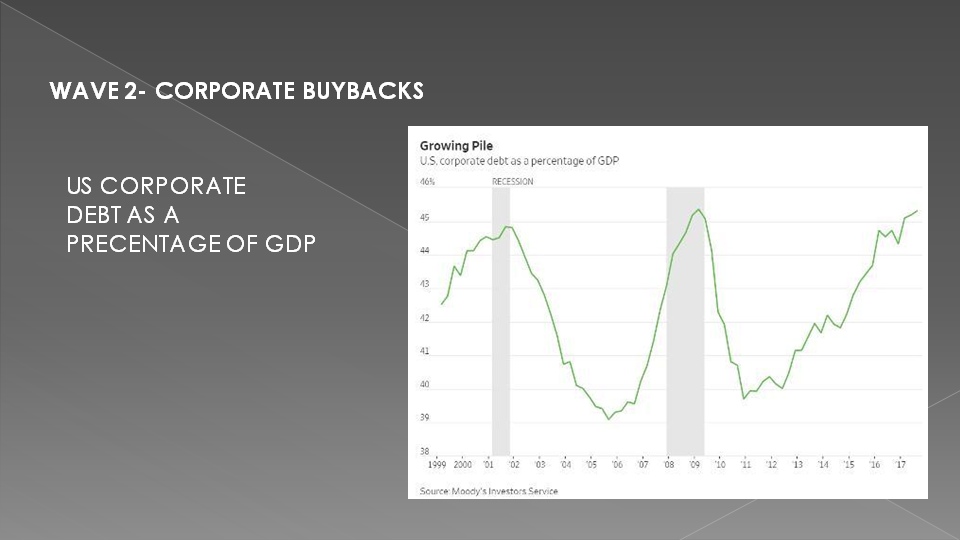
SLIDE 22
US Corporate Debt alone is now at over 45% of US GDP. How long can it be sustained. There cashflows are already in peril as well as the credit ratings.
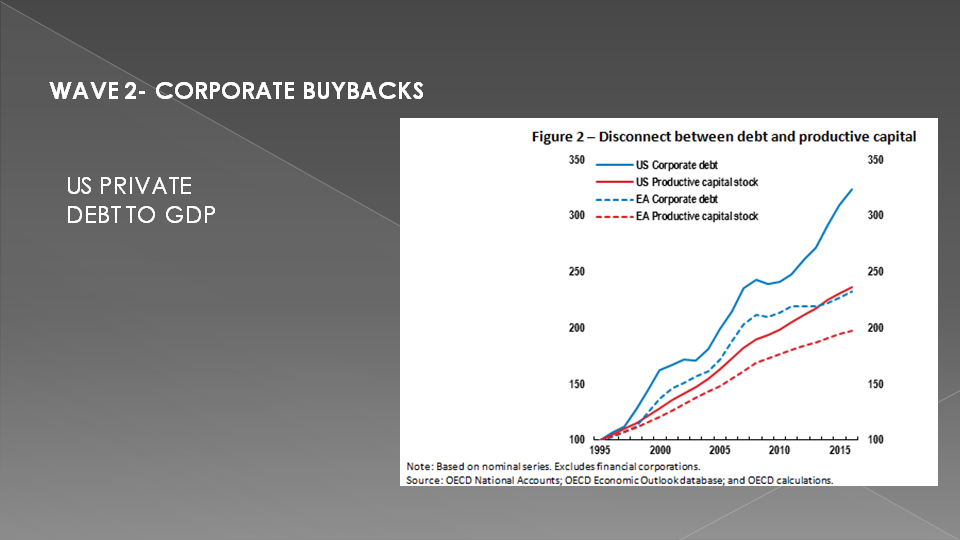
SLIDE 23
Clearly the disconnect between their debt and productive capital stock doesn't bode well for the future.
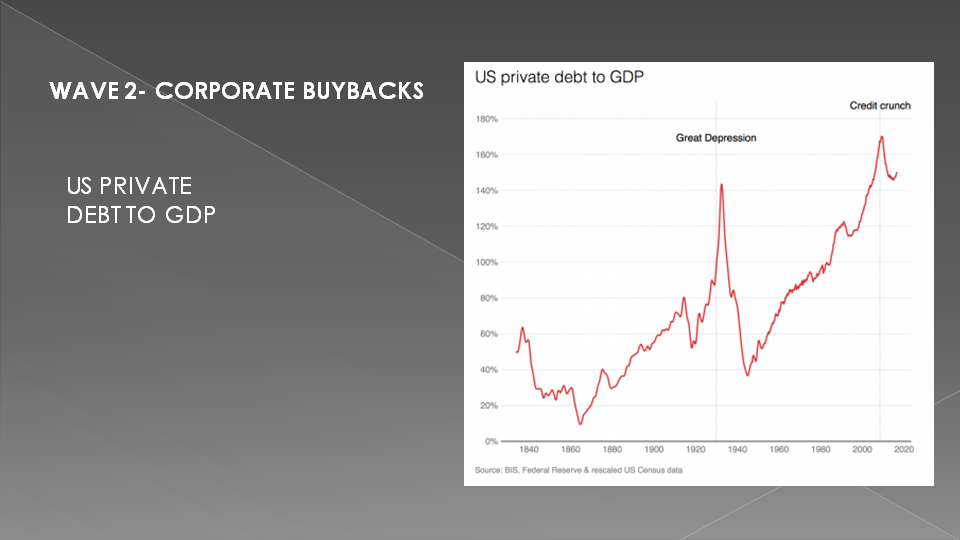
SLIDE 24
It is extremely troubling when consumers and corporations both have extreme levels of debt because they both depend on each other - either for employment or profits.
SLIDE 25
The problem of debt payment levels versus cash flow and profits is becoming a global issue. Whether Zombie corporations or "Challenged" firms the number are once again worrying! We will have more about this again in the upcoming UnderTheLens subscriber video.
SLIDE 26
The third phenomenon is the amount of Foreign Direct Investment that has been flowing to the US. The US averaged $24.3T from 1994 until last year. It reached an all time high of $47.5T in the fourth quarter of 2014 as the post GFC US Stock market rally began to accelerate with massive central bank liquidity injections.

SLIDE 27 - WAVE 3 FOREIGN CAPITAL FLOWS
The fourth phenomenon is the growth in ETFs. Global ETF assets could reach $7.6T by the end of 2020. This is equivalent to a CAGR of ~18% of which 13-14% will come from net new inflows. This will dramatically push that Demand Curve to the right and prices up - all else staying the same!

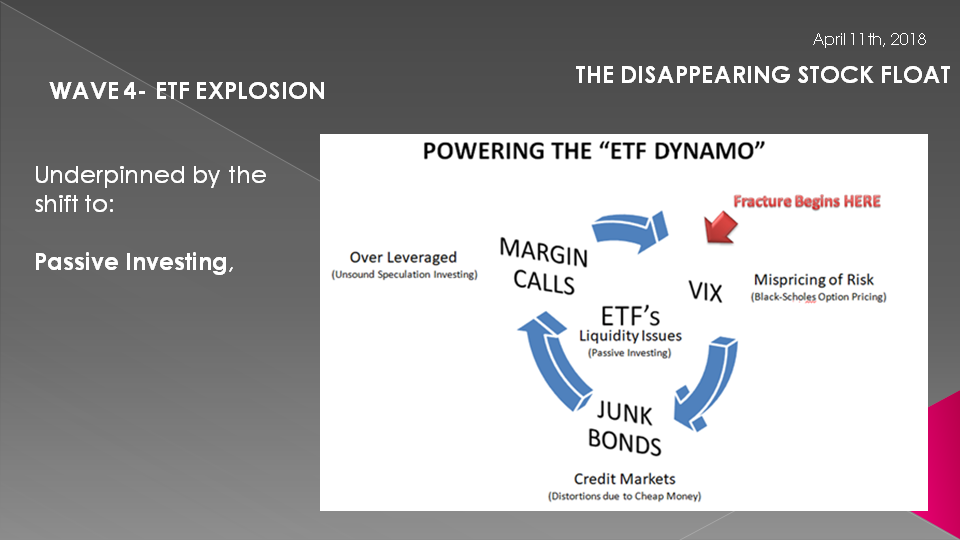
SLIDE 28 - WAVE 4 ETF EXPLOSION
Of course all else may not stay the same. Our look has been in the rear view mirror.
This ETF Dynamo could easily reverse and adjusted a highly over-leveraged financial system.
Too many sellers as a mouse click can do with an ETF basket would dramatically and almost instantaneously change the supply dynamic to massive over-supply.
I will leave it to you to deceide what lies ahead. The only thing I am certain about is....
SLIDE 29
....
they will print the money to solve any and all problems until such time as no one will take the money or it is of no value.
That day is still in the future so take advantage of the opportunities as they currently exist. Investing is always easier when you know with relative certainty how the powers to be will react. Your chances of success go up dramatically.