IN-DEPTH: TRANSCRIPTION - THE GLOBAL SUPPLY-DEMAND PROBLEM
COVER
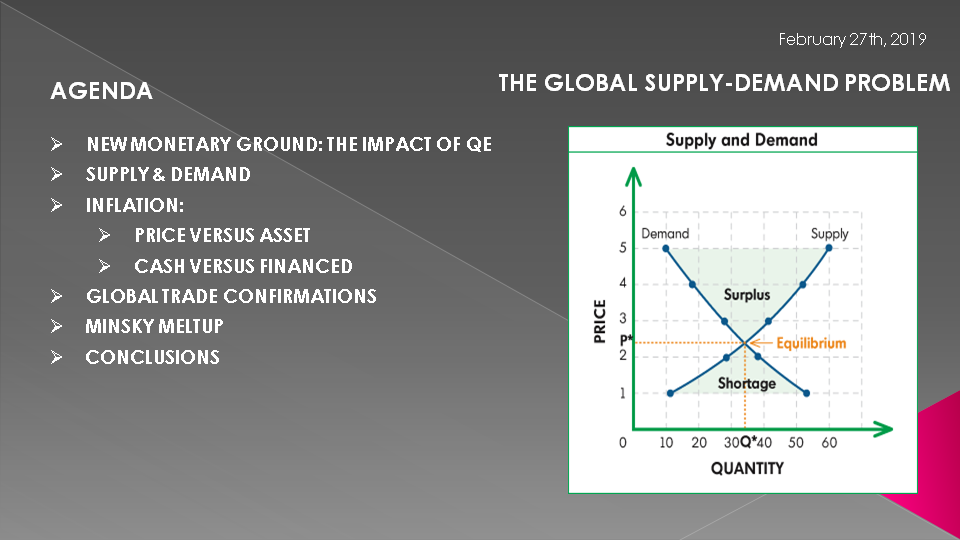
AGENDA
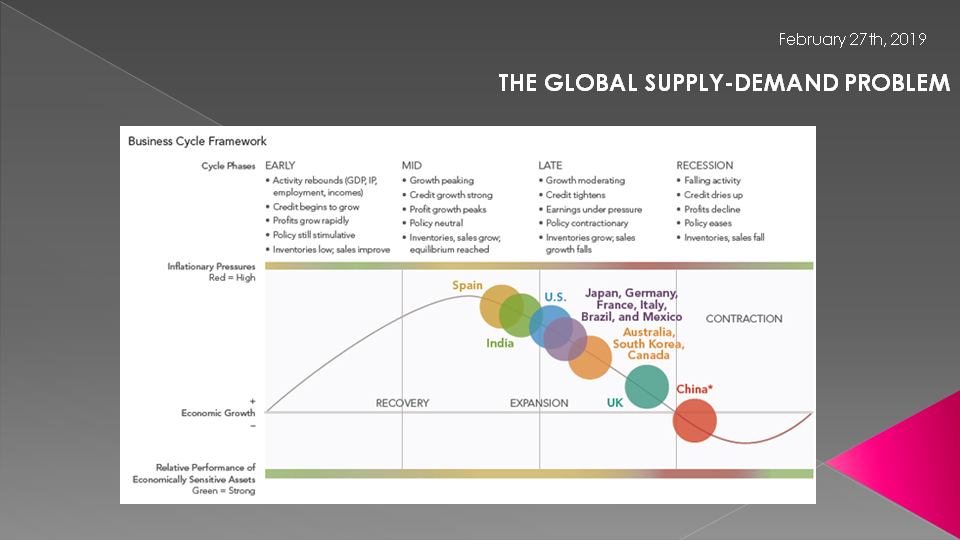
SLIDE 5 - GLOBAL BUSINESS / CREDIT CYCLE
We have discussed various Economic Cycles from a number of perspectives in previous UnderTheLens videos. Globalization has had a profound on all sovereign Business, Credit and Market Cycles.
As we see here, presently we are witnessing China leading Europe, which is leading the US in the late stage business cycle downturn. The US is lagging and by all media accounts is still the world's best performing economy, though that is deteriorating rapidly.
The question is why is this? If money & credit moves globally in a "flicker" of a computer screen, why such significant differences?
Are different economies reacting differently because of inherently different structural impediments or is there something more going on in our new Globalized Economy?
Let's spend some time exploring this to see if we can draw some investment insights.
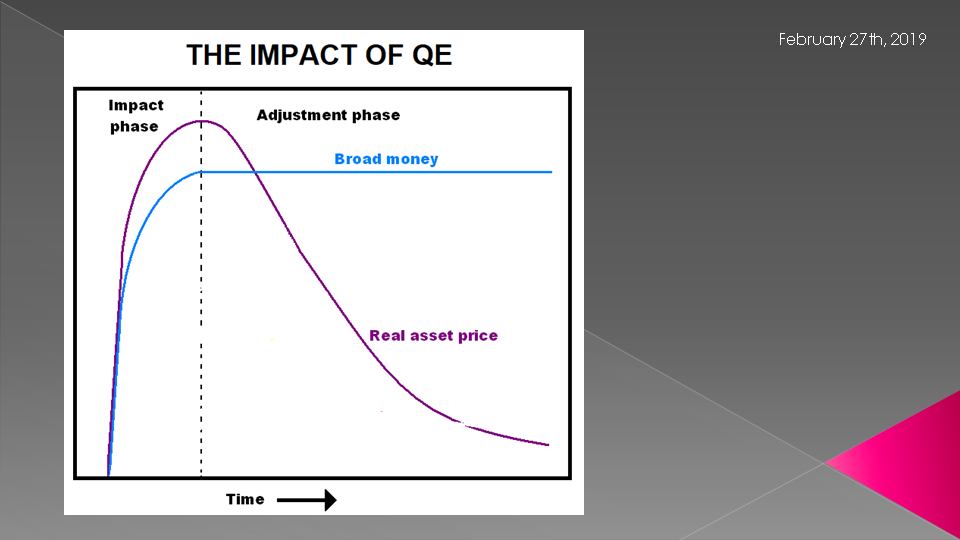
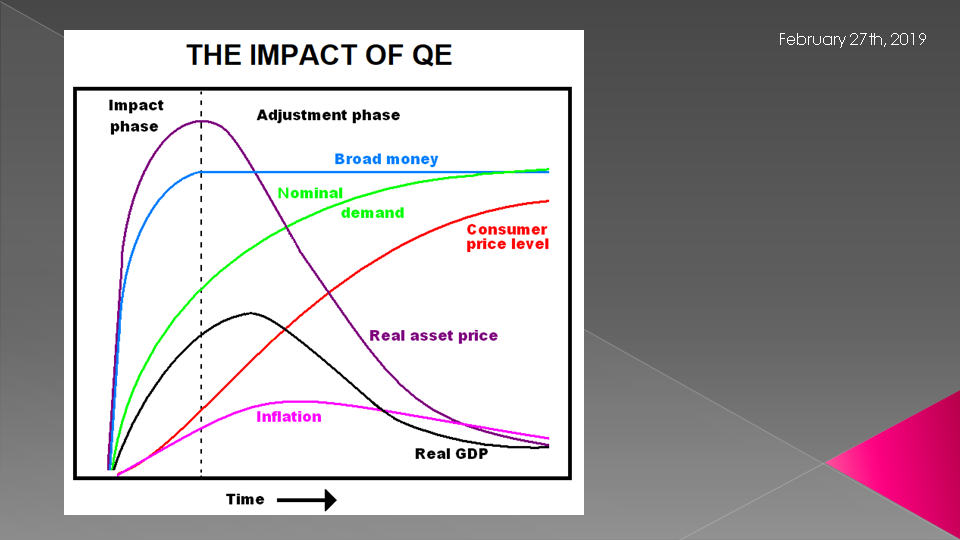
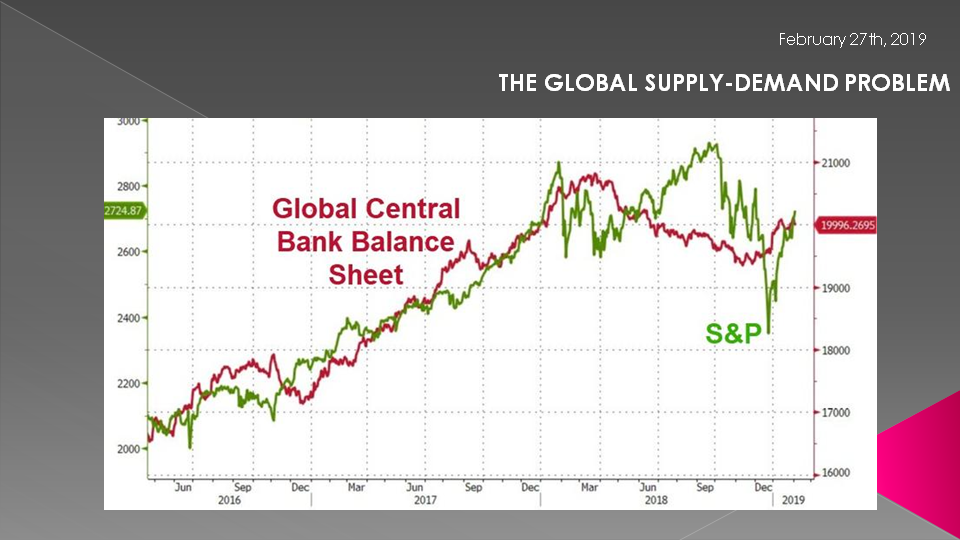
SLIDE 6 - IMPACT OF QE
Let's start with the most significant economic driver over the last decade that has been impacting the global economy - that is Quantitative Easing.
QE has come in different forms - whether the Federal Reserves version, BOJ's, ECB's PBOC etc. The world's central banks jumped on this new and never previously tested Monetary policy in an almost stampede fashion. Though Japan had been using it for some time there was certainly no proof of success from it. Matter of fact the proof was quite the opposite as Japan suffered more than a lost decade of stagnation.
It is important to recognize in this chart we are not considering QT (Quantitative Tightening) or the reduction of the broad money supply (shown in blue) nor a steady increasing amount of new cumulative QE. Just applied and held in place.
QT now appears to be about to soon stop in Q4 in the US and the later (more easing) appears to have taken off again in increasing numbers of global central banks and QE "4" is likely to be seen.
Also, we are only now beginning to see hints of real Asset price weakness with the central banks reacting immediately.
I think if we examine this chart further we will see why.
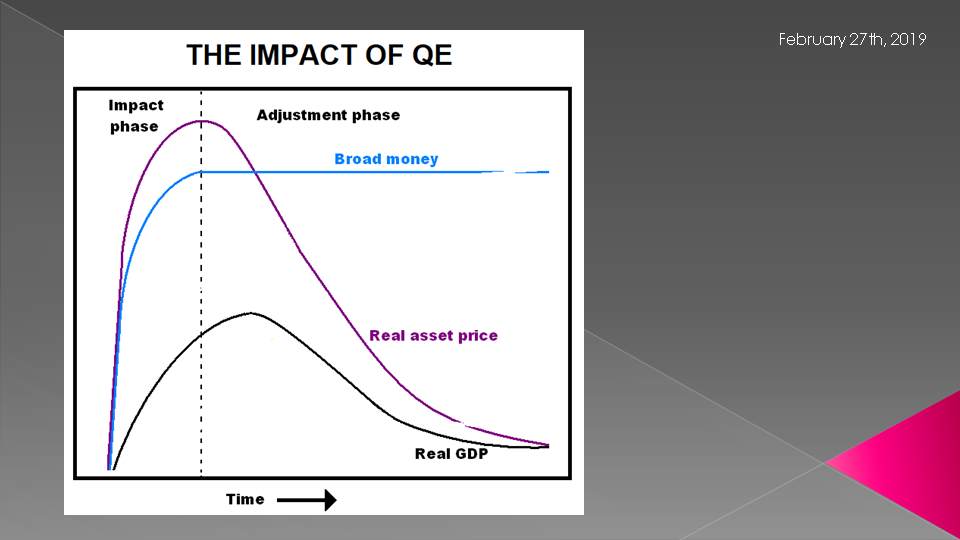
SLIDE 7
We have already witnessed a significant reduction in global GDP with the IMF, OECD and World Bank all warning and taking down their global growth forecasts - almost monthly.
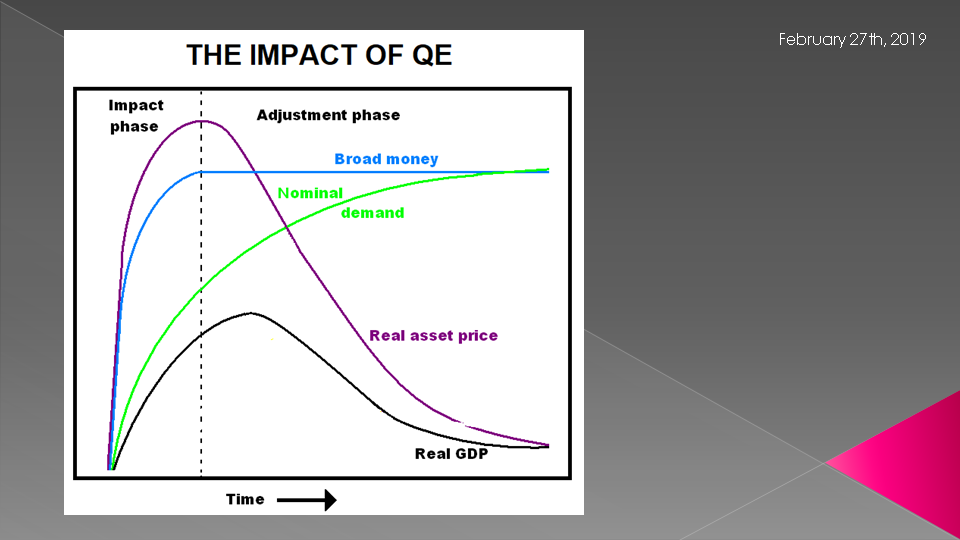
SLIDE 8
Theoretically most of the Nominal Demand gains from QE should have already occurred and beginning to taper off and maintain a higher level associated with increased Money Supply.
However this may not be the case, especially when we consider that the Velocity of Money almost everywhere continues to fall.
SLIDE 9
We are seeing Consumer Price levels increase at the grocery store and most of our daily expenses but not across the board - it seems confusing when it comes to consumers prices.
Some seem to be going through the roof like education, healthcare, rental housing, new car prices etc but others have up until recently seemed impervious to inflation and in fact seeing disinflation or even outright deflationary characteristics.
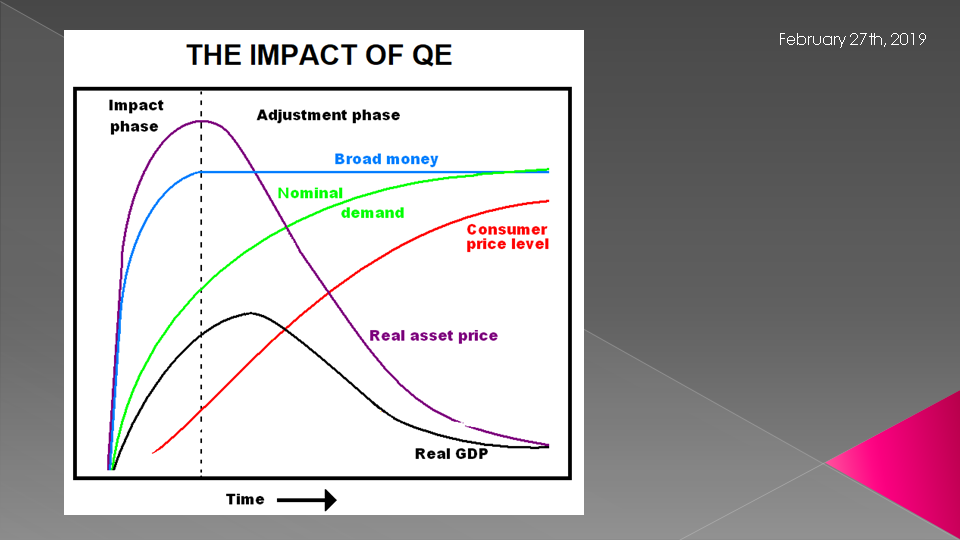
SLIDE 10
Inflation (shown here in pink) at the bottom, is definitely not a single line as shown but according to government numbers and the media reporting it is too low and most central banks are frustrated that they are unable to achieve their 2% inflation targets.
Why such confusion?
A quick study of John William's "Shadowstats" web site would help the central bank academics & their recently minted Phd staff in making this much clearer to them - but I digress slightly.
Lets just stick with what the mainstream would agree with for the moment.
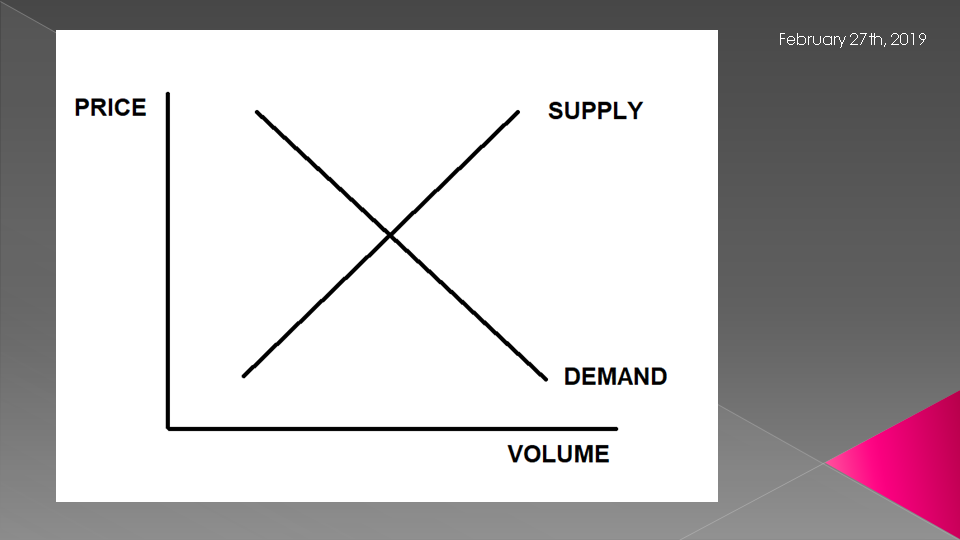
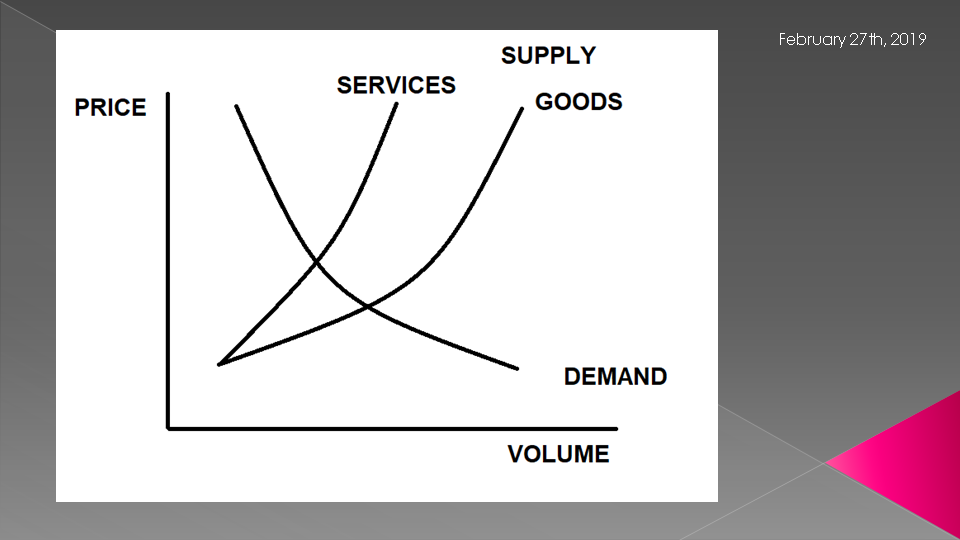
SLIDE 11
Many of you I am sure hoped you would never see another Supply-Demand Diagram after you left college. I will therefore keep this extremely simple and therefore have even made our lines straight - not curved.
You will no doubt recall that basic Price Theory suggest that Demand volumes traditionally increase when Price decreases. Conversely, Supply normally increases when higher prices can taken from the market by what we now call the Supply Chain.
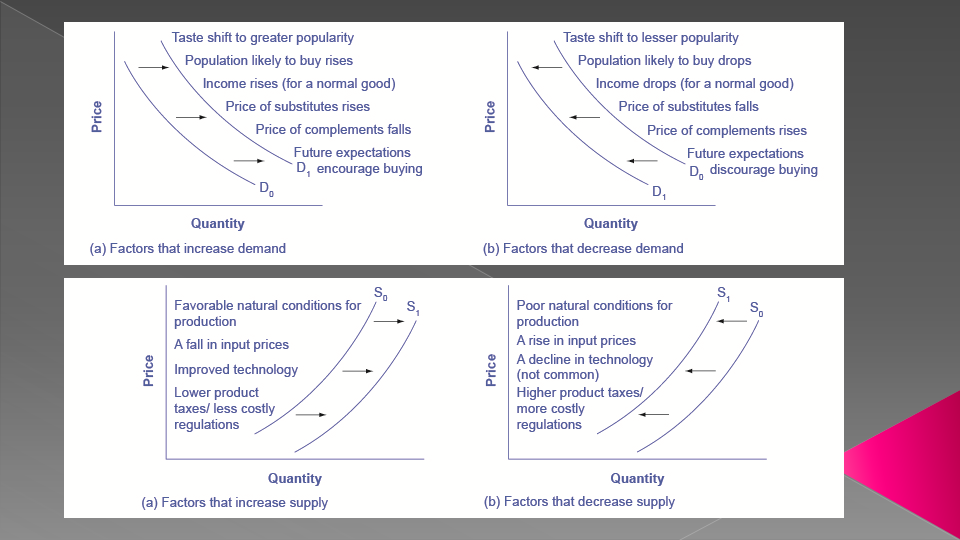
SLIDE 12
A lot of things happen when Supply and Demand changes.
One of the most profound changes over the last decade to both Supply and Demand has been QE and it's resulting change in the cost of money, the pricing of risk and availability of credit for consumers, corporation and and government transfer payments.
I and my associate Richard Duncan have talked for years how profound the move from Capitalism to Creditism has been, yet I cannot find one book on the possible resulting shifts of aggregated Global Supply-Demand curves.
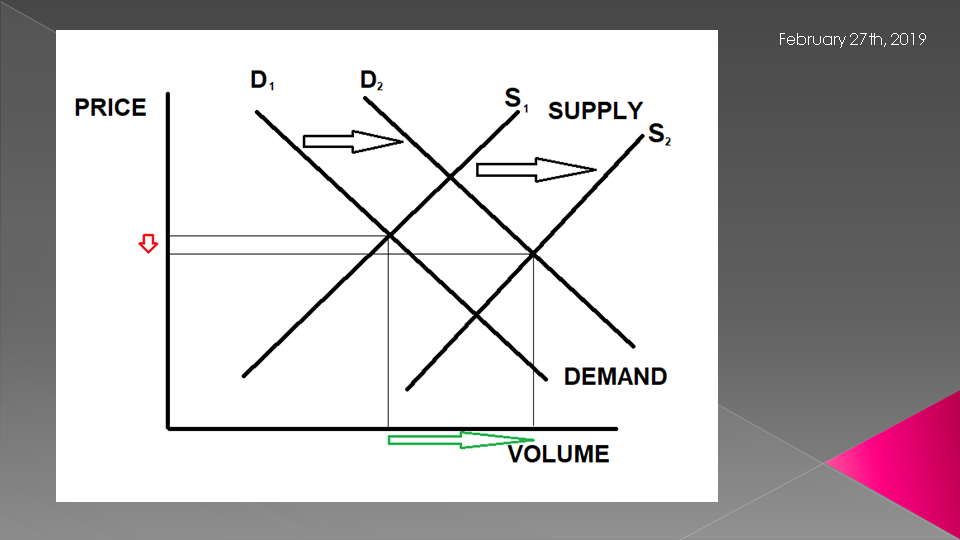
SLIDE 13
In the most simplistic form Global QE significantly increased both Demand and Supply.
Cheap money not only allowed Consumers to buy more through credit but allowed global supply chains to explode in both size and cope. Supply growth far outstripped Demand growth as every corporate Power-Point presentation showed them growing through the increasing capture of market share.
SLIDE 14
Unfortunately there are two central problems here:
1- The Demand created is most fundamentally future demand brought forward. You didn't have to save to get what you wanted - you could get it now. This would suggest there is a gigantic demand hole that has been created unless the powers to be can create new demand? Would more easy money actually achieve this? How cheap would money have to be to sustain and push demand higher?
2- Maybe even more profound is the increase in Supply. Even before a slowing in Demand, Global Suppliers have already been facing a global trade war, a lack of pricing power and the impact of growing numbers of "Zombie" Corporations cutting prices to stay alive and walking. The Bank of International Settlements reports that 20% of global corporations are now Zombie Corporations. That is their profits or EBITDA can't match even their historically low debt payments.
As a result Supply is not proportionally being cut back while demand is falling. We are continuing to see global product deflation.

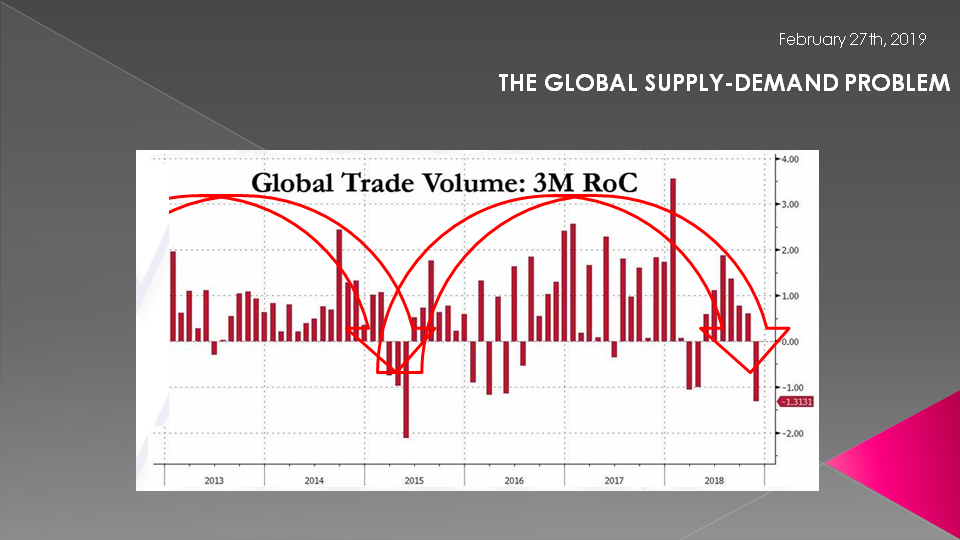
SLIDE 15
Global Trade is without question now dramatically falling and in fact it is what has panicked central banks into an almost historic policy reversals since late fall.
SLIDE 16
So far we have talked about Supply as though it can be considered as a single aggregate supply curve. Supply is about Goods AND Services. Each of these have completely different reaction functions:
GOODS:
- Goods are an Industrial Era function. They have fixed and variable costs which forces them to respond to Supply accordingly. With cheap money to finance or refinance fixed Supply can often be ramped up and costs falling significantly with increased volumes.
- The advent of Global Supply Chains in the era of Globalization has made Goods a much more "foreign" made phenomenon.
- Reduced Supply after ramping up is still however its Achilles heel. Increasing supply forces it to compete on price. Falling Supply however forces it to squeeze profits while trying to reduce costs (already cut to the bone in fierce cut throat competition). This is why global corporations are increasingly entering what is being dubbed as an earnings recession.
SERVICES
- Services is much more a post WWII Era function. Here highly trained, skilled professional are the producers of the sell-able product or service - not via automation and the associated resulting leverage.
- Cheap money is not nearly as important as attracting and keeping intellectual 'know how'. It is much tougher to quickly ramp up and traumatic when forced to scale back. Often in the later case profits are sacrificed to buy time for demand to return.
- Services are also dominantly more local or domestic. Yes there are growing global service providers but small business in America is dominated by smaller professional service providers or regional leaders.
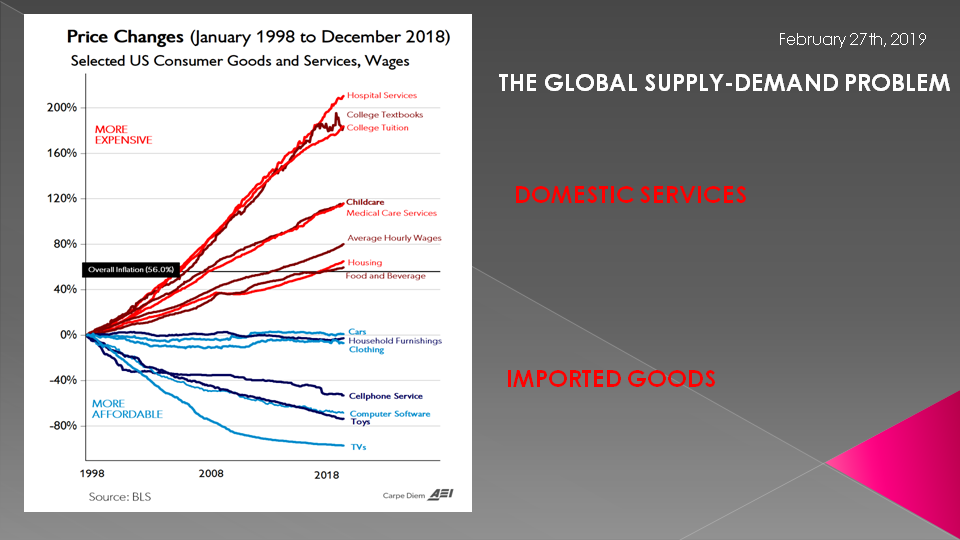
SLIDE 17
The evidence of this can be seen here graphically.
- Goods are predominately in blue, falling in price and foreign dominated.
- Recently they have begun to flatten out in price and suppliers to add function to keep price up,
- Services are predominately in red, rising in price and domestic centric.
- Price only continues to rise, almost relentlessly.
- Tuition, Childcare, Healthcare services et al.
- Locally its your hair stylist, your accountant, lawyer, garage, landscaper, electrician, plumber etc.
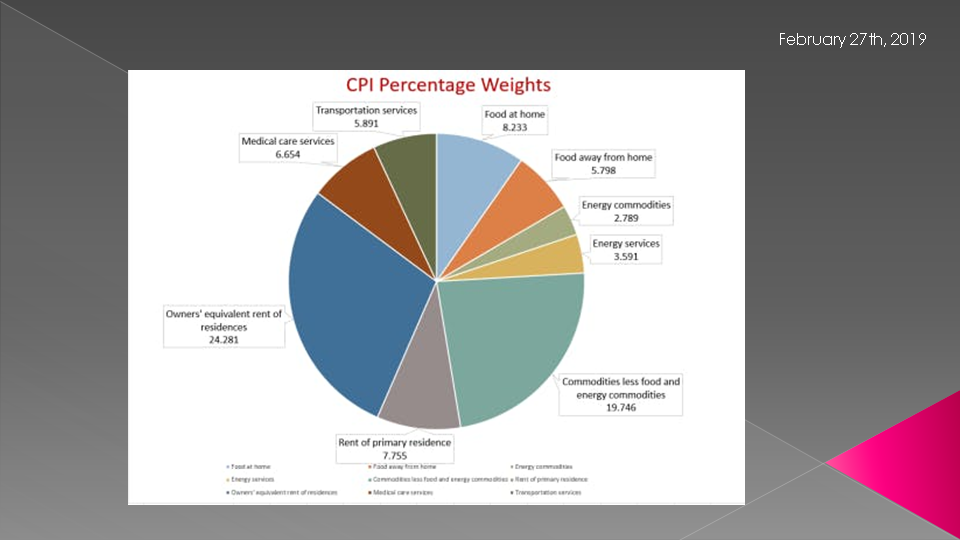
SLIDE 18
Our method of accounting for inflation is incredibly distorted and flawed.
Forget the accounting games the government statisticians use such as imputation, hedonics and substitution to make inflation cheap enough for the government to afford their 'cola' for entitlement expenditures.
It is about the real basket of what consumers actually spend their shrinking disposable incomes on. Does this chart look like your budget headings?
In actual fact, Services are crowding out goods for both consumers and corporations.
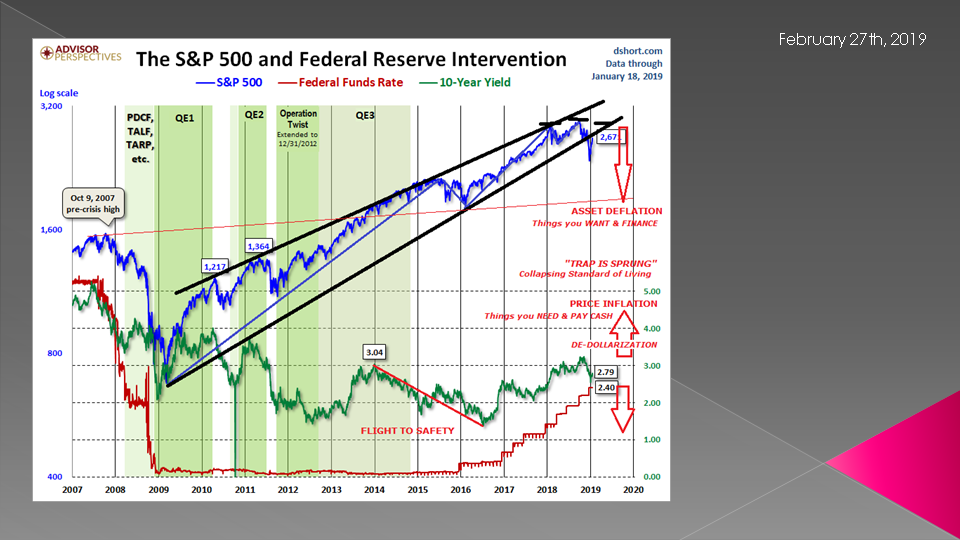
SLIDE 19
I believe what this is telling us is:
- We are moving towards an era of real rising inflation in Price Inflation and falling real prices in Asset Inflation,
- Increasingly, what we "need", normally pay cash for (ie don't finance other than on a very short term basis) will steadily rise. You don't pay your plumber, barber with long term financing - though some would argue their credit card at 22% is long term and inextinguishable to them.
- Increasingly, what we "want" like bigger houses, marque cars, exotic vacations will begin falling in price and asset value. As property taxes (which you typically don't finance) rises, houses will be seen as getting more expensive even if finance rates are reduced further by even more QE --- and that I am sure is coming again.
- If you have unencumbered collateral, money will be available and cheap. However, it will be the age old adage - money is cheap when you don't need it and scarce when you do!
SLIDE 20
Here is where things start begin to get more complicated, if you want to understand what really lies ahead (besides more QE and easy credit).
The central banks have just made it abundantly clear. Monetary Policies like QE, QQE, TLTRO etc are only the beginning of the change in the game, as we know .
This is because the global central bankers are both trapped and engaged in an unwinnable battle with what I have often referred to as the end of the Debt Supper Cycle.
SLIDE 21
The forces at play, as we have often talked about, are best described as "Tectonic". Our current Fiat Currency System is built on the fact that money can only be created and come into existence through debt creation.
Therefore, it is destroyed if debt is paid back, defaulted on, or liquidated.
The central bankers cannot allow asset prices, which support the collateral underpinning the debt to fall. The carnage would be unimaginable. There is no limit to which the central banks and government will not go, to stop this from occurring.

SLIDE 22
The problem they face is that debt is now so large, and savings so small, that productive investment is being crowding out or no longer occurring at a sufficient level.
Like the old farmer who sold his seed corn out of the grainery to live well today, there is insufficient available to plant new fields or even replant what was previously under cultivation!

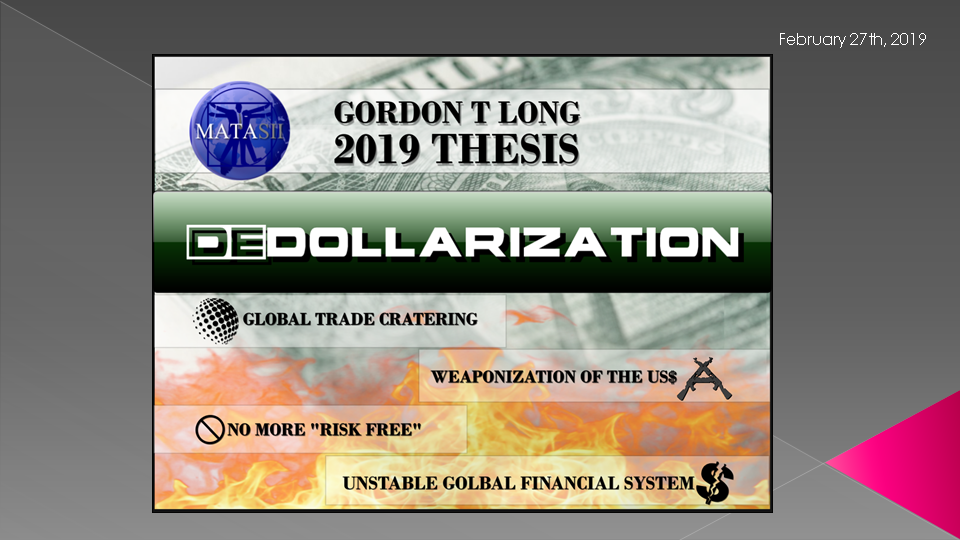
SLIDE 23
Now the real complication I mentioned earlier. If you haven't read this year's Thesis paper, I strongly recommend you do.
There is a profound change underway regarding the dollar. Don't be confused with the US Dollar potential losing its Reserve Currency Status and De-Dollarization. Losing Reserve Currency Status is only one aspect of De-Dollarization and in fact may be the last to occur after traumatic damage has already occurred.
The requirement, need and even the desire for the US dollar is changing in a massive way.
There is a long list of drivers that I lay out in the Thesis paper but the one few fully appreciate is the fallout from the US government weaponizing the US Dollar in the form of sanctions against any and all who won't conform to what the US administration alone deems desirable.
Countries are saying they won't be held hostage to extortion and are reacting accordingly. This along with the collapse of the Petro-Dollar that saved the US in the post Vietnam - Nixon era are occurring 'front and center' globally today.
The US has not yet ever had to pay the price of its massive and irresponsible money printing because it effectively has been able to export its inflation through the dollar.
That is changing and the impact will be profound.
There are trillions of US dollars that soon will not be needed and will be returned for what they are --- a "promissory note" come due!
The result over the coming years will be inflation in the US that has not previously been experienced.
It is not a matter of "if" nor "when" but more specifically at what rate.
SLIDE 24
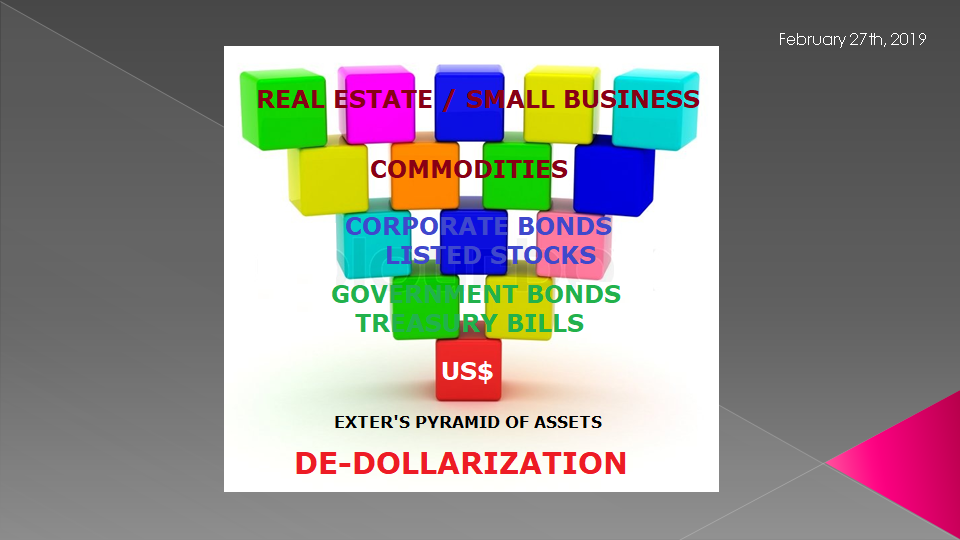
The world is built on the US Dollar and the basis of the financial pricing of Risk is the "Risk Free" measure or the 10 Year US Treasury Note.
Cracks in this underpinning will additionally be monumental and historical.
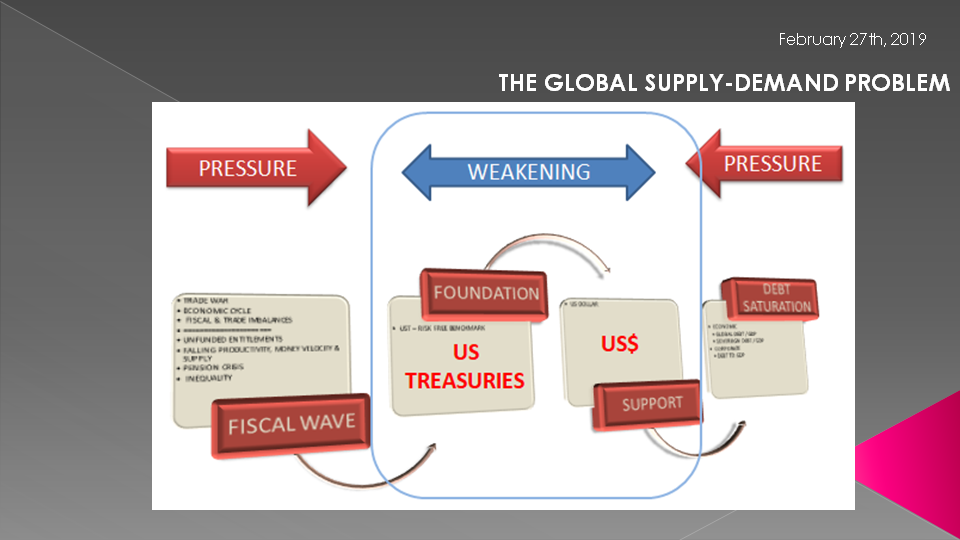
SLIDE 25
There is little that can be done as a Tsunami of Fiscal Irresponsibility (on the left) meets a End of the Debt Supper Cycle (on the right)
SLIDE 26
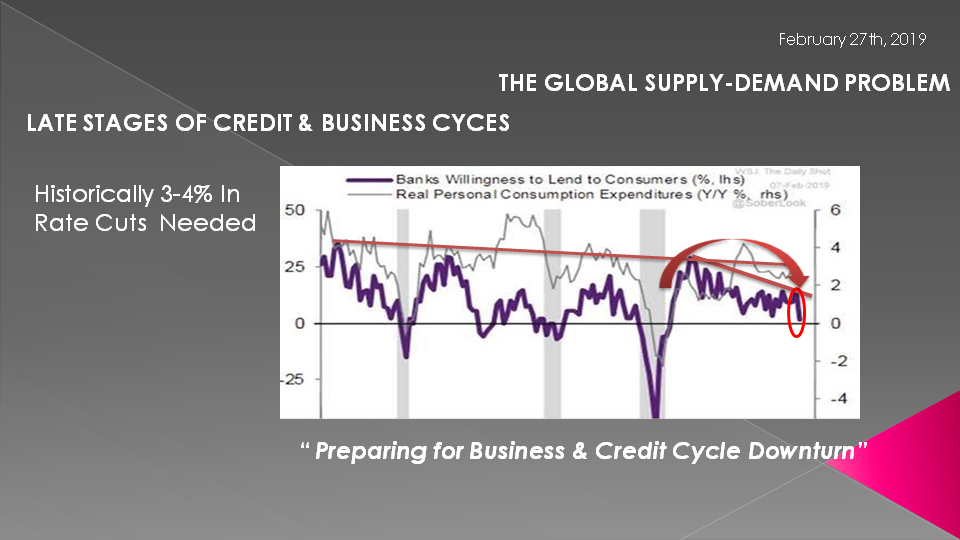
I have shown in previous videos that the banks are preparing accordingly as we enter the late stage of this cycle.
I believe they already see the next recession as a major triggering event where liquidity will be king.
SLIDE 27
Excess Reserve management is all you need to know about what the banks are experiencing about lending opportunities and their thinking.

SLIDE 28
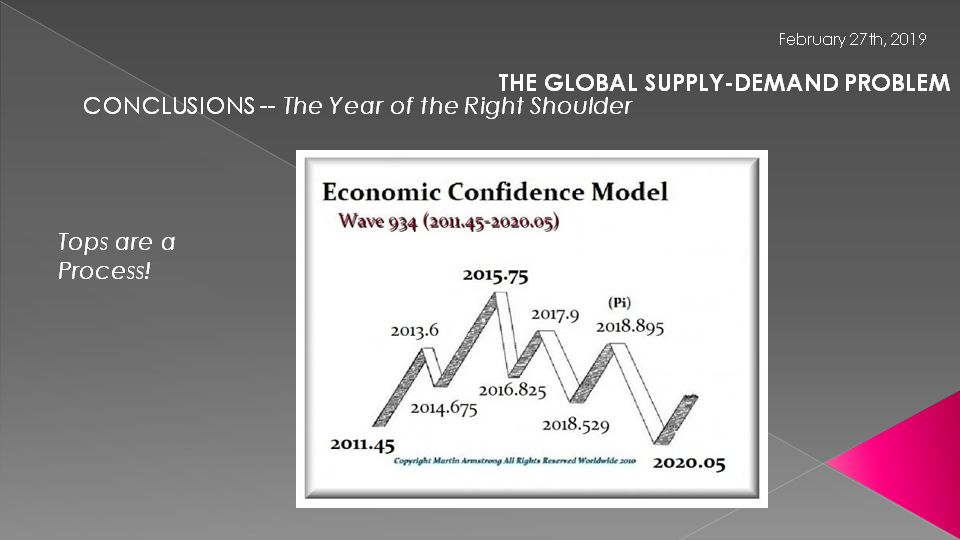
Separately, I have also talked previously about the raft of long and Intermediate Cycles all coincidentally and ominously culminating over the next couple of years. This one is from well known, Martin Armstrong, but there are a raft from Harry Debt and many other Cycle mavens.
SLIDE 29
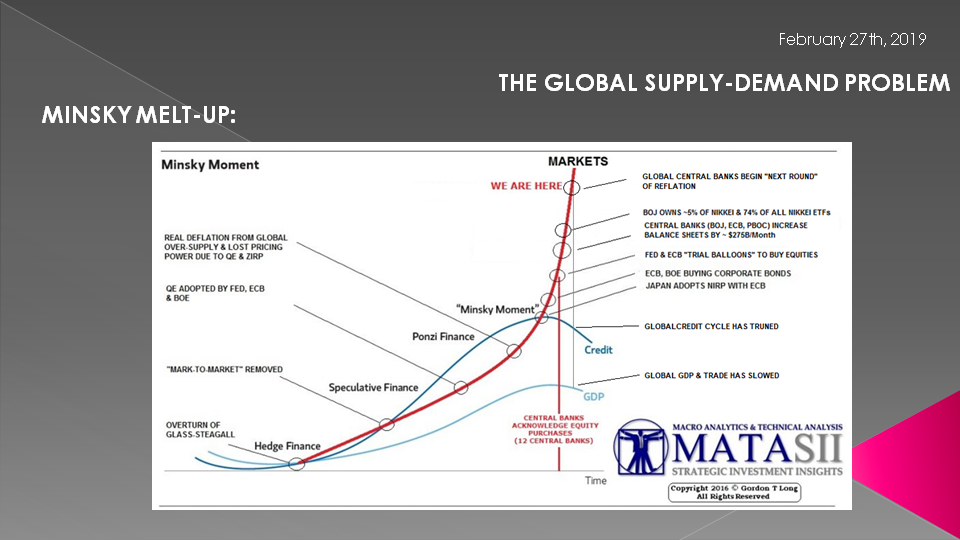
We are going to be forced unwittingly into a Minsky Meltup.
After 20 years, Japan with its now expanded QQE now already owns 40% or more of the nations debt and 70% of the ETF's trading on the NIKKEI.
More and more central Banks will resort to similar measures to shore up crumbling Asset values, along with new policies such as MMT, QE for the People (ie Helicopter Money), NIRP and massive Fiscal Deficit spending.
You need to prepare and plan accordingly!
SLIDE 30 - THEY WILL PRINT THE MONEY
So, in closing, as I always remind you, remember, the answer will be to print more money.
It is the only answer politicians will ever agree on.
Invest accordingly.

SLIDE 31
I would like take a moment as a reminder
DO NO NOT TRADE FROM ANY OF THESE SLIDES - they are for educational and discussions purposes ONLY.
As negative as these comments often are, there has seldom been a better time for investing. However, it requires careful analysis and not following what have traditionally been the true and tried approaches.
Do your reading and make sure you have a knowledgeable and well informed financial advisor.
So until we talk again, may 2019 turn out to be an outstanding investment year for you and your family.
I sincerely thank-you for taking the time to listen.