IN-DEPTH: TRANSCRIPTION - UnderTheLens - 04-21-21 - MAY - The MATASII Macro Map
SLIDE DECK
TRANSCRIPTION


COVER
Thank you for joining me. I'm Gord Long.
A REMINDER BEFORE WE BEGIN: DO NO NOT TRADE FROM ANY OF THESE SLIDES - they are COMMENTARY for educational and discussions purposes ONLY.
Always consult a professional financial advisor before making any investment decisions.
AGENDA
In this session I would like to pull together some loose ends from my recent newsletters and videos regarding Inflation, Disinflation and Deflation. Specifically, I want to tie the work on “Themes” we have been doing with our overall MATASII Macro Map.
As such I would like to discuss the subjects outlined here.
SLIDE 6
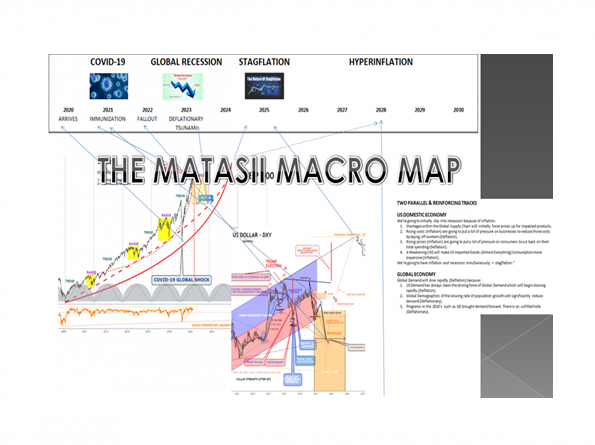
The MATASII Macro Map can be found on the “Main Log In” page for subscribers under the caption “CURRENTLY WATCHING”. Opening the “TL Technical Analysis of the Markets” will give the latest updated Macro Map along with links to over 70 supporting “real time” charts.
Less than 10% of the charts have been featured on our bi-weekly video newsletters with subscriber links. If you are not using this page it is important you do.
The page also includes links to our research on Covid-19, The Global Recession and Stagflation.
SLIDE 7
Most of the articles published on the subscriber and public sites talk to the two parallel and reinforcing tracks we are currently on.
- The US is going to slip into the second of a double dip recession in 2022/2023, and
- How the Global Economy through slowing demand due to deflation pressures will lead the world into a severe global recession (or worse) by 2025.
SLIDE 8
We have put out a lot of newsletters detailing inflation and real rates. What we haven’t done is simplify how Monetary Policy is only part of the Inflation issue.
Yes, Nobel Laureate Milton Friedman famously asserted:
“Inflation is always and everywhere a monetary phenomenon in the sense that it is and can be produced only by a more rapid increase in the quantity of money than in output.”
However, we need to remember he made this statement before we witnessed the ravages of implementing a global fiat currency system and trade imbalances being settled in credit versus transfer of physical gold.
The Fed has specifically stated that it will keep interest rates near the zero percent level until inflation "modestly exceeds the 2% level for some time". This could mean a permanently zero percent interest rates environment if inflation fails to reach the Fed's target (unless the policy objectives change) or potentially the beginning of a hyperinflationary period if it fails to control inflation since it is giving signals it is quite willing to let inflation overshoot its goals.
Those who lived in the 1970’s remember only too well the lesson that when you allow the Inflation genie out of it’s’ bottle it is extremely difficult and painful to get it back in!
SLIDE 9
We also need to be cognizant that when discussing inflation, the Fed is primarily focusing on the core Personal Consumption Expenditures index published by the Bureau of Economic Analysis. So what exactly is the core PCE index measuring?
- Approximately 20% of PCE index in housing cost
- Approximately 20% of PCE index is healthcare cost
- Approximately 10% of PCE index in financial services and insurance costs
So, the three major categories of PCE inflation index count for approximately 50% of the index. Thus, clearly, the headline inflation will clearly be heavily weighted by the expenditures on housing, healthcare and financial services.
SLIDE 10
The housing expenditures are derived from the rents and owner equivalent rents - not from home prices. The rents are a function of demand for shelter and supply of housing (or vacancy rates). The demand for shelter is mainly a function of demographics - as population grows more housing is needed. The supply of housing is mainly a function of resources, such as land for development, construction workers, and the materials.
SLIDE 11
The healthcare expenditures are also a function of demand for healthcare services, which is partially a function of demographics, and available supply of healthcare providers. However, the actual cost of healthcare is also a function of healthcare legislation.
SLIDE 12
The point is, both housing and healthcare expenditures are mainly a function of demographics, or population growth, in addition to the inability to adjust the supply accordingly. The Fed can affect the unemployment rate, and a lower unemployment rate can boost the demand for housing, and possibly the demand for some elective healthcare services.
However, the key demand factor is still related to demographics, and the Fed cannot affect demographics.
Demographics and high inflation during the 1970s
The key factor behind the high inflation during the 1970s period was due to the baby-boomer generation entering the labor force and leaving their parents homes.
The generation born between 1946 and 1965 was much larger than the previous generation. The Silent generation counted around 21M people, while the Boomer generation counted around 70M people. The first wave of baby-boomers entered the labor force in mid-1960s - the beginning of the inflationary period, and the last wave entered the labor force in early 1980s - the ending of the inflationary period. During the period from mid-1960s to early 1980s, the demand for housing, and all other goods/service was high due to demographics, which led to high inflation.
SLIDE 13
Transitory inflation and Covid-19
So, currently, we have a situation where money supply expanded greatly in response to the Covid-19 pandemics, in addition to zero percent interest rates. Many assume that this extreme monetary policy stimulus will result in inflation, possibly 1970s-style. The Fed on the other hand assumes that any near-term inflationary pressures will be transitory, with no effect on longer-term inflation expectations.
The Fed is likely correct. Any near-term inflationary pressures will likely be only transitory, since monetary policy alone cannot affect demographics. Yes, there are short-term increases in rents due to Covid-19 related dislocations, in addition to higher healthcare costs. However, longer term as the pandemic ends the inflationary pressures will abate.
SLIDE 14
Monetary inflation is something else
The core inflation excludes the price of food and energy. The price of food and energy is directly related to the financial markets via the futures markets. Investors and traders can buy crude oil futures, agricultural futures, and meat futures, and push the prices much higher, which translates into higher food and energy prices. The demand for financial assets, such as futures, is a function of money supply. Additionally, real estate prices are also directly related to money supply and interest rates. So, you can have a significant home price inflation, but not necessarily inflation in rents. Generally, asset prices are directly a function of monetary inflation.
SLIDE 15
Ben Bernanke, former Fed Chair, clearly defined monetary inflation in his 2001 speech:
The conclusion that deflation is always reversible under a fiat money system follows from basic economic reasoning. A little parable may prove useful: Today an ounce of gold sells for $300, more or less. Now suppose that a modern alchemist solves his subject's oldest problem by finding a way to produce unlimited amounts of new gold at essentially no cost. Moreover, his invention is widely publicized and scientifically verified, and he announces his intention to begin massive production of gold within days. What would happen to the price of gold? Presumably, the potentially unlimited supply of cheap gold would cause the market price of gold to plummet. Indeed, if the market for gold is to any degree efficient, the price of gold would collapse immediately after the announcement of the invention, before the alchemist had produced and marketed a single ounce of yellow metal. What has this got to do with monetary policy? Like gold, U.S. dollars have value only to the extent that they are strictly limited in supply. But the U.S. government has a technology, called a printing press (or, today, its electronic equivalent), that allows it to produce as many U.S. dollars as it wishes at essentially no cost. By increasing the number of U.S. dollars in circulation, or even by credibly threatening to do so, the U.S. government can also reduce the value of a dollar in terms of goods and services, which is equivalent to raising the prices in dollars of those goods and services. We conclude that, under a paper-money system, a determined government can always generate higher spending and hence positive inflation.
SLIDE 16
Don't confuse core PCE inflation with monetary inflation
So, yes, you will see prices rising, but it will not be due to inflationary demand/supply dynamics, and it will not be as obvious in the official PCE index, beyond some possibly transitory effects. The extraordinary increase in money supply is from Bernanke's playbook, as shown above, implemented to counter deflationary forces and deliberately trigger monetary inflation.
In fact, the long-term trends of globalization, technological innovation, and yes, demographics, are deflationary.
Once you get the financial crisis and a recession, deflation becomes the main worry - and monetary inflation the cure.
So, the implications are clear - real assets, such as gold will protect from the Fed-generated monetary inflation as the US dollar depreciates against all real assets.
SLIDE 17
This is why we feature our outlook for the US Dollar on our Macro Map shown here in the bottom center.
SLIDE 18
The common refrain we currently hear is that an explosion in the money supply due to Covid stimulus along with acceleration in government Fiscal spending associated with multi-Trillion dollar new Democratic policies such as the $2T+ Infrastructure Bill will drive inflation.
This is only partially true and the “partial” is critical to your investment philosophy going forward.
SLIDE 19
I have long argued that to understand inflation as it impacts economic conditions longer term is to understand the Velocity of Money. Inflation rises when money inflation increases for all the reasons which cause this to happen. That is not happening and has not happened for a long time as this chart illustrates.
It is hard to see this changing since increasing money supply is only further increasing the denominator (as shown in the bottom right of this slide) while an increase in money supply is not presently going into productive assets which is what it would take to increase the numerator.
My colleague Richard Duncan is a former financial specialist with the World Bank and consultant to the IMF in Thailand during the Asia Crisis. He understands this topic better than anyone. He recently published a 70 plus slide video presentation specifically spelling out that surging money supply growth simply won’t cause inflation based on the realities of the new world we live in.
I encourage you to check out his work at RichardDuncanEconomics.com!
SLIDE 20
Liquidity doesn’t get into the economy unless it is offered as credit or loans by lending institutions and then borrowed by would be borrowers turning it into debt. In fact in the US money can only be borrowed into existence. Without debt there is actually no money. US dollar bills are promissory notes or IOUs.
Therefore I watch closely what is going on with credit creation and borrowing. Last week’s Q1 bank earnings reports were very telling.
JP Morgan as an example reported that in Q1 its total deposits rose by a whopping 24% Y/Y and up 6% from Q4, to $2.278 trillion, while the total amount of loans issued by the bank was virtually flat sequentially at $1.011 trillion, and down 4% from a year ago.
SLIDE 21
For the first time in its history, JPM had 100% more deposits than loans, or inversely, the ratio of loans to deposits dropped below 50% for the third quarter in a row after plunging in the aftermath of the Covid pandemic
SLIDE 22
An even more stunning divergence between total deposits and loans, was reported at Bank of America where deposits similarly hit a new all time high of $1.88 trillion, even as the bank's loans have continued to shrink at an alarming, deleveraging (and deflationary) pace and are now at $911 billion, below their level during the great financial crisis: in other words, there has been 12 years with zero loan growth at Bank of America!
SLIDE 23
It was the same at Citi ….
SLIDE 24
.. and Wells Fargo.
SLIDE 25
ZeroHedge in fact aggregated the datea across the big 4 banks shows something striking: there has been no loan growth since the global financial crisis, while total deposits have doubled!
SLIDE 26
So what is going on?? Well, if you have been following our work you know exactly where the deposits have been coming from.
They have been coming from the Federal Reserve in the way of its buying of Bonds in the open market through versions of QE and more recently various facilities to support the Covid-19 stabilization and recovery efforts.
When the Fed buys these bonds from money managers and institutions or are Repos these cash ends up on the Money Center Banks as deposits. Excess deposits end up as Excess Reserves on the Federal Reserve’s balance sheet which has been steadily growing.
Therefore there is a direct correlation between the Fed’s Balance Sheet versus Excess Bank Deposits over Loans.
SLIDE 27
It is here that the Fed's excess reserves have gone - the delta between the two is almost precisely the total amount of reserves injected by the Fed since the Lehman crisis.
SLIDE 28
So the liquidity is there but the banks are not turning it into loans? Even worse there is no loan growth for over a decade and shrinking real growth. Why?
SLIDE 29
The answer is simple. There is no real economic growth occurring in the US and a lot of developed economies.
We spelled this out in detail in our 111 page 2017 Thesis paper entitled “The Illusion of Growth”
SLIDE 30
We have reached the point where there is so little new debt going into productive assets that we are living on credit going to solely consumption via government transfer payments and investment in the form of debt growth.
Folks, it isn’t difficult. You can’t consume more than you produce by living beyond your means before something has to give.
SLIDE 31
Our research indicates that Disinflation will occur beginning this fall after the violent surge in inflation subsides due to shortages and bottlenecks in the global supply chain.
SLIDE 32
We see:
- Tax Increases to be Disinflationary
- A "Popped Equity Bubble" is Disinflationary
- Weak Economic Growth (via Debt Overhang & Demographics) is Disinflationary
- Covid related business failures is Disinflationary,
- Accelerated Technology Advancement (i: Machines for People, ii: Communications Without Travel, iii: Work Without Offices) is Disinflationary,
- Supply Chain Restoration (after the shortage surge) will be Disinflationary,
- Rising Productivity will hold down labor costs and be Disinflationary,
- Low Inflation follows Recessions by ~ 15 months (End of Q3 2021) which is Disinflationary.
SLIDE 33
The key to going forward will be Real Rates for US Treasuries or what is considered the global benchmark for Risk Free Deb.
SLIDE 34
Our expectations are:
- Rates Will Consolidate In Q2
- Markets will Complete a Right Shoulder of Topping Process
- Precious Metals Will Rally in Q2 but Fall Further in Q3
- Markets Will Begin An Overdue Sell-Off in late Q3
- The Fed Will We Be Forced to Implement YCC in late Q3 going into Q4
- US$ Will Begin to Fall In Q4 with YCC
- Precious Metals and Commodities will Rise Sharply in Q4
SLIDE 35
As I always remind you in these videos, remember politicians and Central Banks will print the money to solve any and all problems, until such time as no one will take the money or it is of no value.
That day is still in the future so take advantage of the opportunities as they currently exist.
Investing is always easier when you know with relative certainty how the powers to be will react. Your chances of success go up dramatically.
The powers to be are now effectively trapped by policies of fiat currencies, unsound money, political polarization and global policy paralysis.
SLIDE 36
I would like take a moment as a reminder
DO NO NOT TRADE FROM ANY OF THESE SLIDES - they are for educational and discussions purposes ONLY.
As negative as these comments often are, there has seldom been a better time for investing. However, it requires careful analysis and not following what have traditionally been the true and tried approaches.
Do your reading and make sure you have a knowledgeable and well informed financial advisor.
So until we talk again, may 2021 turn out to be an outstanding investment year for you and your family.
Thank you for listening

