IN-DEPTH: TRANSCRIPTION - UnderTheLens - APRIL - CURRENT GLOBAL MACRO - Part III
SLIDE DECK
TRANSCRIPTION


COVER
Thank you for joining me. I'm Gord Long.
A REMINDER BEFORE WE BEGIN: DO NO NOT TRADE FROM ANY OF THESE SLIDES - they are COMMENTARY for educational and discussions purposes ONLY.
Always consult a professional financial advisor before making any investment decisions.
SLIDE 4
In this year’s third UnderTheLens video I would like to conclude with our final video in this three part series.
SLIDE 5
In this session we want to focus on the tradable outlook and investment conclusions based on the thinking in Part I and II.
SLIDE 6
I covered a number of important parts of this discussion in my recent video with Charles Hugh Smith. If you haven’t viewed this 53 minute video with its 37 supporting slides, I highly encourage you to, as I am not going to duplicate those messages here.
The timing of that video has allowed me the opportunity to cover additional materials which I originally thought I wouldn’t have time for.
SLIDE 7
We are presently in the midst of an inflationary boom with that evidence showing in the form of rising interest rates and inflation break-evens.
The initial stages of inflation are normally good for stocks, as prices rise on the belief in money in losing its value will only make stocks worth more in nominal terms and even real terms for those who get in early.
It is our belief that by Q3 of this year that “sugar high” will have run its course and equity markets will be in decline.
By Q4 and into 2022 the disinflationary bust will be giving way to the initial stages of our previously outlined Deflationary Tsunami.
SLIDE 8
Inflation in financial assets will by then be giving way to a reverse wealth effect, incomes and disposable incomes in our 70% consumption economy to:
- Global supply chain bankruptcies,
- Downsizing,
- Cost controls,
- Accelerating use of ubiquitous robotics and
- Falling US purchasing power as the US dollar weakens.
SLIDE 9
A falling US dollar will place rising pressures on the price of foreign goods and real US disposable incomes.
As I have pointed out in prior videos we will continue to have both rising Inflation and Deflation but the focus will shift to Deflation since it will be the one being increasingly the one most evidently felt.
SLIDE 10
I spelled all this out in the Deflationary Tsunami video including a discussion regarding these particular set of correlations we should expect around this period of evolution.
SLIDE 11
What I need to stress here is that the coming Deflationary period and Hyperinflation event will occur over the current unfolding decade of the 20’s. It is going to be a protracted period!
This is not something you trade but rather something you begin to frame an investment thesis around.
However, there will be plenty of trading opportunities because volatility levels will be high.
SLIDE 12
The markets have more to go!
- Retracements and consolidations are only getting bigger,
- Bear market counter rallies are notoriously violent,
- Fiscal policies of MMT and expected government bailouts, guarantees and market manipulation can be fully expected, and
- Even when the market has ran its course, as shown here by the red parabolic trend, tops are a process and then will take time to be put in.
SLIDE 13
In the very near term as shown here by a daily chart, we believe we are putting in a near term market top. Whether an anticipated “Head and Shoulders” formation pattern as labeled here, or
SLIDE 14
… an “M” top which also is showing itself as a possibility. We see the markets correcting and consolidating into Q3 of this year.
SLIDE 15
Our views on the 10Y US Treasury Note indicate we have further to go with bond yields, which is going to impact equity markets as we move towards the 1.75% to 1.85% range.
This is likely to temporarily lower yields in a flight to safety, as shown by the red wave “D” – before heading higher and likely triggering Yield Curve Control at levels somewhere over 2-2.25%.
SLIDE 16
The long term US 30Y Treasury bond will maintain its well managed trend channel with upper levels likely being in the 2.66 to 3% range before rolling over.
SLIDE 17
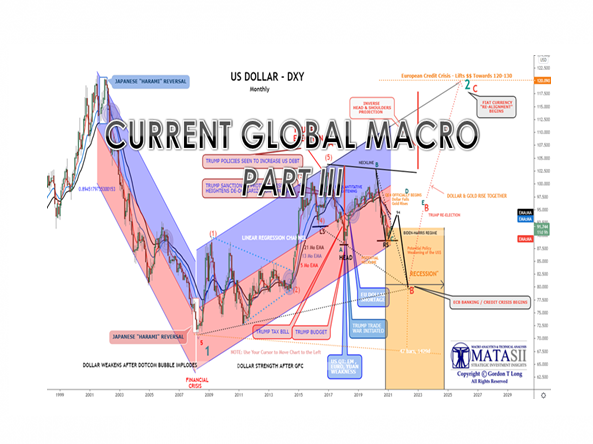
What is important to note, that though the US dollar can be expected to rise in the short term with a “flight to safety” shift, it will then begin a 12-15% decline as labeled here on the DXY in a black “C” wave, of an ABC correction.
At the Red “B” we then expect the dollar to rise strongly towards the green “2” shown at the top right. The converging dotted trend lines suggests to be sometime near the US mid-term elections.
As bad as things might appear in the US at that point in time, labeled as “B”, the problems will be even worse in the EU, Japan and the Emerging Markets.
We have always believed and stated that the US dollar will be the last to fall as the era of Fiat Currencies ends and are replaced with the inevitably required policies of Sound Money. As you can see at the bottom we believe this will occur out into 2026-27 as our parabolic equity chart earlier also suggested.
SLIDE 18
The “Coming Tsunami” shown here is not the Deflationary Tsunami of our video but rather a larger global one of a Hyperinflationary Bust of the global fiat currency system due to unsound money.
SLIDE 19
We see the short term in 2021 progressing through the stages as represented here as cascading dominos.
- High and Rising Chronic Unemployment after Covid has passed,
- An onslaught of corporate and small business bankruptcies,
- Falling Consumption as Real Disposable Incomes shrink,
SLIDE 20
- Falling Real estate values in both Commercial and Residential Housing. The Zoom economy has restructured corporate attitudes about office usage and the opportunities for major cost reductions,
- A Reverse Wealth Effect as leverage is reduced from the equity markets and stocks prices fall in the intermediate term.
- We experience a Credit Crisis from excess leverage, insufficient real collateral and short term funding restrictions the Fed can’t fix.
SLIDE 21
We need to remember, the bailouts and stimulus programs started in 2008 when the Federal Reserve intervened with the insolvency of Bear Stearns. They haven’t stopped since.
To-date, the Federal Reserve, and the Government, have pumped more than $36 Trillion into the economy.
You can rightly conclude there must be a limit to what the Federal Reserve can do with more money creation and regulatory gimmicks.
SLIDE 22
However, don’t ever underestimate the way politicians and unelected bureaucrats now operate versus only a single, short generation ago.
As this chart illustrates, in the 1930s the economy went south and the markets went with it.
Today the economy can be expected to go south but the financial markets will never be allowed to follow. NEVER!
SLIDE 23
The powers-to-be will make contingent liability guarantees or even nationalize to any extend required.
SLIDE 24
Governments have become the dominate controllers of more and more economies through exponential debt creation and massive transfer payments.
Slide 25
We have allowed this to occur by the willing and unwitting surrender of our personal securities on the form of Economic, Financial, Physical and Health security.
As a result ‘suppression’ has become the norm as we pointed out in this year’s Thesis paper “Social Suppression. This is in addition to the ever expanding macroprudential policies of “Financial Repression” which we have also detailed in previous Thesis papers.
SLIDE 26
All of this is leading to this period we mentioned previously.
SLIDE 27
The question is only about what this will mean to a countries fiat currency relative to others in the Bernanke “Enrich-thy-Neighbor” coordination doctrine, as we follow this well established roadmap towards a forced and inevitable return to sound money.
SLIDE 28
Never forget that real wealth is created by:
- Growing it,
- Mining it, or
- Building it.
You can’t print it.
As the games are played to keep the growing disconnect and divergence between financial markets and the economy maintained, real assets in the form of hard and soft commodities will inevitably be sought after to maintain wealth.
Presently those historical types of assets are dramatically undervalued.
SLIDE 29
But that is changing as we have witnessed a strong resurgence in all commodities recently.
SLIDE 30
… and we can expect that to continue to play out in throughout this decade in a volatile fashion!
SLIDE 31
We have concluded we are at the end of the Debt Super Cycle and the beginning of the beginning of the Commodity Super Cycle.
We outlined this last year in the video entitled “Is 2021 The Year of Hard Assets” as well as other UnderTheLens and LONGWave videos. So far we have been proven right.
We also outlined years ago we expected the 20’s to be about commodity backed money and what is referred to as the “Indirect Exchange”. Those writings and videos can be found in our archives
SLIDE 32
There is a strong possibility that what we are likely to witness going forward is that the Fed:
- Lets the Long End of the Curve rise
- Let a Crisis be a Forcing Function,
- Using an effective “TAPER” or expected "TAPER TANTRUM" to make this happen and control rates,
- A crisis event will negatively impact an over-leverage equity markets,
- A “Flight to Safety” will drive yields down and prices up,
- Increased Bond prices and lower yields will assist short term funding,
- Initially this will take the dollar higher through August
- As the economy’s focus shifts from Inflation to Deflation the Fed will launch YCC,
- We don't have a real Inflation Scare, we actually have a Rate Scare,
- We don't yet have Secular Inflation.
- A deflationary Tsunami is ahead as evident from an Inverted 5Y-10Y Yield Curve (above.) a global imbalance of Economies producing less than they produce
SLIDE 33
- YCC will be implemented as rates rise once again,
- This will take the US% lower thereby assisting the Fed with low rates,
- The Fed will sacrifice the US$ to be able to stabilize lending and government debt requirements
- Stagflation similar to the 70's is ahead.
- This time we have too much debt to pull off a Volcker to halt inflation
- Money printing won't work because of MZM Velocity
- Hyper-Inflation will be the outcome which will be halted by a new "Breton Woods"
- This New Breton Woods will be held in Beijing v New Hampshire!
- The problem is a global imbalance of Economies producing less than they produce
SLIDE 34
As smooth as this roadmap might appear – it will be anything but.
Shocks can be expected! Be prepared and hedged at all times!!
That means starting now!
SLIDE 35
Given that crises frequently occur when rates rise sharply, we should contemplate how high rates can rise before the next crisis. Notice, as time goes on it takes less and less of a rate increase to generate a problem. The reason, as highlighted earlier, is the growth of debt outpaces the ability to pay for it.
As this chart shows, the current one-year change in the proxy interest expense is up 3.50% from a year ago. The last two significant crises (2000 and 2008), along with a few minor ones, all happened when the proxy rose between three and four percent.
If Ten-year UST yields increase to 2.0% (currently 1.60%) by May, the proxy will increase to 5.25%, well above the 4.0% that popped the dot com and housing bubbles.”
The Fed’s problem is that while they may not be hiking rates, the bond market is doing it for them. Given the Fed’s actions are what causes rates to rise, by shifting risk preference, the result is a deflationary crash requiring more interventions and lower rates.
SLIDE 36
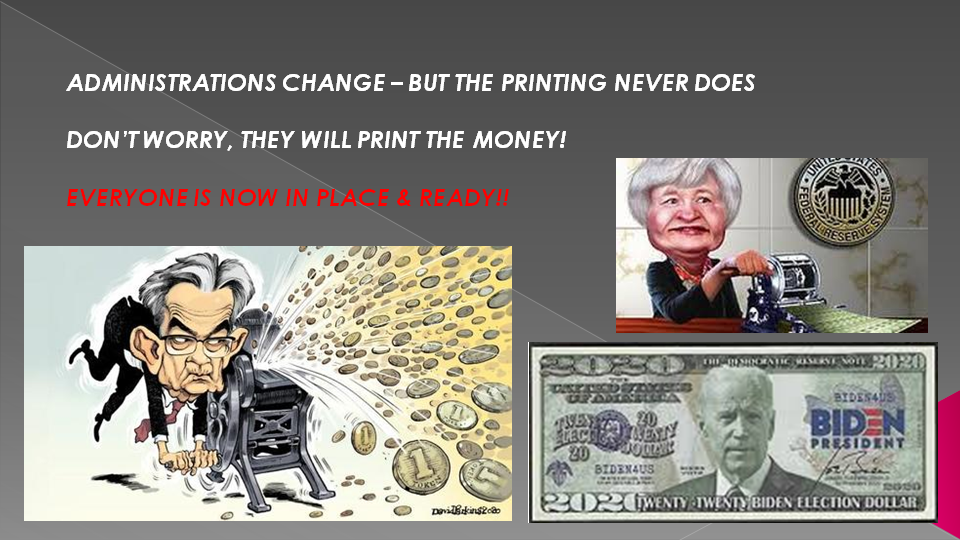
As I always remind you in these videos, remember politicians and Central Banks will print the money to solve any and all problems, until such time as no one will take the money or it is of no value.
That day is still in the future so take advantage of the opportunities as they currently exist.
Investing is always easier when you know with relative certainty how the powers to be will react. Your chances of success go up dramatically.
The powers to be are now effectively trapped by policies of fiat currencies, unsound money, political polarization and global policy paralysis.
SLIDE 37
I would like take a moment as a reminder
DO NO NOT TRADE FROM ANY OF THESE SLIDES - they are for educational and discussions purposes ONLY.
As negative as these comments often are, there has seldom been a better time for investing. However, it requires careful analysis and not following what have traditionally been the true and tried approaches.
Do your reading and make sure you have a knowledgeable and well informed financial advisor.
So until we talk again, may 2021 turn out to be an outstanding investment year for you and your family.
Thank you for listening

