Gordon T Long
Global Macro Research | Macro-Technical Analysis
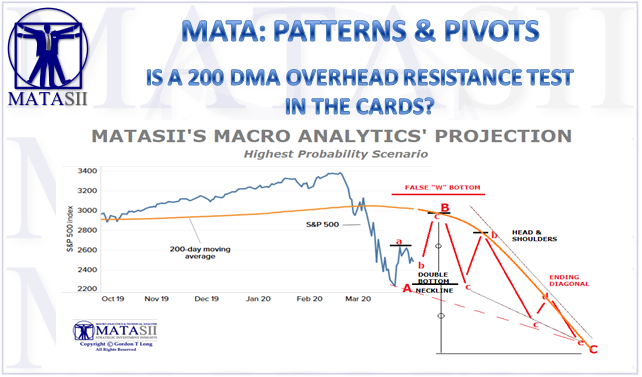
MATA: PATTERNS & PIVOTS
IS A 200 DMA OVERHEAD RESISTANCE TEST IN THE CARDS?
-
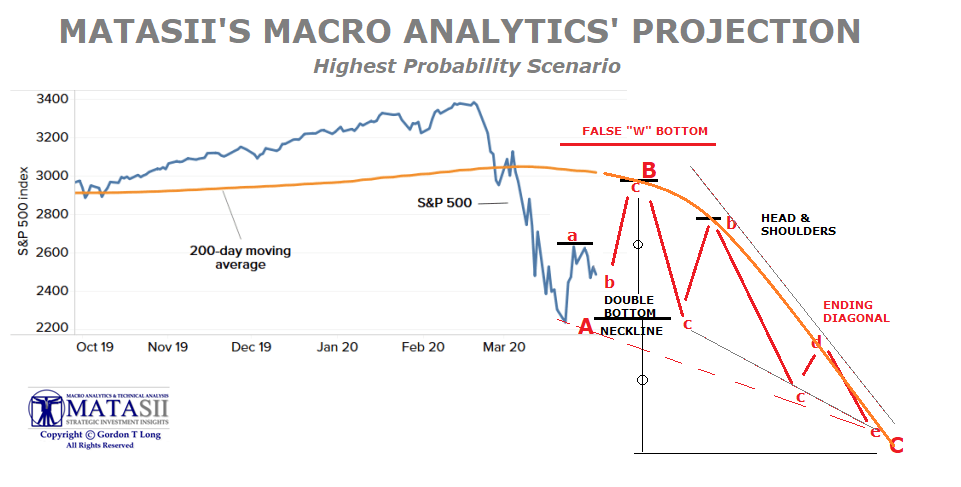
BASIS OF PROJECTIONS:
- “EVENTS” with a beginning and an expected end like the Coronavirus often are spikes in the market and typically exhibit “V” bottoms when the news turns positive.
- “V bottoms” are also characteristic of Bear Market Counter Rallies! So how do we tell the difference? By Understanding “Events” versus “Processes”.
- “TOPS” and “BOTTOMS” are “PROCESSES” that signal important Trend Reversals.
- Tops normally show the form of “M”, Head & Shoulders or Dooms. Bottoms are often “W” in form. The outside strength of the “M” & “W” can and does distort their symmetrical legs. Elliott Wave Analysis helps determine this distortion within the process by focusing on Price, Time AND Form.
- Our Analysis suggests we are presently in a Corrective Intermediate Down Trend (the red ABC below), within a Longer Term Primary Up Trend
- Much of what is highlighted below aligns with our expected “Value” migration which we have previously outlined in our 2020 Thesis Paper and February’s UnderTheLens and LONGWave videos.
- We are presently experiencing a major, multi-decade “Stabilization Test” which we highlighted as coming sometime in 2020 in our recent Three Part Macro Analytics Video Series.

Text content
FAIR USE NOTICE This site contains copyrighted material the use of which has not always been specifically authorized by the copyright owner. We are making such material available in our efforts to advance understanding of environmental, political, human rights, economic, democracy, scientific, and social justice issues, etc. We believe this constitutes a ‘fair use’ of any such copyrighted material as provided for in section 107 of the US Copyright Law. In accordance with Title 17 U.S.C. Section 107, the material on this site is distributed without profit to those who have expressed a prior interest in receiving the included information for research and educational purposes. If you wish to use copyrighted material from this site for purposes of your own that go beyond ‘fair use’, you must obtain permission from the copyright owner.
NOTICE Information on these pages contains forward-looking statements that involve risks and uncertainties. Markets and instruments profiled on this page are for informational purposes only and should not in any way come across as a recommendation to buy or sell in these assets. You should do your own thorough research before making any investment decisions. MATASII.com does not in any way guarantee that this information is free from mistakes, errors, or material misstatements. It also does not guarantee that this information is of a timely nature. Investing in Open Markets involves a great deal of risk, including the loss of all or a portion of your investment, as well as emotional distress. All risks, losses and costs associated with investing, including total loss of principal, are your responsibility.