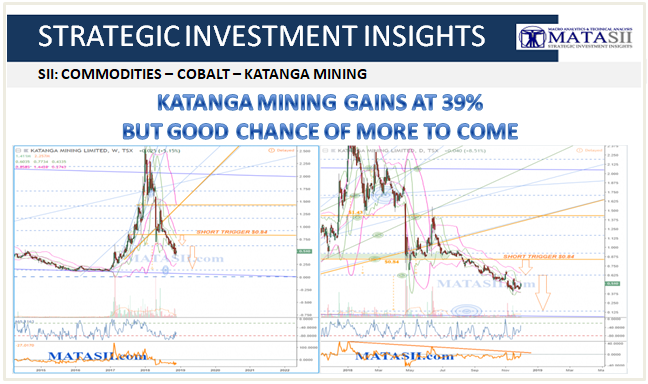
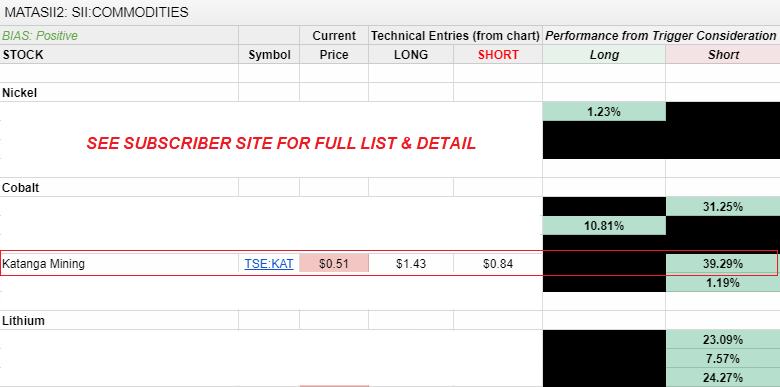
KATANGA MINING GAINS AT 39% -- GOOD CHANCE OF MORE TO COME
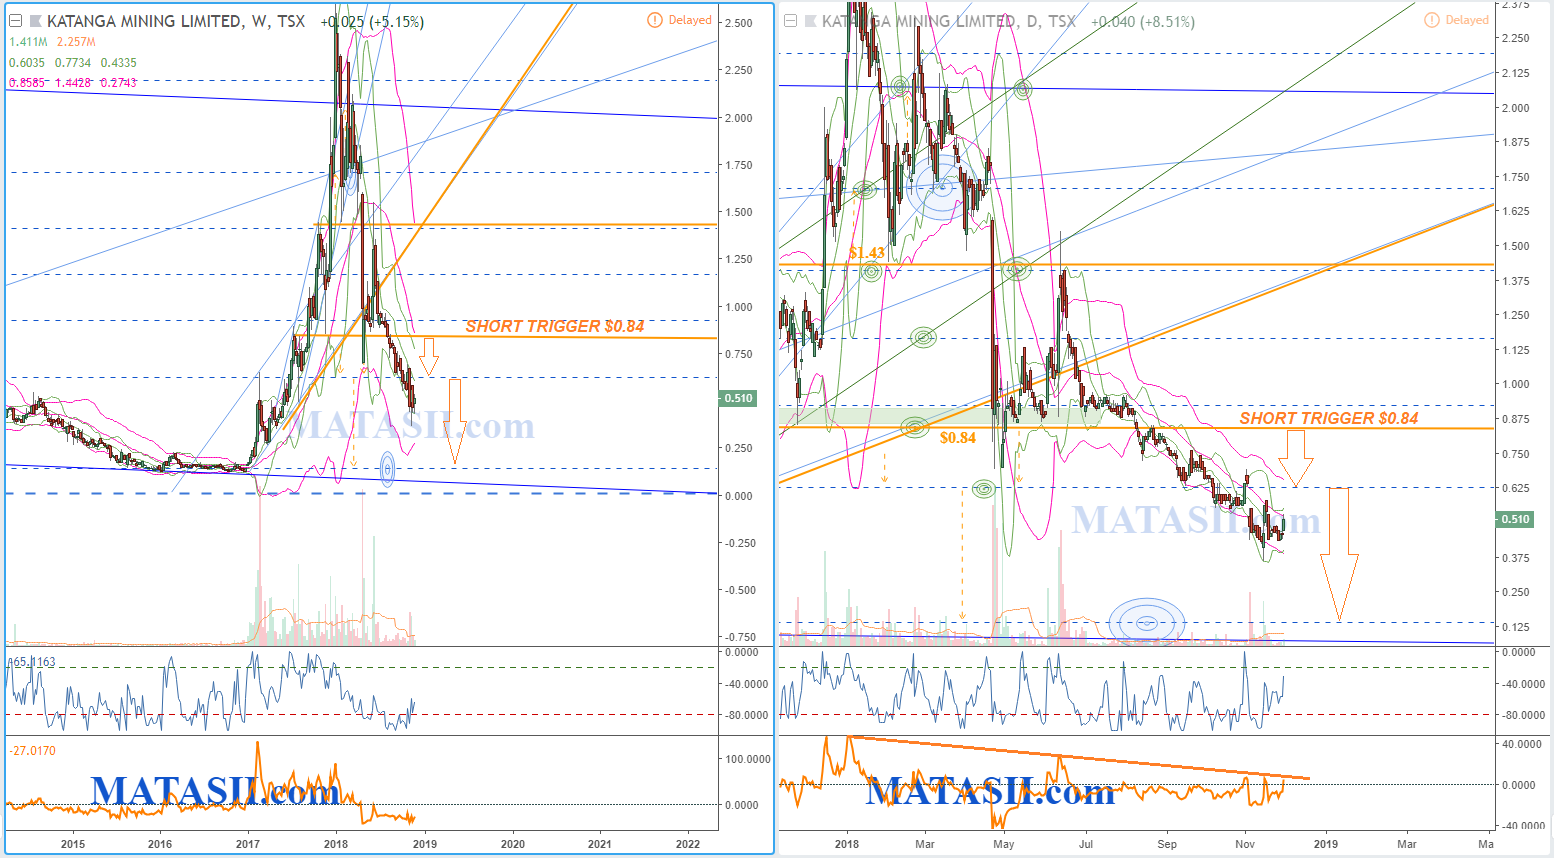
KAT Katanga Mining Ltd CHART AS OF CLOSE 11-30-18
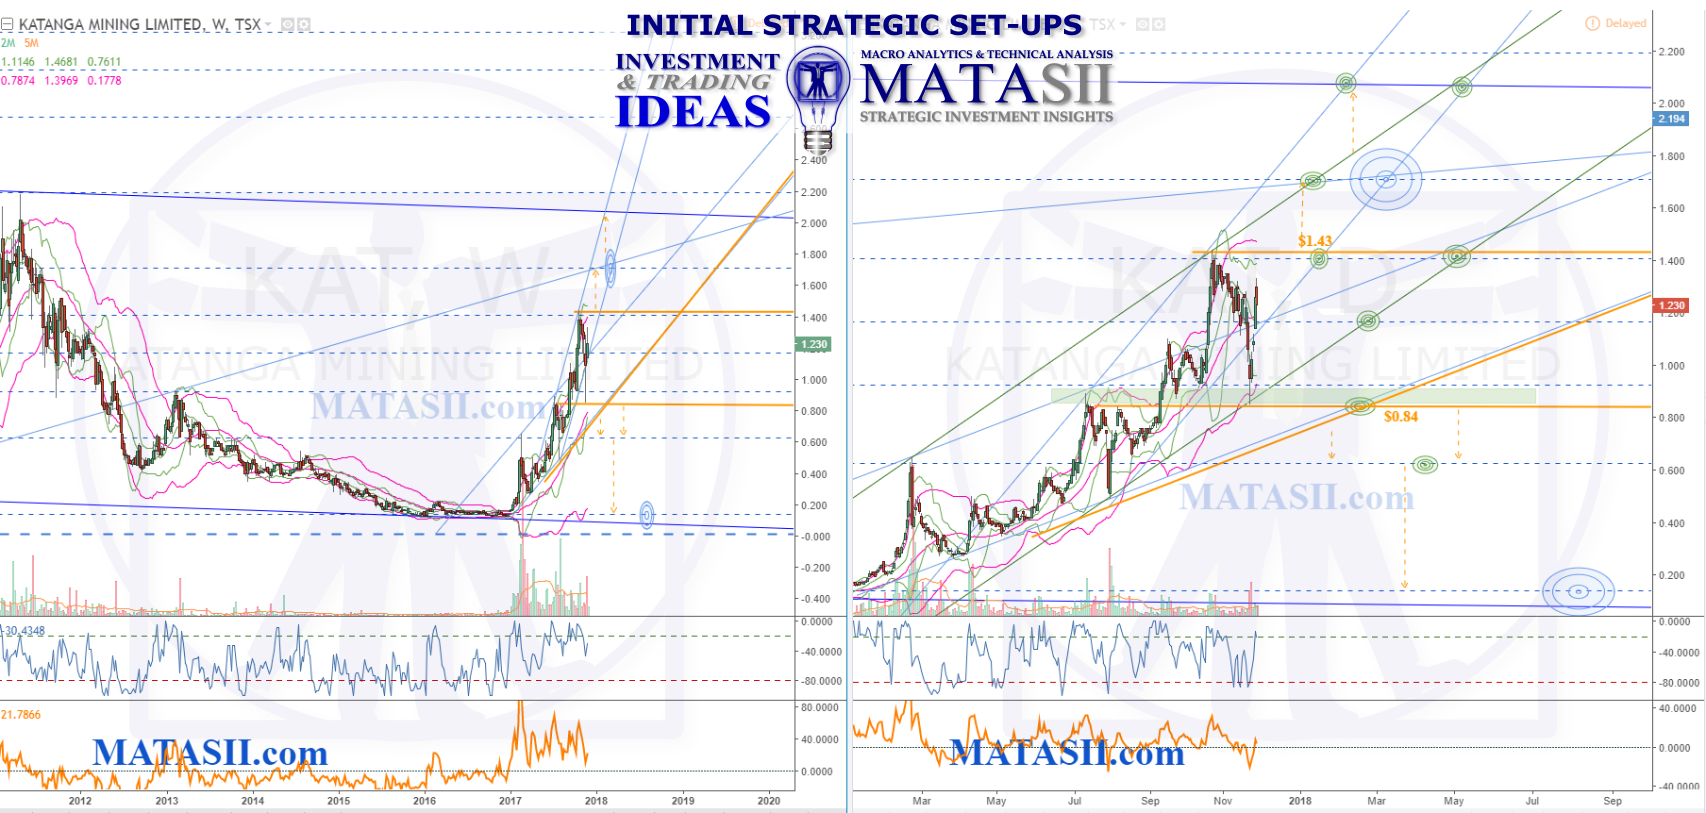
INITIAL KAT Katanga Mining Ltd. IDEA: November 28th, 2017
KAT has been as high as $28.00 (2007); and has recently lifted from lows around $0.14 (Dec 2016). The weekly chart (left) shows a potential blue channel, with the market sitting about mid-way between the s/r's of the channel. The lift from the bottom of the channel can be bound with a few channels: 2 from the weekly perspective (blue) and another on the daily (green). The daily chart (right) shows the current market with the channel s/r's that should be watched out for: the green channel seems to have held the overall lift well; the blue channel s/r's have previously had market reactions and should be watched for this potential again.
Solid orange lines highlight potential trigger considerations. IF the market continues its positive trend, lifting through the most recent highs offers a potential trigger consideration. Note that the green and blue channel resistances are nearby and should be watched for reactions.
IF the market falls off from here, breaking down through the green s/r zone and/or the bottom of the blue channel support offers potential opportunities for a move to the next technicals.