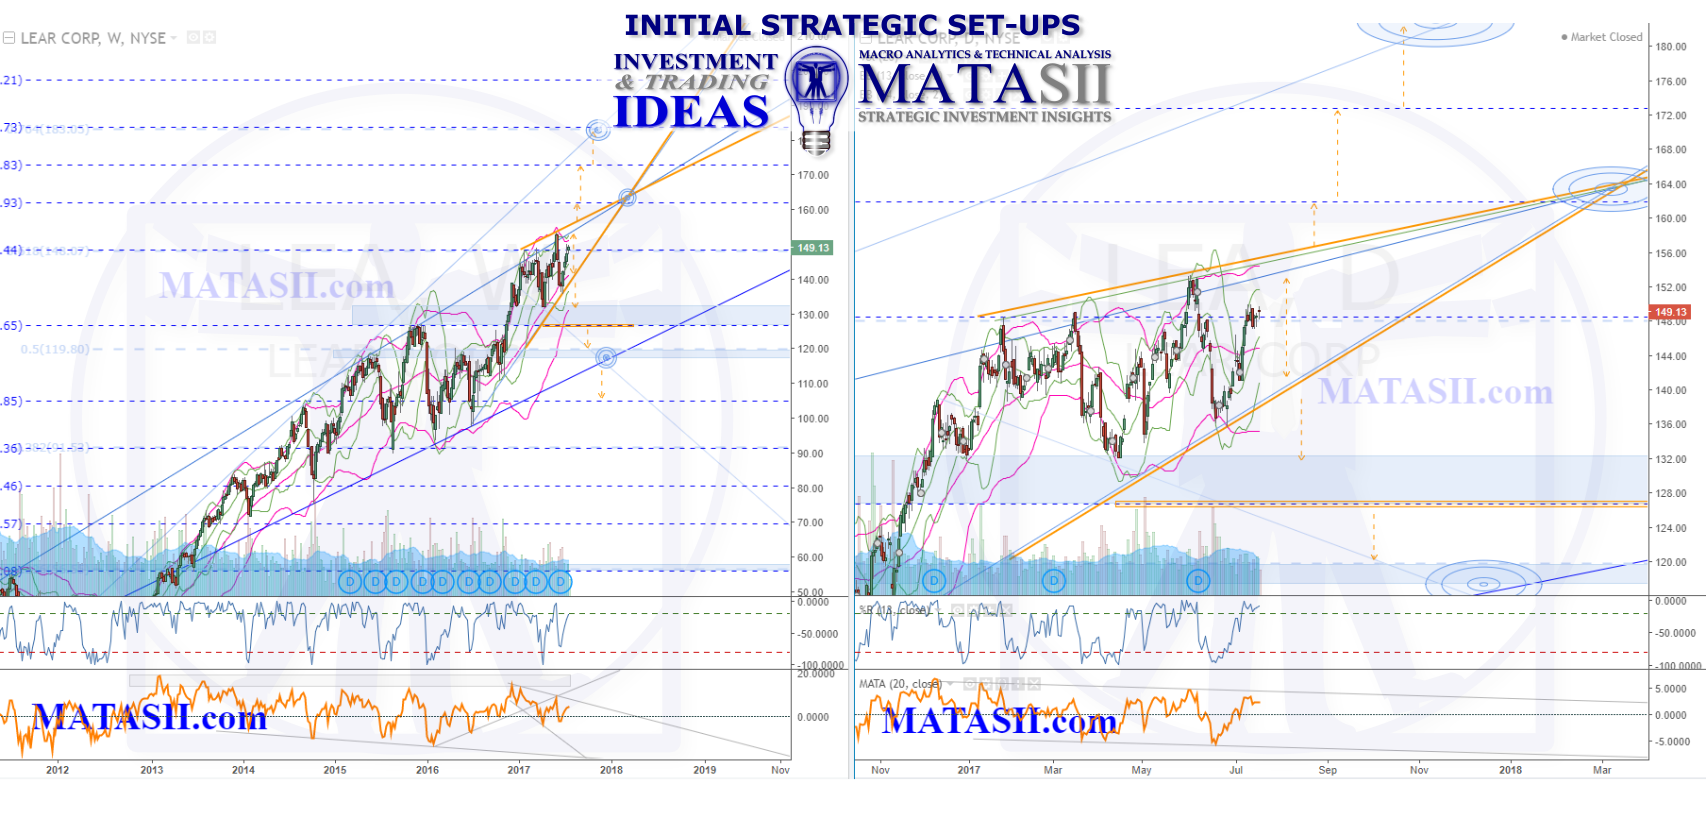
 The weekly view for LEA (left chart) shows a large lifting expanding wedge, with the market now at the top resistance of the pattern. The daily chart on the right gives us a closer look at the recent consolidation pattern since the market has reached the weekly pattern resistance.
Solid orange lines highlight significant technicals to watch, offering technical trigger considerations if broken. Dashed orange arrows offer potential moves for consideration: note they are from significant technical to significant technical.
Note the blue dashed horizontal lines (weekly & daily), these are Fibonacci ratios, and they appear to mark the significant market levels well. IF the market finds resistance and starts to fall from the current pattern(s), we can look to these again for potential market reactions. IF the market breaks to the positive, then we can look to the Fibonacci extensions above the market for target levels and places to watch for market reactions.
The indicators are currently suggesting more potential lift; if we start to see them roll over from significant technicals then this would be a warning for a potential market reversal. Although there is a technical consideration prior, the first blue s/r zone below the market will need to be broken through for a topping to be in consideration. It is possible to see the blue s/r zone hold the current consolidation and have the market continue its previous lift.