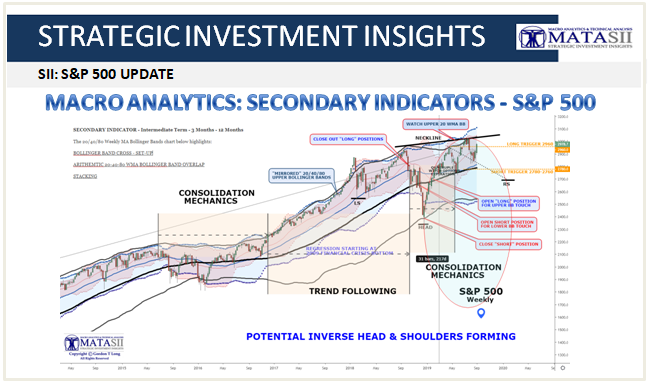
MACRO ANALYTICS: SECONDARY INDICATORS - S&P 500
The Secondary Indicators for the S&P 500 are still giving a positive market bias despite market turbulence and Monday's largest sell-off since January 4th.
SECONDARY INDICATOR CHARTS - S&P 500
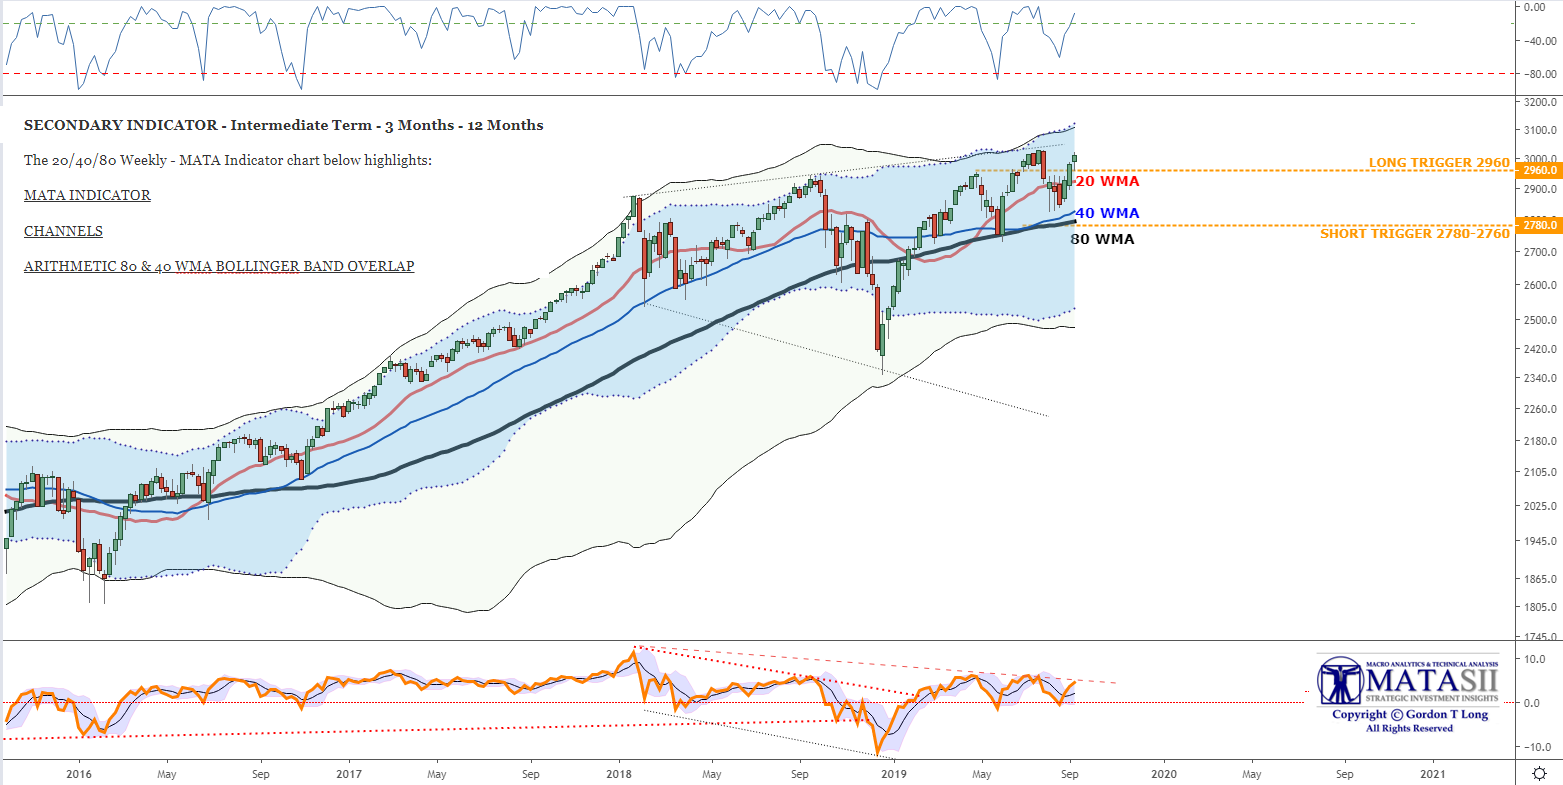
The Secondary Indicator uses a 20 /40 / 80 Week set of Weekly Moving Averages. The first chart shows:
- They are still stacked - i.e. the 20 is above the 40 which is above the 80. This is a positive bias.
- The proprietary MATA Momentum Indicator (lower panel) is not yet signaling a further dramatic fall. Note the dotted red line which historically often provides support.
- The Upper Bollinger Bands for the 80 and 40 WMA are both "aligned" and mirroring the black dotted trend line overhead resistance. This is still indicating bullish pressures.
- The 40 WMA Bollinger Bands are contained within the 80 WMA indicating still a Bullish bias though they are 'flattening'.
- The Upper Panel shows the RSI to still be rising.
- The MATASII proprietary Momentum Indicator suggests a near term reversal may soon occur. What it closely to see if the overhead resistance is broken or forces a reversal.
The next chart focuses on slightly different indicators. We see here:
- We have shifted from a Positive Upward Trend to a period of Consolidation.
- Periods of consolidation often exhibit diamond (expansion / contraction) patterns which we see taking shape.
- Consolidation periods also often see bands (the 20, 40 and 80) begin to close together in a tighter pattern - which we seeing.
- This is a chart with a lot of subtle indicators. Unless price breaks the 80 WMA (in black) the Secondary Indicators still maintain a positive bias.
- A clear ellipse shown in red has appeared and needs to be watched closely to see if it holds. If it does the probability is for a correction within the consolidation patterns which will signal a Reverse Head and Shoulders pattern.
