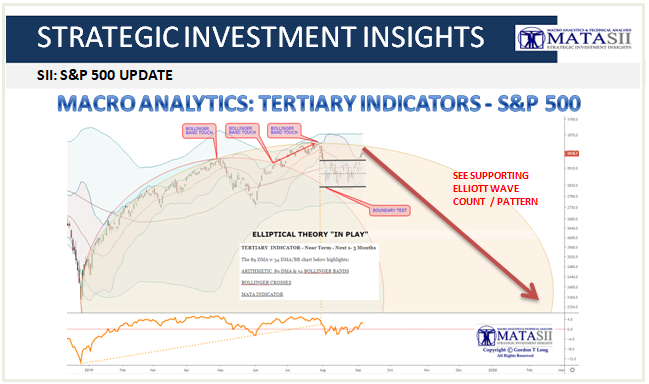
MACRO ANALYTICS: TERTIARY INDICATORS - S&P 500
TERTIARY INDICATOR CHARTS - S&P 500
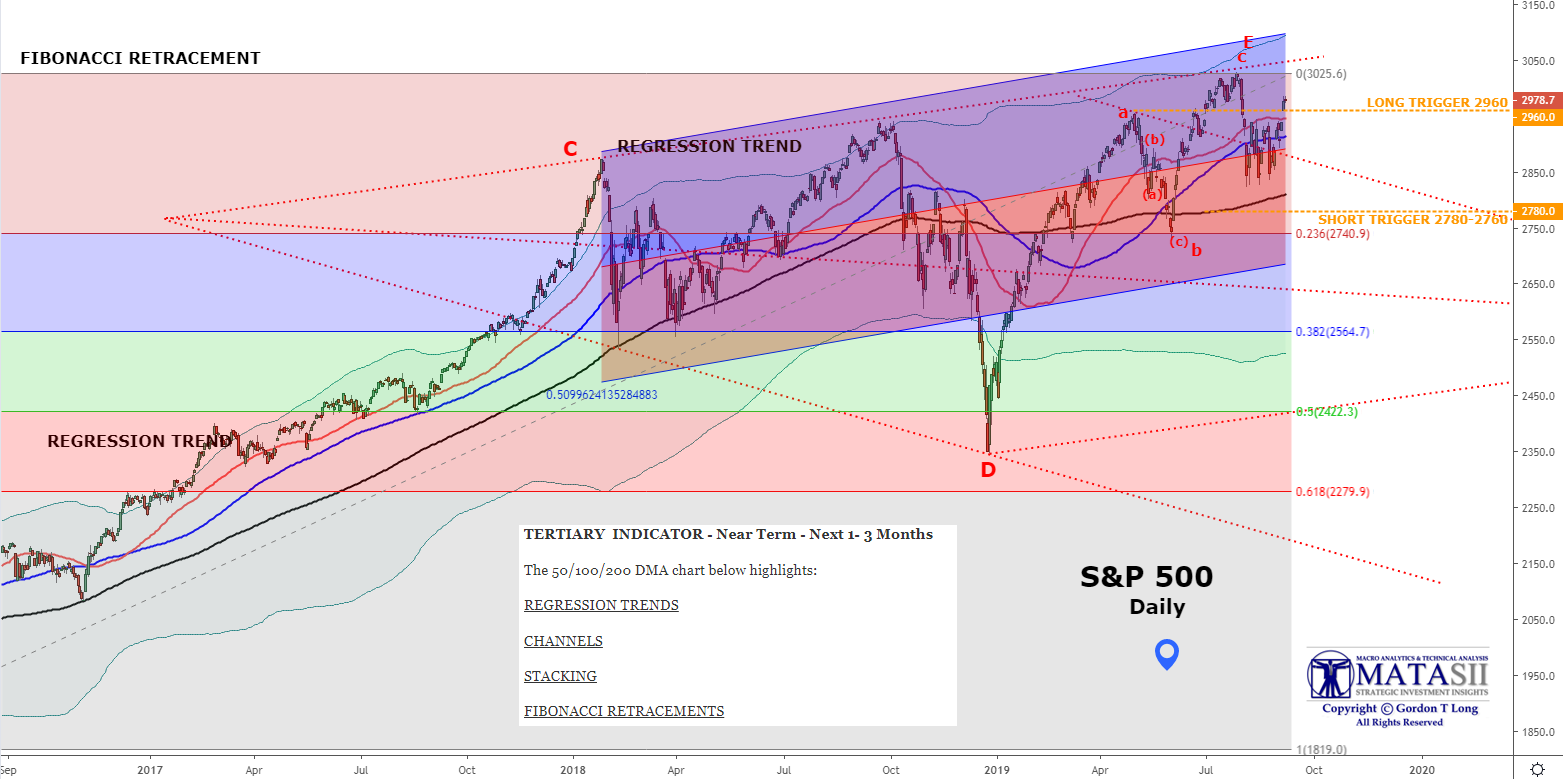
The Tertiary Indicators use a 50 / 100 / 200 Daily Moving Average (DMA);
- The moving averages are reflect the 50 DMA above both the 100 and 200 with the 100 DMA approaching a "possible positive cross of the 200 DMA.
- The fast that the 100 DMA has flattened is an initial warning of a near term correction.
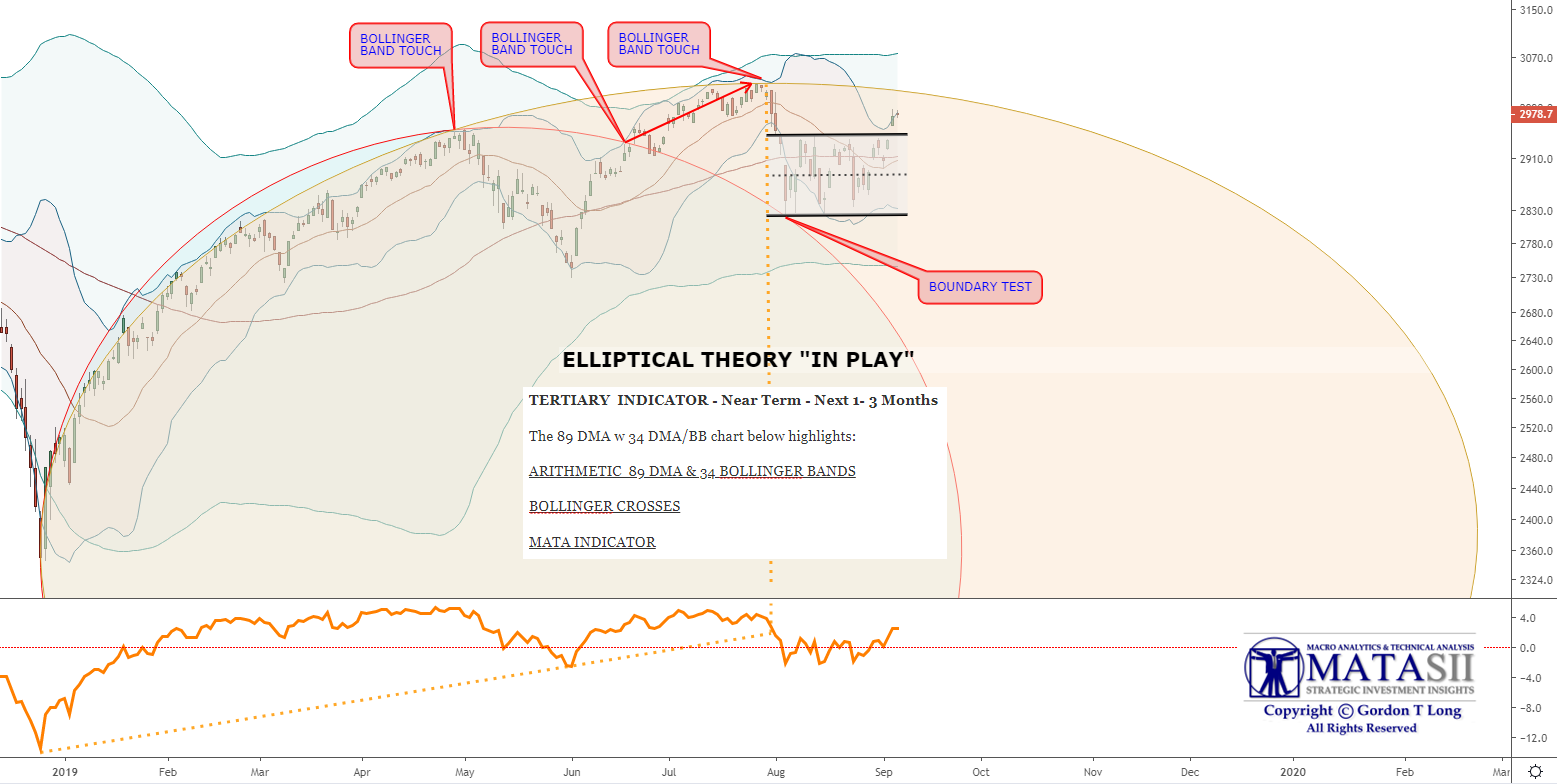
The second chart focuses on:
- We have a large Doomed top as part of an Elliptical Pattern that can be expected during a Consolidation period to mark the upper boundaries.