MAJOR TREND IN INVESTOR MONEY FLOWS SINCE THE FINANCIAL CRISIS
In the decade since Lehman's failure, investors - many of whom were replaced by algos, robots and other "passive investing" allocating automatons - have been plagued by doubts about what is now the longest bull market on record over fears that the artificial recovery - built on the back of trillions in liquidity created by the world's central banks - could come crashing at any moment, but seeing no other options were forced to allocate capital to various strategies and themes over the years.
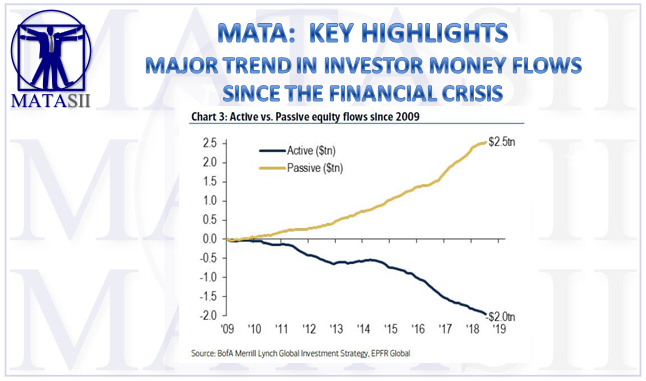
The following chart from Bank of America succinctly summarizes the biggest flow trends since the global financial crisis, the chief of which is the well-known shift into Passive investing and away from Active, which has seen no less than $2.5 trillion in flow reallocation ...

... as well as the two "Great Rototations", including $2.2 trillion into bonds versus $0.7 trillion into equities.

As for the flow winners since 2008, according to BofA's Michael Hartnett, these are shown in the chart below and "illustrate investor desire for safe haven (cash, gold), yield (EM debt, MLPs), growth (tech) & QE (banks & Japan) themes."

Which brings us to today: how are investors positioned now?
According to the latest flow data fro BofA, the market is increasingly long cash - which makes sense in light of the Fed's ongoing rate hikes, US stocks, IG bonds, crude:
BofA's CIO writes BofAML private client allocation to Tbills highest since Sept ’08, Fund Managers are overweight stocks more than 1 standard deviation above norm, while in credit IG bond inflows have risen to $56bn YTD, and the recent ramp in the commodities means that WTI crude futures are net long +1.8sd versus history.
What does the market not like? Investors are short gold, Treasuries, EU equities, and junk bonds:
Specifically, the private client gold ETF asset allocation has dropped to just 0.9%, a new low; at the same time Treasury futures have hit a net short of -2.6sd versus history; across the Atlantic, EU equities have seen $57 billion in redemptions in the past 6 months; while junk bonds have suffered from $48 billion in outflows YTD.
Finally, BofA presents the top pain trades: it writes that bearish price action & positions say September pain trade is up via EU & EM stocks; while inflation & China say Treasury bears to be disappointed.