MATASII JANUARY 2019 SYNTHESIS NOTES: FLOWS & LIQUIDITY

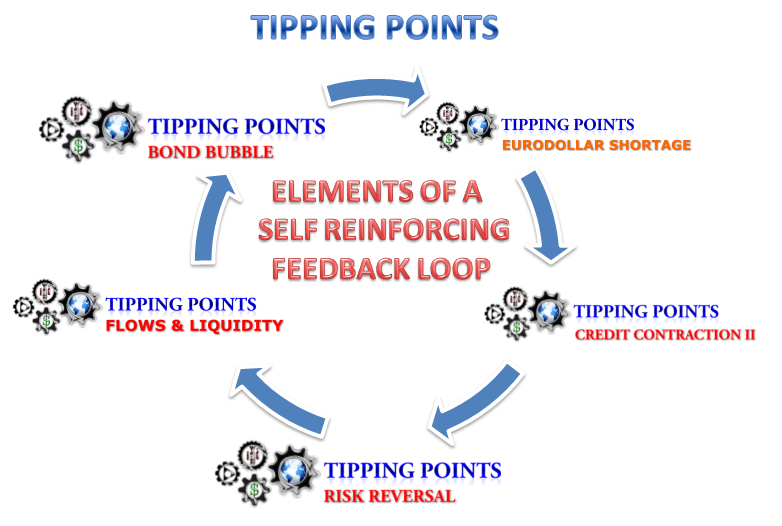
FLOWS & LIQUIDITY ARE A DOWNSTREAM ELEMENT OF A SELF REINFORCING FEEDBACK LOOP PRESENTLY UNDERWAY
WE HAVE AN ALARMING NEGATIVE REINFORCING FEEDBACK LOOP BETWEEN LIQUIDITY, VOLUME & VOLATILITY

- Liquidity has become to a large extent driven by market volatility and volumes.
- This is a reinforcing negative feedback loop between:
- Volatility,
- Volumes,
- Liquidity.
- Examples:
- The unprecedented drop in futures market depth or "record low liquidity",
- The currency flash crash on Jan 2, or
- The equity market “upside crash” on December 26.
- In a time when the entire asset class of active investing is increasingly endangered by the encroaching threat of passive investing resulting in prominent hedge funds shuttering left and right and removing marginal market players, (and where HFTs are now cannibalizing each other and unable to "provide liquidity", i.e. offset any sharp jump in trading volume, as a result of unprecedented commoditization of order flow) trading volumes (in both absolute and delta-one terms) will keep declining.
- With volatility expected to keep rising as central bank liquidity withdrawal accelerates in the coming months, something BofA discussed two days ago when it noted that "a flattening in the yield curve over the last three cycles has preceded rising volatility by about three years" and thus "expects a more volatile backdrop for US stocks in the coming years", going so far as to suggest that volatility will "likely double by 2021"
- Absent an increase in overall market volume, liquidity will collapse to even more unprecedented depths as the volume/volatility ratio hits new all time lows.
- "Equity markets could benefit from a rethinking of the current state of liquidity provision and of market reversion forces."
If the current trend of rising volatility coupled with declining delta-one volumes continues, the result will be a market in which the top-of-book depth eventually collapses to zero and where even the smallest order has the potential to unleash chaos
- Absent another major central bank intervention that eliminates the endogenously rising market volatility, the real chaos is yet to come.
THE MARKET'S PROBLEM IS LIQUIDITY - MEANING GLOBAL MONEY, INCLUDING COLLATERAL FLOWS
 The market problem is liquidity. Meaning global money (including collateral flow),
- Current Financial Market Actions all Correlate with this supposition and additionally correlate from the start of the crash on Oct 4th:
- CORRELATION 1: The ungodly Repo rate spike,
- CORRELATION 2: The drop in WTI and the chaos in oil markets (benchmark spreads),
- CORRELATION 3: The straight line (almost) drop in WTI and Contango
- CORRELATION 4: The spike oddly connecting to exactly what Eurodollar futures are saying (shortage),
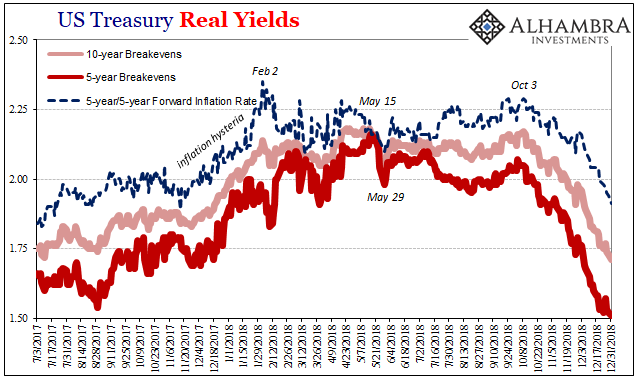
- CORRELATION 5: Plummet in future inflation expectations,
- CORRELATION 6: Swap and credit spread blowout,
- CORRELATION 7: UST Futures & Yield Curve,
- CORRELATION 8: An unprecedented Bond Market Rout.
- The Synchronized Global Growth Narrative is false which means current Central Bank Policy is flawed,
NOTHING WILL CHANGE UNTIL THE FED REVERSES COURSE ON RATE HIKES AND THE RATE OF QT
(Which means it is trapped and we have effectively lost control of the Global Economy to Debt Excesses & Servicing)
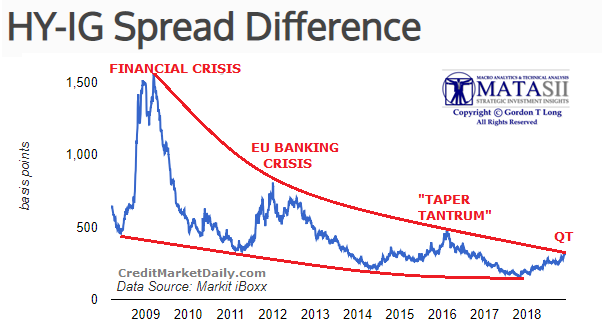
ACCELERATING CREDIT LIQUIDATION WITH BOTH IG & HY SPREADS ARE BLOWING OUT
- US credit spreads, which have blown out this quarter, widened even more to the highest levels since the summer of 2016 amid accelerating credit funds outflows,
- The reason for the continued blow out is seen to be from accelerating liquidations to fund redemptions and outflows from credit funds,
- Lipper reporting that investment-grade funds saw outflows of $4.4 billion for the week ended Dec. 26, while junk bond funds registered the biggest outflows since October.
KEY MATASII OBSERVATIONS
- Unless credit spreads tighten, it will become prohibitively expensive for companies to issue bonds and fund stock buybacks in 2019,
- Why have historical IG spreads (on a relative basis) moved above HY? (Suspect it has to do with highly exposed, massive build-up in BBB & expected downgrades of A, AAs).
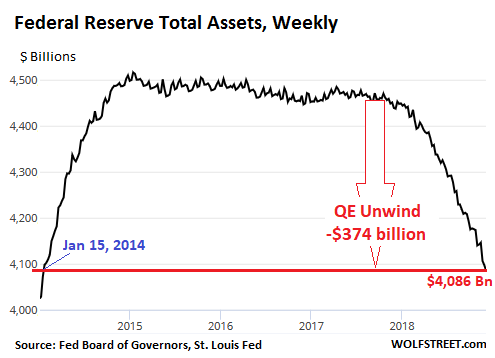
FED HAS REACHED ITS "CRUISING SPEED" OF $50B OF QT/MONTH WITH $374B ALREADY DONE
In October the Fed reached cruising speed. In the cruising-speed phase, the Fed is scheduled to shed “up to” $30 billion in Treasuries and “up to” $20 billion in MBS a month, for a total of “up to” $50 billion a month.
- The Fed has now shed $374 billion as part of QT,
- The amount of assets on the Fed's Balance Sheet had roughly grown in line with nominal GDP (not inflation adjusted) prior to 2008,
- The Fed held about $910 billion in assets in the summer of 2008, before the whole mess started,
- Since Q4 2008, nominal GDP has grown by 42%.
- Assuming that QE continues for five more years: At the average growth rate of the past few years, nominal GDP in 2023 will have grown by 72% since Q4 2008.
- If the Financial Crisis had never happened and if therefore the Fed had continued expanding its balance sheet in line with nominal GDP, the balance sheet would have reached about $1,570 billion by 2023.
In November, the Fed shed $30 billion in Treasury securities and $16 billion in MBS, for a total QE unwind of $46 billion, the largest monthly amount since the QE unwind began
WE HAVE A CLEAR GLOBAL DEARTH OF LIQUIDITY
EURO AREA MONEY SUPPLY GROWTH SLOWING FAST
- In 2000, a slowdown to 5% annualized growth in Money Supply (M1) was sufficient to trigger an economic downturn in concert with a recession in the US after the technology mania ended.
- A slowdown to a 0% growth rate triggered crisis conditions in 2008.
- After a sharp, but short term spike in money supply growth after the ECB made emergency liquidity facilities available to European banks to mitigate the fallout from the US housing bubble implosion, crisis conditions promptly returned when these facilities expired and money supply growth fell to around 1% in 2011.
- Although recent surveys show that lending standards in the euro area have eased considerably, bank lending growth remains quite anemic.
- Most of the expansion of the money supply in recent years can be ascribed to QE,
- TMS growth in the euro area was likely to fall to less than 5% y/y by the end of the year,
- While European banks have greatly improved their capital ratios, many are still weighed down by large legacy NPLs. Stricter capital adequacy regulations are proving to be a considerable obstacle to bank credit expansion as well.
- Another impediment to credit growth is the recent weakness in economic performance, which was presumably at least in part triggered by faltering confidence due to the pending “Brexit” and the spat between Italy and the EU Commission over the country’s draft budget. This is illustrated by the Citigroup economic surprise index depicted below – positive surprises predominated in 2017, but this has changed significantly in 2018.
JAPAN'S' STEALTH BOND TAPER'
- Bank of Japan governor Haruhiko Kuroda managed to do what no other BoJ governor was able to accomplish before him since the bursting of the bubble in the early 1990s: he pushed Japan’s true money supply growth above the level of 6% y/y.
- He is now forced to acknowledge that taking his foot even a little bit off the gas pedal is all it takes to reverse this growth spurt again.
- Y-O-Y Money Supply growth rate has slipped back to 6.15% – still hefty by Japanese standards, but the trend is now pointing down.
- The BoJ decided to switch from buying a fixed amount of 80 trillion yen in JGBs every month to a policy of “controlling the yield curve”, or keeping the 10-year JGB yield between 0 and 0.1% - this has led to a kind of “stealth tapering”, as the BoJ’s JGB purchases have steadily decreased since then,
- Japanese banks are not really all that reluctant to lend – they are just not lending much in Japan. Instead they have become even greater funding sources for the rest of the world than they already were previously (Think: Japanese Carry Trade).
- BoJ’s balance sheet has eclipsed the country’s GDP with lending to overseas clients; both large international and regional banks; with Japan amassing sizable US dollar-denominated assets.
- The BoJ ended a previous QE program rather abruptly in 2006, shrinking its monetary base by almost 25% practically overnight. At the time we were surprised how little attention was paid to this maneuver. Later on we began to suspect that it was probably no coincidence that home prices in the US peaked right around the same time.
- The pile of USD-denominated assets held by Japanese banks has become so large that it hangs over the markets like the sword of Damocles. It may not take much for it to fall.
CHINA MONEY SUPPLY GROWTH DOWNTREND CONTINUES
- Y-O-Y growth in M2 has essentially remained stuck near a 20-year low of ~8.72%,
- Y-O-Y growth in M1 has dipped below 4% for the first time since 2015,
- No serious reflation efforts are underway as of yet,
- PBoC has cut minimum reserve requirements several times this year and is frequently seen injecting short term liquidity to keep repo rates under control,
Money supply growth is the most important fundamental datum for overvalued risk assets. Everything else is just decoration.
UNDERSTANDING WHY GLOBAL LIQUIDITY HAS CRASHED AGAIN
High debt levels always demand high liquidity to facilitate re-financing.
- The current credit squeeze looks more like the 1997/98 Asian Crisis when Central Banks, led by the US Fed, tightened the supply of primary liquidity and cross-border flows rapidly retreated.
- This time around financial markets are probably even more interconnected and more global.
- Consequently, this could be an Asian Crisis-like sell-off, but one not only confined to Asia.
 Since end-January 2018:
- World private sector liquidity has fallen by some US$3 trillion,
- Roughly two thirds of the drop comes from the Developed economies,
- World Central Bank liquidity has fallen by another US$1.1 trillion,
- Two-thirds of its drop was recorded in Emerging Markets, paced by their large foreign reserve losses.
- Added together, Global Liquidity has in total fallen by just over US$4 trillion to US$124.1 trillion.
- This 3% drop looks more serious when set against its 7% ‘normal’ trend. Put another way, after its brief recovery Global Liquidity has fallen back again to stand some 25% below its long-term trend.
Systemic risks rise if debt cannot be re-scheduled.
- We will enter 2019 with Global Liquidity tumbling at its fastest rate since the 2007/08 Financial Crisis
- Global Liquidity falling at its fastest rate since 2007/08 Crisis
- Over-zealous Central Banks are largely to blame. Not a broken banking system like 2007/08 Crisis
- Squeeze evidenced by flat yield curves and negative ‘real’ term premia
- In the US, the impact of ‘reverse’ QE is equivalent to another 10 rate hikes
- Central Banks have an outsized-effect in deregulated financial systems, where retail deposits are not the sole funding source, because what matters most is the ability to re-finance positions and at the margin Central Banks are the marginal suppliers of liquidity.
- We expect a major policy easing in 2019. However, only China’s PBoC (People’s Bank) among the majors is so far easing monetary policy. We anyway see China as leading this cycle. The US Fed is likely to follow given the scale of tightness in domestic and Global Liquidity and this must involve greater liquidity injections, rather than simply interest rate cuts. We have no view whether this takes the formal shape of an explicit ‘QE4’ policy or if it involves an unannounced increase in the size of the Fed’s balance sheet.
The immediate implications will be a yield curve steepening and ultimately a weaker US dollar.
Financial shares and Emerging Markets may prove the main beneficiaries.
WE WITNESSED THE YIELD CURVE GOING NUTS IN YEAR-END LIQUIDITY CHAOS
 Confirming the need for cash, on the last day of 2018, 17 counterparties took only $41.8BN at the Fed’s overnight reverse repo operation on Monday which was the second-smallest quarter-end usage since the RRP was created in 2013, and suggesting that instead of padding books with cash-equivalent securities to satisfy regulatory requirements, banks were suddenly strapped for cold, hard cash.
- Clearly there was something amiss with year end liquidity prompting questions if there were broader year-end liquidity plumbing issues in the market than just traditional window dressing.
- In yet another bizarre manifestation of year-end liquidity events, on Monday shortly after a 52-week Bill auction priced amid unremarkable results, the short-end of the curve inverted dramatically, with the yield on the 1Y finding itself more than 10bps higher than the 2Y.
- The yield on the 52-week Bill closed Friday at 2.5986%, higher than the yield on the 7Y TSY which was at 2.5869%, meaning the 1s7s was inverted.
- The last time the 1s7s curve inverted? The same time the overnight repo rate surged as much as it did on Monday - back in early 2001,
- One reason cited for the bizarre shape of the yield curve was the bond market's confusion about what the Fed will do, with the short-end still anticipating perhaps one or more rate hikes, while the longer-end increasingly pricing in deflation, rate cuts and, eventually, QE, although since both of those expectations are what makes up the shape of the yield curve by definition, that explanation was left wanting.
DIGGING DOWN ON WHY THE MARKET'S RECENT RECORD LIQUIDITY COLLAPSE
- Whatever the reason behind the record collapse in liquidity, whether it is:
- The dominance of HFTs who all liquidity when it is not needed and soak it up when there is virtually non, or
- Broken markets with countless exchanges as algos scramble to front run each other in normal days but lead to a trading panic during volatile days, or
- The lack of active market makers due to bank regulation which has forced dealers to shore up liquidity, or
- ETFs which collectively all decide to sell at the same time overpowering the market's thinning top-level liquidity, or
- Simply the result of central bank balance sheet shrinkage,
The reality is that the problem is not going away and will only get worse as the bear market unfolds and as market volatility explodes.
 The depth of the S&P 500 futures market has thinned by 70% over the past year to the lowest on record as single stock liquidity has fallen 42% over the past year to some of the lowest levels since the crisis.
- A common complaint is that passive funds sap liquidity when pressed into "harmonized action" and that their selling overwhelms high-frequency market makers - a theory that academic research is skeptical of. Other critics cite post-crisis regulations that made it costlier for banks to hold positions.
- Spreads have widened because of the market’s changing structure, -- “You’ll see a price on your screen of a stock down 30 dollars and you go to buy it and there’s no volume to buy it. And next thing you know it’s back to flat,”. At the same time, “we decide that we’re going to get out of half a million shares, and the thing only trades 300,000 shares a day and we put it out there in some dark pool, and it’s gone in."
- Share totals on U.S. exchanges have regularly exceeded 9 billion in the last few weeks, which skeptics highlights as an indication that liquidity is actually relatively stable. It's not just common stock: the average volume in puts and calls surged 22% this year as the S&P 500 Index endured two corrections and a near bear market. At 20 million contracts a day, trading is poised to surpass the previous record of 18 million reached in 2011
- As the decade-long equity bull run is ending, liquidity risk - the possibility markets will struggle to absorb selling demand without large price moves - has been mentioned by everyone from Goldman Sachs to Donald Trump.
- The market's fragmented and often broken structure and the collapse in market liquidity ever since 2009 - and predictably increase when markets are in free fall as they have been recently. "rarely have they gotten a bigger test than in the last few weeks."
"Ever feel like the smallest order gets to push the Emini around like a toy? It's not just a feeling: it's the truth, not only is the Emini futures top-of-book depth worse now than it was in the highest-vol weeks of October, it is also worse than it was during the record VIX surge in February.... In fact, the top Emini orderbook has never been worse."
- Goldman's John Marshall: The problem of collapsing liquidity isn’t structural or related to HFT or ETFs, but can be explained by simple risk aversion among professional investors rather than the growth in electronic trading,
- Goldman's Chief Markets Economist Charlie Himmelberg: Said back in May when the Goldman strategist warned that HFTs – due to their inability to process nuanced fundamental information - may trigger surprisingly large drops in liquidity that exacerbate price declines, and result in flash crashes. Himmelberg highlighted the growing market share of HFT and algorithmic trading across all markets, and warned that the growing lack of traditional, human market-makers has made the market increasingly fragile.
- Goldman’s co-head of Global Equities Trading, Brian Levine: Doubled down on his concerns about the illiquid market, and in an internal Goldman interview published this past June, one of the world's most influential traders said that there is one aspect of that the current broken market structure that keeps him up at night. As he admitted in the interview, “what’s more worrisome to me is a real flash crash, which I define as a situation when the market “breaks.”
There will come a day “with actual bad news” when the selling onslaught is so broad, not even BTFD HFTs will be able to resist the sudden avalanche of selling. That’s the day when the increasingly fragile market, one in which “liquidity is the new leverage” will officially break and stocks will “trade outside of the NBBO constituting a genuine flash crash” in a “negative feedback loop that causes more volatility.” A selloff from which there will be no “snap back.”
MARKETS ARE ALL ABOUT FLOWS
CREDIT CYCLE - Initially Credit Cycle Inflates then Subsequently Deflates (Drains) Financials
- We must assess the pace of monetary expansion (Supply) relative to the Demand for money and credit, and where that expansion goes.
- The important effect of the evolving credit cycle is that it begins to limit the flow of new money into financials, relative to the money exiting into the non-financial economy. It is the balance of these flows which basically determines market values as a whole.
- Early in the credit cycle, there is little demand from the non-financial sector for monetary expansion, so excess money and bank credit go into the financial sector, pushing up financial asset prices.
- As business conditions in the real economy start improving, just as valuations begin to be vindicated, interest rates and bond yields start rising and shares enter a bear market.
- Money draining from financial markets has the same effect as air draining from a leaking balloon. They deflate, and taken as a whole, prices of both bonds and equities persistently decline.
STIMULUS DEFICIT SPENDING - A Travesty of On-Going Abuse
- In a conventional Keynesian economic model, the government stimulates the economy by deliberately engineering a budget deficit early in the cycle. As economic activity recovers, tax revenues improve, and government finances return to a surplus. Therefore, according to Keynes’s theory, demand for capital evens out over the cycle as a balance is restored towards the end of it.
- Whatever one thinks of Keynesian interventionism, the abuse by the US Government of Keynes’s theory of the state’s management of the economy is truly staggering, and seems set to drive it into a debt trap that can only result in either a severe retrenchment of state spending or the eventual destruction of the state’s currency.
- The accumulated budget deficits since 2000 total $12.454 trillion and government debt has increased from $5.674 trillion to $21.516 trillion.
An acceleration of debt supply from the US Government is likely to dominate global investment flows and financial valuations in the next decade
HIDING THE ABUSE - The Government Shell Game or Effectively Ponzi Scheme
- FALSE INFLATION REPORTING: Governments have benefited through the suppression of interest rates.
- EXTERNAL UNFUNDED WELFARE OBLIGATIONS: When considering the US Government’s debt, it must be noted that roughly one-third is held by the government itself in accounts such as the Social Security Trust Fund. However, they represent funding of external welfare obligations, so are external liabilities for the Federal Government.
 REINHART & ROGOFF - Government Debt is Bleeding Available Productive Capital
- Illustrative Example:
- $100B Economy with $90B Government Deficit
- Interest Rates normally 4-6%, while GDP Growth is normally 2-3% (Assuming a valid 'Deflator' is used or GDP Growth is much smaller - See Thesis 2017 - "Illusion of Growth")
- 5% of $90B is $4.5B while 3% of $100B is $3B. Therefore $3 - $4.5 = - 1.5$ or 50% of Growth
- Therefore when Government Debt is > 90% the government's debt burden outstrips economic growth.
- In fact it is worse since Tax Receipts fall as a result of government bleeding capital from the system which is not available for productive investment.
- The signals from financial markets today indicate that we could be on the verge of a new credit crisis, in which case
- Tax revenues will again fall below existing estimates, and
- Welfare costs rise above them.
- Therefore, government debt will increase unexpectedly, as was the case that caused the Reinhart-Rogoff paper to be published in 2010.
- We should look at two possible outcomes:
- First, a best case where price inflation continues to be successfully managed with a target rate of two per cent, and
- A second base case incorporating an estimate of the effects of the next credit cycle on government finances.
DEBT TRAP - A Fiat Currency Collapse & Potential Crack-Up Boom
- US Government debt will increase at a faster pace than the growth in GDP and will strangle economic activity.
- If the purchasing power of the dollar declines more rapidly than implied by the CBO’s assumed 2% price inflation target, interest payable on Federal debt will in turn be sharply higher than expected, compounding the debt problem.
The Federal Government will face a potentially terminal debt trap from which there can be no escape.