THE HEADLINE: Worst October For Junk Bonds Since 2008 As Yields Surge
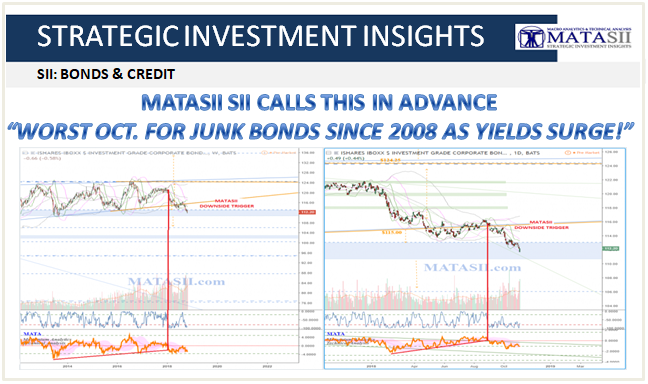
MATASII SII ANALYSIS: LQD Corporate Bond ETF IDEA - March 4, 2018: The weekly (left) chart for LQD shows a significant lift from $78.00 in 2009; topping around $124.00 in 2012; and moving sideways in a slightly contracting wedge since. The boundaries of the wedge pattern offer technical trigger considerations when reached (highlighted with solid orange). The market is currently on its way to the lower support of the pattern and a bounce or beak of the patterns s/r trend line could be an indication for the next move: either the pattern is broken and the market is shifting to a new wave / pattern; or it holds and the contracting wedge continues.
Once broken to the down side it is technically possible to see this market move back to the lows of 2009. Several significant technicals can be seen on the way down, blue s/r zones and Fibonacci retracement levels, and all can be used for technical trigger or target considerations. Market reactions can be seen from these levels in the past, we should watch them for the same possibilities in the future.
IF we see the wedge patterns supporting trend line hold and the market lift again, then the upper pattern resistance offers technical trigger considerations for more lift (if broken) or another down to continue the pattern (if bounced from). IF broken, it is possible to see another lift similar to the lift from 2009 - 2012, potentially taking the market up another $50.00 (from the base of wedge pattern) to around $163.00.
On the daily (right) chart a few green (daily) s/r zones can be seen at levels where market reactions occurred in the past. These can be used for shorter term movements, expecting the market to continue to bounce between them in some fashion.

... making it the worst performing sector in the Bloomberg Barclays HY Index:

Furthermore, this was the biggest one-month move wider in energy HY spreads since the E&P crisis of December 2015/January 2016, when energy junk bonds blew out, as many shale companies defaulted on their debt.

And, according to Bloomberg, after a period of surprising resilience which saw junk spreads touch the narrowest since the financial crisis as recently as a month ago, October was the worst month for junk bonds since 2008.
October has been positive for high-yield bonds in every year since 2008, when the market tumbled almost 16 percent in the month.
And while October has been typically a good month for high yield, this month is on track for the biggest loss since December 2015 as equity volatility, economic fears, earnings and trade worries weigh.

After months of outperformance, U.S. high yield finally cracked, generating a -1.81% return in October, making it the second-worst performer of all the main bond market indexes and exceeded only by the 1.87 percent decline for global high yield.
The October rout wiped out more than two-thirds of all high yield YTD gains, and while the sector is still up 0.72% in 2018, it is well short of the 2.57% racked up by the close on Sept. 28. The former star performer in the space, the "triple hooks" or CCC rated bonds, gave up half their YTD gains, and were up by 3.07%, compared to a 6.24% return at the end of last month. Meanwhile, investment grade bonds are now well in the red for the year, losing 3.5% after a 1.2% drop this month.
Meanwhile, as yields have continued rising on the back of the Fed's higher rates, yields have moved to increasingly daunting levels, with the average "high" yield rising to almost 7%, up from about 5.5% at the start of this year, and the highest since July 2016. Meanwhile, yields on CCC companies have once again crossed the 10% mark for the first time since January 2017.
While the CCC space has long been a favorite of momentum-chasing credit investors, yields are now high enough to where they may impair cash flows, and will certainly make it more costly for lower-quality companies to raise new funds and pay down or refinance existing debt.

Still, alongside most other asset classes, Bloomberg notes that while junk bond yields rose as returns plummeted, "there has been no panic selling." And, as has so often been the case, investors who were just waiting for the turn, now say the recent drop is a buying opportunity, citing strong credit fundamentals, low default rates and a steady economy as factors favoring junk bonds.
They will continue repeating this until the next junk bond selloff, when the liquidation may not be quite so orderly.