MATASII'S PROPRIETARY "MATA INDICATOR" CALLED THE CORPORATE INVESTMENT GRADE SELLOFF
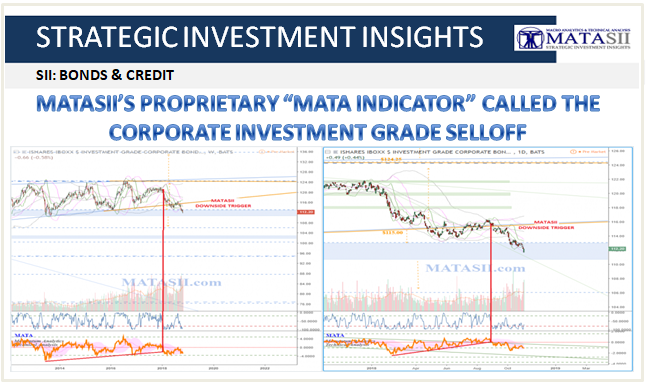
MATASII SII ANALYSIS: LQD Corporate Bond ETF IDEA - March 4, 2018: The weekly (left) chart for LQD shows a significant lift from $78.00 in 2009; topping around $124.00 in 2012; and moving sideways in a slightly contracting wedge since. The boundaries of the wedge pattern offer technical trigger considerations when reached (highlighted with solid orange). The market is currently on its way to the lower support of the pattern and a bounce or beak of the patterns s/r trend line could be an indication for the next move: either the pattern is broken and the market is shifting to a new wave / pattern; or it holds and the contracting wedge continues.
Once broken to the down side it is technically possible to see this market move back to the lows of 2009. Several significant technicals can be seen on the way down, blue s/r zones and Fibonacci retracement levels, and all can be used for technical trigger or target considerations. Market reactions can be seen from these levels in the past, we should watch them for the same possibilities in the future.
IF we see the wedge patterns supporting trend line hold and the market lift again, then the upper pattern resistance offers technical trigger considerations for more lift (if broken) or another down to continue the pattern (if bounced from). IF broken, it is possible to see another lift similar to the lift from 2009 - 2012, potentially taking the market up another $50.00 (from the base of wedge pattern) to around $163.00.
On the daily (right) chart a few green (daily) s/r zones can be seen at levels where market reactions occurred in the past. These can be used for shorter term movements, expecting the market to continue to bounce between them in some fashion.