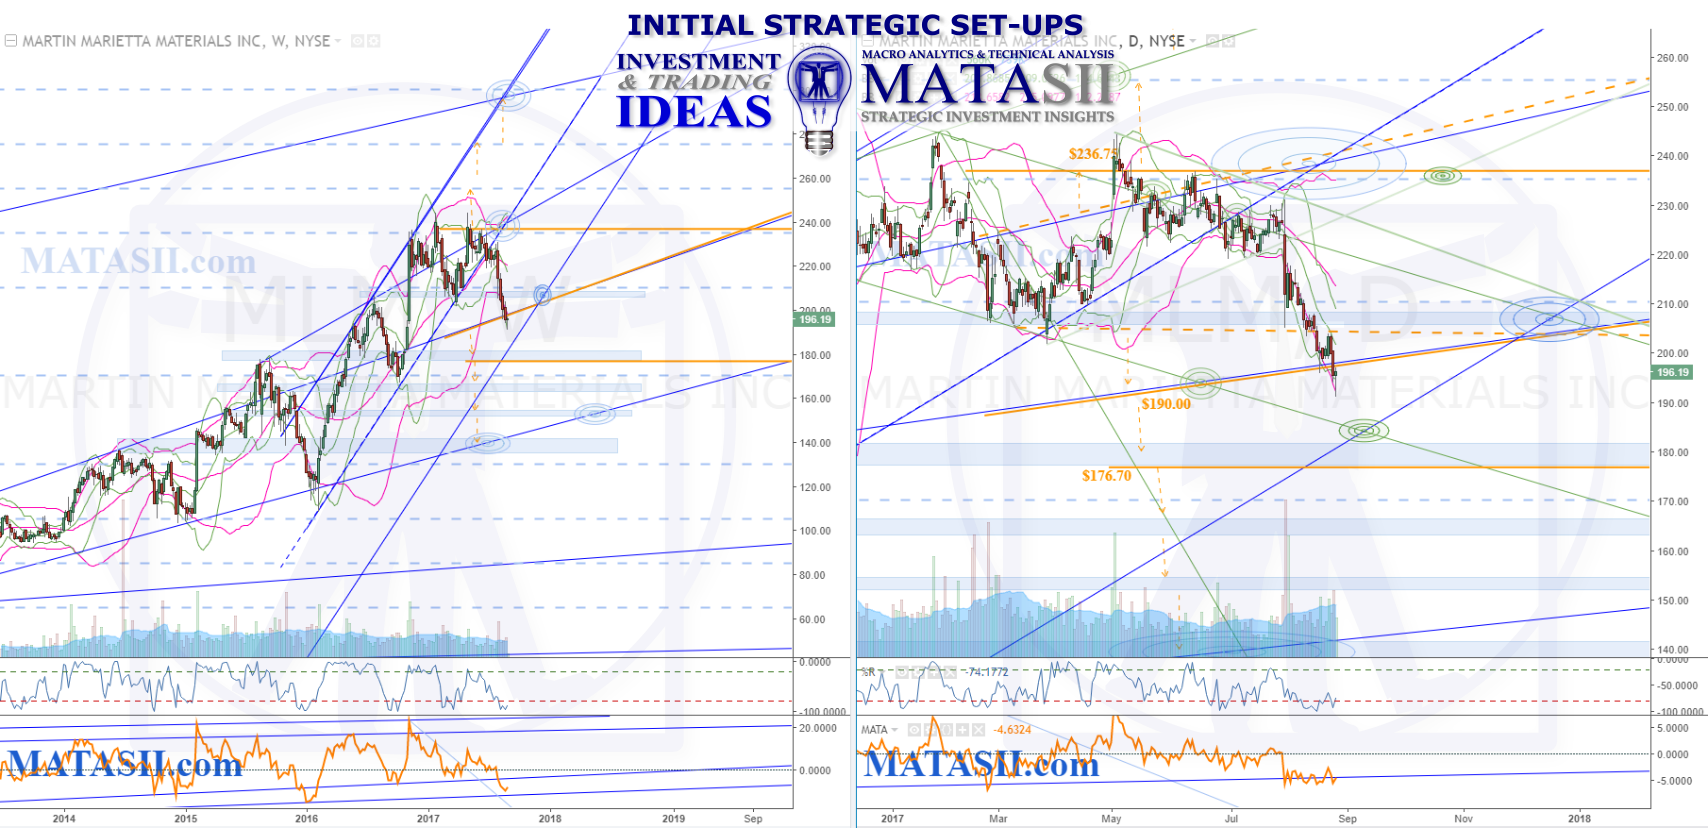
The weekly chart on the left shows a potential double top for MLM. The latest drop has moved the market to the s/r of the previous pattern, where we can see on the daily chart (right) that it has just broken through. Watching to see if support is found here, or if it will continue lower. IF the market continues to drop off we would be looking to the next blue s/r zones below for the next market reactions. Holding or breaking these offer potential opportunities for a move to the next. It is technically possible for the market to be looking for the bottom support of the previous pattern, or even the lows of 2015 and 2016. Note the lift on the left has a bounce and zigzag movement - we could again see something similar on the way down, at the very least some kind of correction would be expected.
IF support is found and the market lifts back above the larger weekly pattern - lifts back above the current support/resistance (s/r) trend line - then we would be watching for signs of a continuation of the previous up trend. Waiting for the market highs and the double top to be lifted over would offer the least risk opportunity, however several other technicals can be seen on the way up that could also offer potential opportunities, depending on your risk tolerance.
Note the blue dashed Fibonacci levels: the market has been "roughly" following them and these can also be used as technical trigger considerations as the market moves between them. Note that all turns in the market don't necessarily occur right at the Fibonacci levels exactly, however the can be used as guides when combined with patterns : ie. watching for a reversal pattern near a Fibonacci level, as opposed to reacting to just a touch of the level on its own. Combing even further technical considerations (ie. W%R timing) can also help to increase your odds.