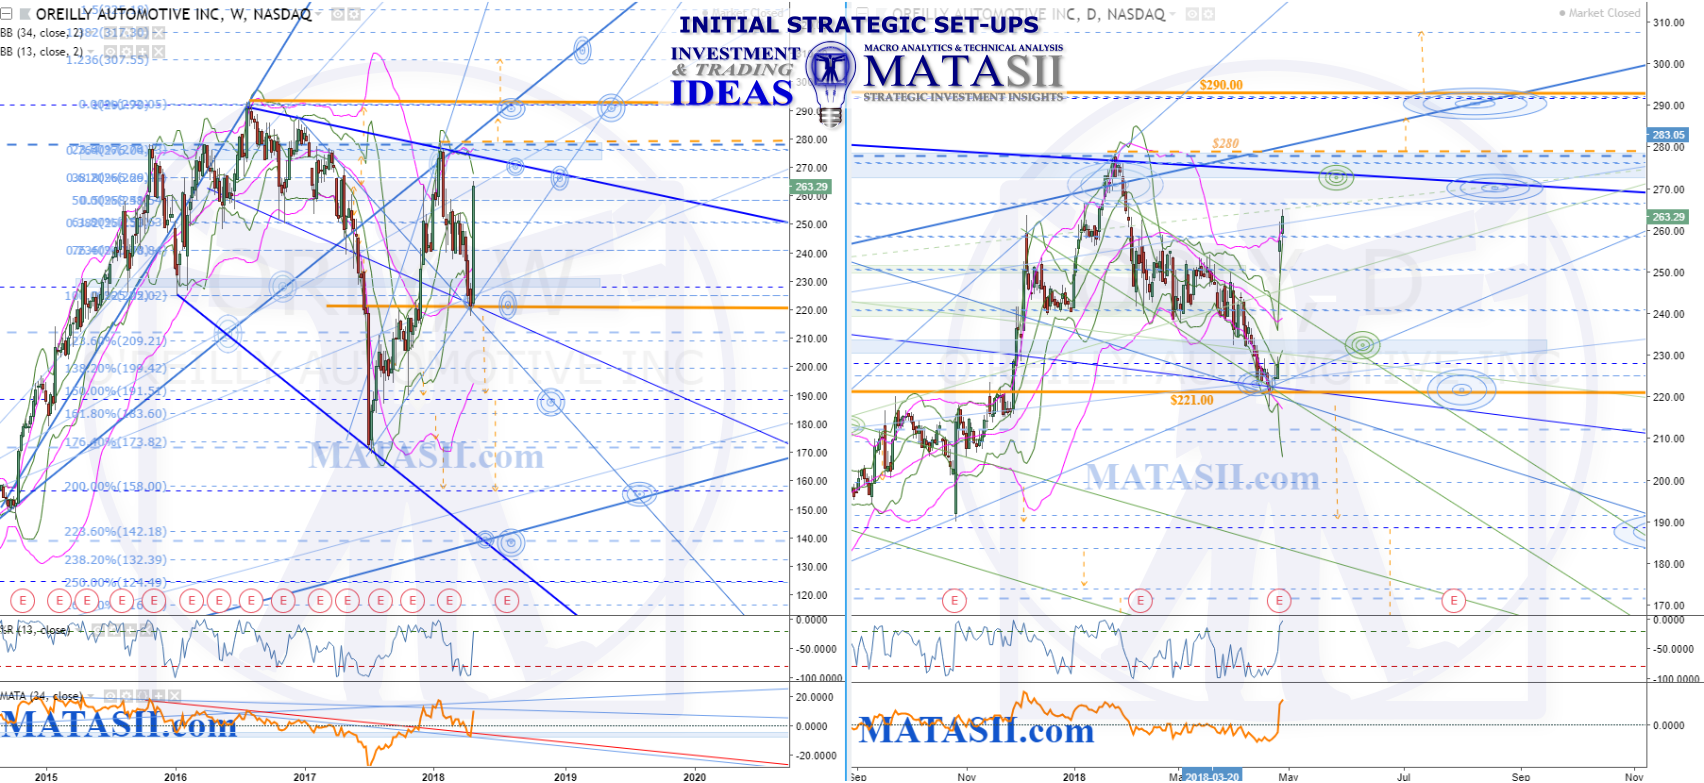
The potential pattern for ORLY since it started falling off in 2016 appears to be unfolding as an expanding wedge (weekly chart left). The current market is approaching the resistance for the pattern as well as previous highs and these offer potential opportunities when broken or bounced off of. IF we see a break up past previous highs then we could have a continuation of the previous strong positive trend. IF the pattern or previous highs hold and the market falls off from them, then we could see the next down leg of the larger weekly expanding wedge pattern.
Solid orange highlights the the last significant highs and lows to watch for breaks or bounces. There is a significant range between the two that can be taken advantage of, however be wary that the market could continue to bounce around inside of this from any of the technicals that can be seen.
One potential strategy as an example: IF the market does hold the pattern or previous highs and starts to fall off again, we could go short watching for a potential drop and continuation of the pattern - there is a potential for a significant move down past the last lows of $170.00. The trigger considerations for this are a bounce off the pattern or previous highs, and these are also our potential stops - if the market drops a little lower but finds support and bounces, we would want to be out if our significant trigger considerations were then broken to the up side. This could get us in at a significantly better price than waiting for a break of the lower highlighted technical of $221.00.... however it needs to be watched closely for any support and there is a potential to see another bounce around the $221 level.