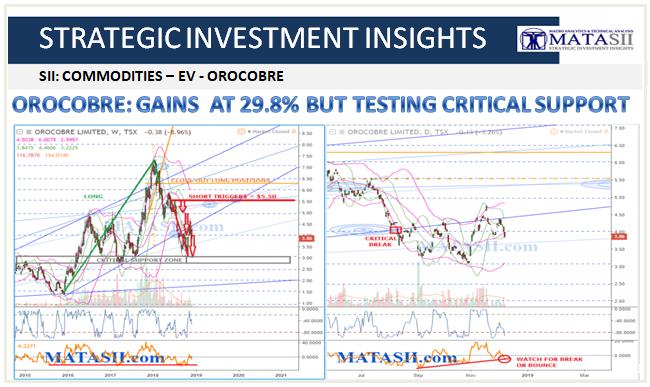
OROCOBRE: GAINS AT 29.8% BUT TESTING CRITICAL SUPPORT
ORL CHART AS OF CLOSE 12-07-18
![]()
Business Summary (Yahoo Finance))
Orocobre Limited explores for and develops lithium and potash deposits in Argentina. Its flagship project is the Salar de Olaroz lithium project located in north-west province of Jujuy. The company also produces boron minerals and refined chemicals. Orocobre Limited is based in Milton, Australia.
MATASII WATCH LIST TRIGGERS / GAINS: 29.8%
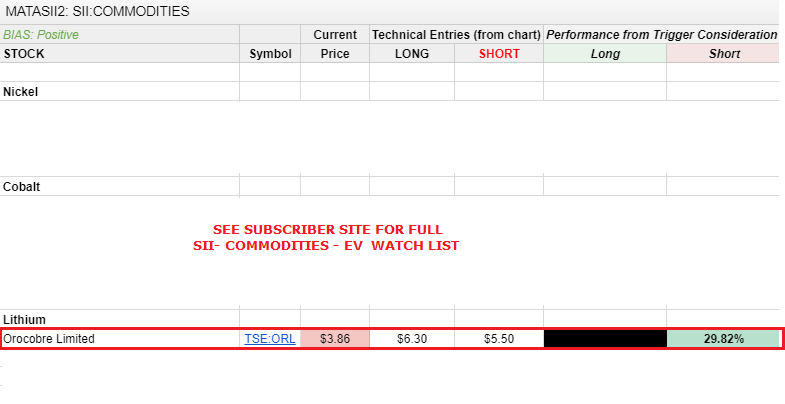 INITIAL ORL.TO Orocobre Ltd. IDEA: November 30th, 2017
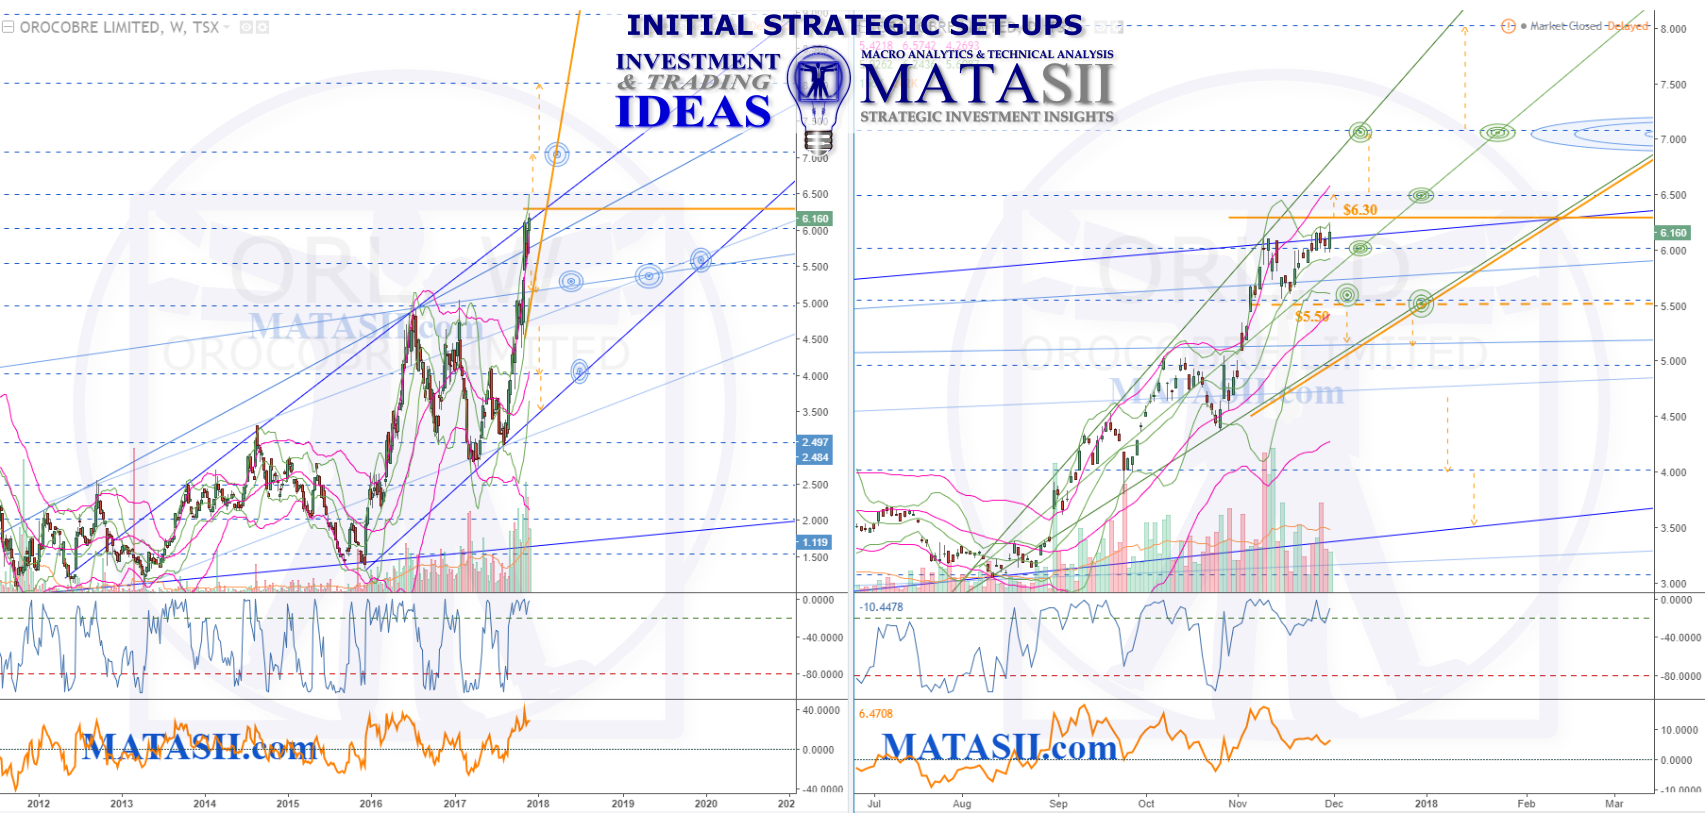
ORL has had two strong lifts in 2016 and 2017, taking the market from $1.50 to $6.00. On the weekly chart (left) we can see those two lifts as part of a large channel, with the current market sitting a the top channel resistance. This is a critical technical area and offers potential opportunities for a consolidation and possible pullback, or a break up through the weekly pattern.
The daily chart (right) gives us a closer look at the recent rise in ORL since Aug. of this year. The lift can be bound within an expanding wedge pattern (green): note the market has recently come off the resistances of both the green daily wedge as well as the weekly blue channel. At this point the market appears to still be testing the blue channel s/r, consolidating around it.
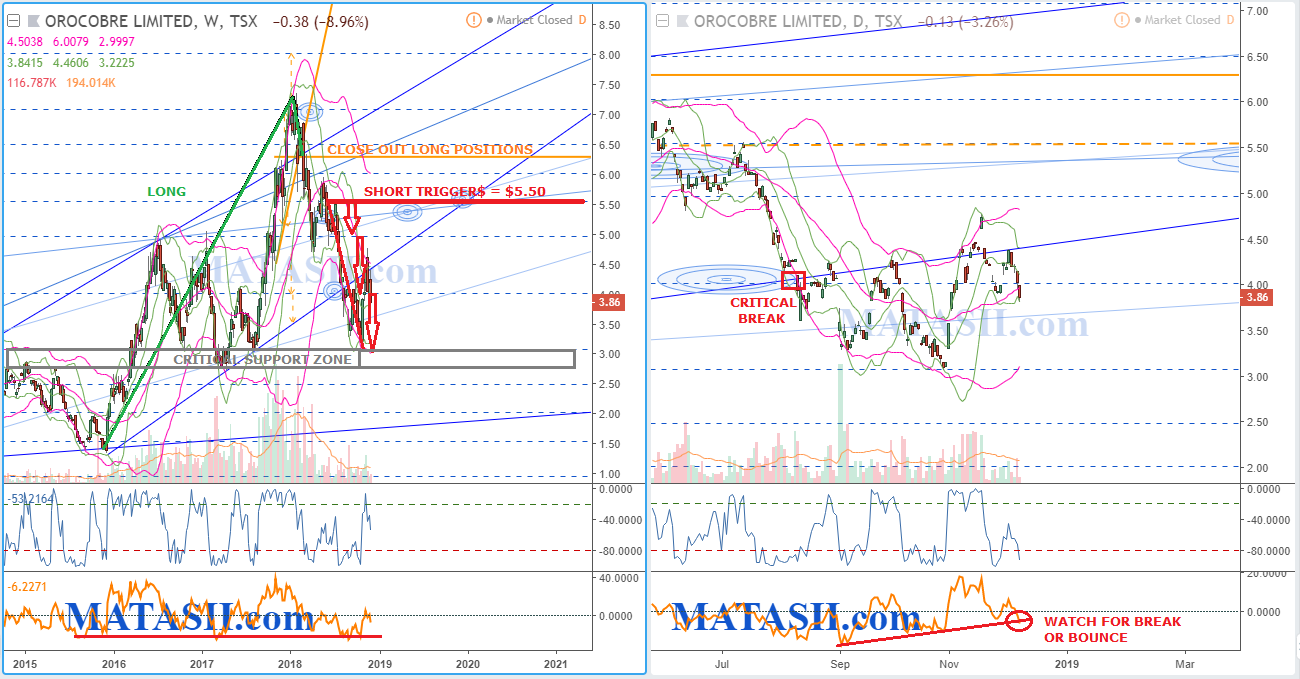
Orange highlight lines offer potential technical trigger considerations if we seen them broken. Any further lift and we could be seeing a continuation of the positive trend and a break from the blue weekly channel. Watch the Fibonacci levels (blue dashed) and the green s/r resistance from the expanding wedge: these could hold the market; a retest of the blue channel s/r would be normal market movement.
On the down side, I have the recent support (Fibonacci level) marked with a dashed highlight, indicating more potential risk. This is because we would like a break of the green expanding edge pattern to confirm a down move; the wedge itself has a solid highlight. What we would really like to see is the market down below both, however that occurs. Either of them could potentially hold the market and bounce it to continue the current trend. Once they are both broken the odds increase that more down is likely, even if just to the next significant technicals. Potentially we could see a move back to the bottom weekly channel support.