TIPPING POINTS
- A
[SITE INDEX -- TIPPING POINTS - GLOBAL GOVERNANCE FAILURE]
A PUBLIC SOURCED ARTICLE FOR MATASII
READERS REFERENCE: (SUBSCRIBERS & PUBLIC ACCESS)


MATASII RESEARCH ANALYSIS & SYNTHESIS WAS SOURCED FROM:
SOURCE: 03-25-19 - - "Capitalism Saved Sweden"
FAIR USE NOTICE This site contains copyrighted material the use of which has not always been specifically authorized by the copyright owner. We are making such material available in our efforts to advance understanding of environmental, political, human rights, economic, democracy, scientific, and social justice issues, etc. We believe this constitutes a 'fair use' of any such copyrighted material as provided for in section 107 of the US Copyright Law. In accordance with Title 17 U.S.C. Section 107, the material on this site is distributed without profit to those who have expressed a prior interest in receiving the included information for research and educational purposes. If you wish to use copyrighted material from this site for purposes of your own that go beyond 'fair use', you must obtain permission from the copyright owner.
NOTICE Information on these pages contains forward-looking statements that involve risks and uncertainties. Markets and instruments profiled on this page are for informational purposes only and should not in any way come across as a recommendation to buy or sell in these assets. You should do your own thorough research before making any investment decisions. MATASII.com does not in any way guarantee that this information is free from mistakes, errors, or material misstatements. It also does not guarantee that this information is of a timely nature. Investing in Open Markets involves a great deal of risk, including the loss of all or a portion of your investment, as well as emotional distress. All risks, losses and costs associated with investing, including total loss of principal, are your responsibility.
SII
- A
[SITE INDEX -- SII - FANGS & NOSH]
A PUBLIC SOURCED ARTICLE FOR MATASII
READERS REFERENCE: (SUBSCRIBERS-SII & PUBLIC ACCESS)
SII - FANGS & NOSH
MATASII RESEARCH ANALYSIS & SYNTHESIS WAS SOURCED FROM:
SOURCE: 03-12-19 - - "Commodities attempting breakout off 7-year support!"
FAIR USE NOTICE This site contains copyrighted material the use of which has not always been specifically authorized by the copyright owner. We are making such material available in our efforts to advance understanding of environmental, political, human rights, economic, democracy, scientific, and social justice issues, etc. We believe this constitutes a 'fair use' of any such copyrighted material as provided for in section 107 of the US Copyright Law. In accordance with Title 17 U.S.C. Section 107, the material on this site is distributed without profit to those who have expressed a prior interest in receiving the included information for research and educational purposes. If you wish to use copyrighted material from this site for purposes of your own that go beyond 'fair use', you must obtain permission from the copyright owner.
NOTICE Information on these pages contains forward-looking statements that involve risks and uncertainties. Markets and instruments profiled on this page are for informational purposes only and should not in any way come across as a recommendation to buy or sell in these assets. You should do your own thorough research before making any investment decisions. MATASII.com does not in any way guarantee that this information is free from mistakes, errors, or material misstatements. It also does not guarantee that this information is of a timely nature. Investing in Open Markets involves a great deal of risk, including the loss of all or a portion of your investment, as well as emotional distress. All risks, losses and costs associated with investing, including total loss of principal, are your responsibility.
RESEARCH
[SITE INDEX -- MATA - FUNDAMENTALS - EARNINGS]
READERS REFERENCE (SUBSCRIBERS-RESEARCH & PUBLIC ACCESS )
MATA: FUNDAMENTALS - EARNINGS
MATASII RESEARCH ANALYSIS & SYNTHESIS WAS SOURCED FROM:
SOURCE: 04-12-19 - NBC News - "Twice as many companies paying zero taxes under Trump tax plan"
FAIR USE NOTICE This site contains copyrighted material the use of which has not always been specifically authorized by the copyright owner. We are making such material available in our efforts to advance understanding of environmental, political, human rights, economic, democracy, scientific, and social justice issues, etc. We believe this constitutes a 'fair use' of any such copyrighted material as provided for in section 107 of the US Copyright Law. In accordance with Title 17 U.S.C. Section 107, the material on this site is distributed without profit to those who have expressed a prior interest in receiving the included information for research and educational purposes. If you wish to use copyrighted material from this site for purposes of your own that go beyond 'fair use', you must obtain permission from the copyright owner.
NOTICE Information on these pages contains forward-looking statements that involve risks and uncertainties. Markets and instruments profiled on this page are for informational purposes only and should not in any way come across as a recommendation to buy or sell in these assets. You should do your own thorough research before making any investment decisions. MATASII.com does not in any way guarantee that this information is free from mistakes, errors, or material misstatements. It also does not guarantee that this information is of a timely nature. Investing in Open Markets involves a great deal of risk, including the loss of all or a portion of your investment, as well as emotional distress. All risks, losses and costs associated with investing, including total loss of principal, are your responsibility.
THESIS
- A
[SITE INDEX -- THESIS 2019: DE-DOLLARIZATION]
A PUBLIC SOURCED ARTICLE FOR MATASII
READERS REFERENCE: (SUBSCRIBERS-THESIS & PUBLIC THESIS ACCESS )
THESIS 2019: DE-DOLLARIZATION
MATASII RESEARCH ANALYSIS & SYNTHESIS:
SOURCE: 03-12-19 - - "Commodities attempting breakout off 7-year support!"
FAIR USE NOTICE This site contains copyrighted material the use of which has not always been specifically authorized by the copyright owner. We are making such material available in our efforts to advance understanding of environmental, political, human rights, economic, democracy, scientific, and social justice issues, etc. We believe this constitutes a 'fair use' of any such copyrighted material as provided for in section 107 of the US Copyright Law. In accordance with Title 17 U.S.C. Section 107, the material on this site is distributed without profit to those who have expressed a prior interest in receiving the included information for research and educational purposes. If you wish to use copyrighted material from this site for purposes of your own that go beyond 'fair use', you must obtain permission from the copyright owner.
NOTICE Information on these pages contains forward-looking statements that involve risks and uncertainties. Markets and instruments profiled on this page are for informational purposes only and should not in any way come across as a recommendation to buy or sell in these assets. You should do your own thorough research before making any investment decisions. MATASII.com does not in any way guarantee that this information is free from mistakes, errors, or material misstatements. It also does not guarantee that this information is of a timely nature. Investing in Open Markets involves a great deal of risk, including the loss of all or a portion of your investment, as well as emotional distress. All risks, losses and costs associated with investing, including total loss of principal, are your responsibility.
CHART
SUBSCRIBER CONTENT ONLY - Now Available as "Pay-Per-View" for Non-Subscribers
OPTION #1
THE HEADLINE: "CARS HAVE BEEN CRUSHED": THE US AUTO MARKET IS OFFICIALLY IN RECESSION - AGAIN!
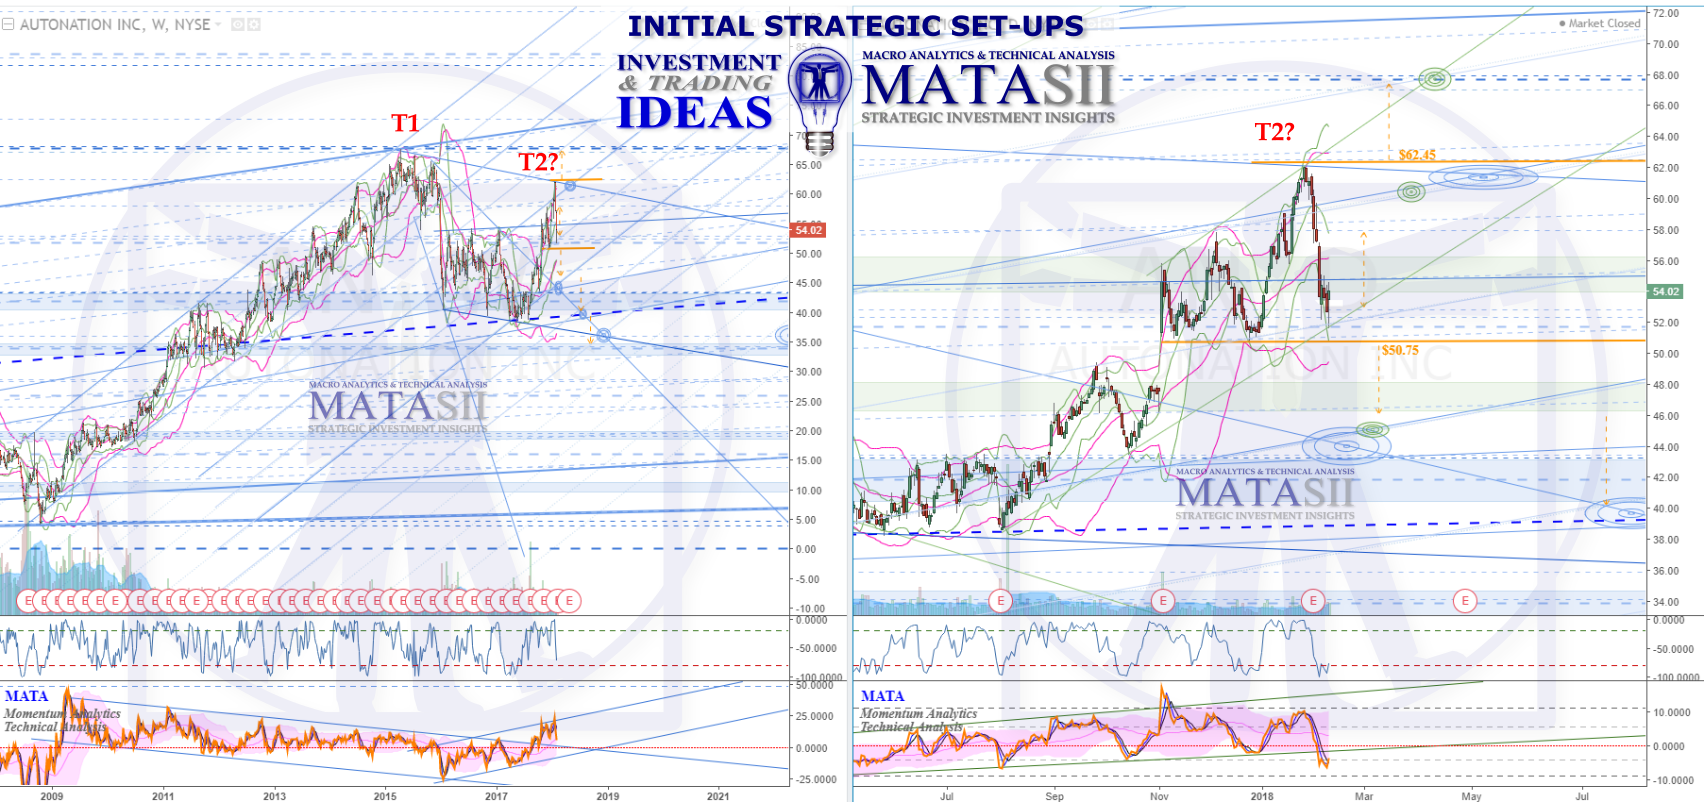
MATASII SII ORIGINAL ANALYSIS: FEBRUARY 12th, 2018 CALL:
The long term weekly view (left chart) shows a potential double top : T1 and T2?. The second top is not confirmed yet - the market could still lift higher - however it is setting up for a potential topping. IF the 2nd top is in, then we could see a dramatic fall off in the market. Note the left hand bottom of the weekly chart: in 2009 AN was sitting around $10. Technically we could see a drop back to those levels again. Note as well the blue (weekly) channel T1, T2?, and the bottoms from 2016/17 form. IF T2? is in then we would expect a move back down to the bottom channel support, where we would be watching for support or break of the channel.
The daily chart (right) looks closer at the recent highs and T2?. T2? is part of an expanding wedge pattern that fits inside a potential green (daily) channel. Until the lows of the wedge pattern have been broken down under, it is technically possible to see another bounce and a lift higher than T2?.
Orange highlights potential technical trigger considerations: under $50.75 for a break lower; above $62.45 for a break higher and potential continuation of the previous up trend. The range inside has many potential trigger consideration as well, however risk is increased until we know which way this market is going to break.
Our MATA indicator is suggesting that the momentum that has been moving the market since Jul 2017 is potentially shifting/breaking to the down side: the daily (right) has momentum potentially broken support and coming back to retest. We shall see if it breaks back up or finds resistance and continues to fall off. At this point it is suggesting that market momentum may have already shifted and price is still to follow.... Also for consideration is the apparent divergence between price and the MATA indicator. The top peak of the MATA indicator occurs at the start of the expanding wedge pattern on the price graph; the peak in price occurs at T2? however the MATA indicator is lower.
Initial Chart Supporting Above Analysis:

THE BREAKING NEWS STORY:
"Cars Have Just Been Crushed": The US Auto Market Is Officially In Recession Again
Despite surprisingly strong 2018 results and 2019 estimates out of General Motors last week, it’s becoming clearer that a recession in the U.S. auto industry is already underway. All one has to do is look around: factories are closing, shifts are being truncated and thousands of layoffs have taken place.
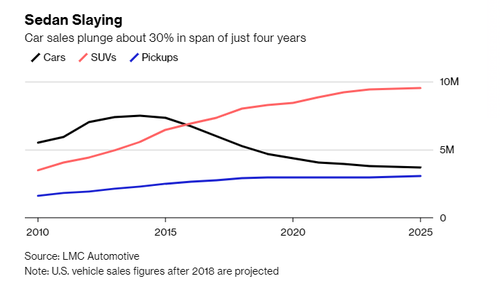
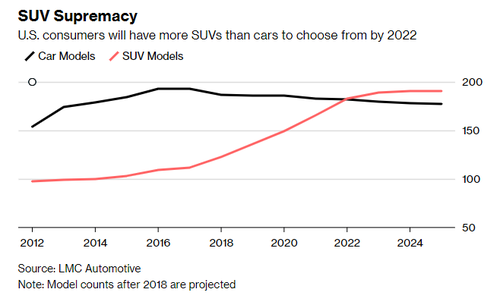
Meanwhile, Detroit is showing increasingly more signs that it is in the midst of a recession as demand for sedans has collapsed. This collapse has been the result of most consumers moving to sport utility vehicles and pick-ups. In fact, the models that used to be the lifeblood of the car industry, sedans like the Honda Accord and Ford Fusion, only made up 30% of US sales in 2018.
Sedans are estimated to sink to 21.5% of the US market by the year 2025, according to research from LMC Automotive. That will leave car manufactures with extra factory capacity that will be capable of producing some 3 million more vehicles than buyers want. This type of overcapacity has resulted in losses and has catalyzed past recessions for the industry.
Jeff Schuster, senior vice president of forecasting at LMC Automotive, simply told Bloomberg: "You could classify this as a car recession."
As a result, the mood at the upcoming North American International Auto Show in Detroit this week should be a key indicators. The car show is being moved to the summer next year in an attempt to try and re-establish its relevance, as car dealers who are attending this January won’t include once notable attendees as Mercedes-Benz, BMW and Audi. Why? Perhaps because Morgan Stanley analyst Adam Jonas recently predicted that manufacturers will use the Auto Show as an opportunity to lower guidance.
Meanwhile, as we said last Friday when GM raised its guidance, we were skeptical about any material upside, and we remain skeptical.
"We're not sure if Barra is only raising guidance now to (double) cut it later, or perhaps betting on a timely resolution to the trade war (or maybe both), but it's tough to feel like there isn't much more here than what meets the eye," we noted on Friday. The total overcapacity by US auto makers is the equivalent of 10 extra plants, according to Bloomberg. This would account for at least 20,000 potential jobs being scrapped; this means that more cuts are on their way. Jeff Schuster continued: “GM has taken some actions, but they still have some well-underutilized plants. So we may not be done with this yet.”
Traditionally when this kind of problem has arisen, automakers have taken sedans and stuffed them into rental lots and commercial fleets. Now, that tactic is only serving to add to the current capacity crisis. Fleet channels are already stuffed: these sales helped inflate the market over the last few years, even though individual retail sales peaked three years ago.
Mark Wakefield, head of the automotive practice at distressed turnaround consultant AlixPartners stated: “The car recession and the retail recession have already arrived in the sense that retail sales peaked in 2015 and have gone down ever since. Cars have just been crushed.”
And again, crossover SUVs are getting the blame. Some of the issue is attributed to the fact that SUVs now get almost as good of fuel mileage as sedans. The Chevy Equinox, for instance, only gets one mile less per gallon than the Chevy Malibu, a popular sedan.
But outside of Detroit, executives at companies like Toyota are sticking out with sedans. Jim Lentz of Toyota North America said: “We are not going to get out of that business [making sedans]. We still see an opportunity there.”
Interestingly, the wide adoption of sedans was a result of the last automotive recession. When gas prices were much higher and the industry last had to go through layoffs and plant closings, many of the Detroit factories changed from making SUVs to making sedans, using gas mileage as a selling point. But now, with fuel costs no longer a prohibitive factor, that cycle has turned once again.
OPTION #2
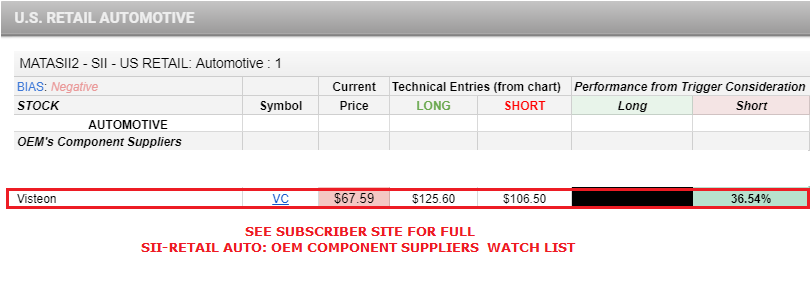
CLIFFS UP 25% SINCE YE 2018 AS INFRASTRUCTURE BEGINS TO DRAW ATTENTION AGAIN
Business Summary(yahoo Finance)
![]() Cliffs Natural Resources Inc., a mining and natural resources company, produces and supplies iron ore. The company operates five iron ore mines in Michigan and Minnesota; and Koolyanobbing iron ore mining complex located in Western Australia, which produces lump and fines iron ore. It also own two iron ore mines in Eastern Canada. Cliffs Natural Resources Inc. sells its iron products to integrated steel companies and steel producers in the United States, China, Canada, and internationally. The company was formerly known as Cleveland-Cliffs Inc. Cliffs Natural Resources Inc. was founded in 1847 and is headquartered in Cleveland, Ohio.
Cliffs Natural Resources Inc., a mining and natural resources company, produces and supplies iron ore. The company operates five iron ore mines in Michigan and Minnesota; and Koolyanobbing iron ore mining complex located in Western Australia, which produces lump and fines iron ore. It also own two iron ore mines in Eastern Canada. Cliffs Natural Resources Inc. sells its iron products to integrated steel companies and steel producers in the United States, China, Canada, and internationally. The company was formerly known as Cleveland-Cliffs Inc. Cliffs Natural Resources Inc. was founded in 1847 and is headquartered in Cleveland, Ohio.
CURRENT CHART: As of CLOSE 01-25-19
Cliffs Natural Resources was up 7.74% on Friday (01-25-19) being the biggest move of all our SII instruments. CLF is up 24.97% since December 31, 2018.
Cliffs has a high Beta of 1.65 within MATASII's highest Beta group, that of Infrastructure with 1.36 overall. Therefore major moves are normal and can be expected when they happen.

MATASII WATCH LIST TRIGGERS / GAINS: 36.54%
SEE SUBSCRIBER SITE FOR FULL
SII-LENDER WATCH LIST
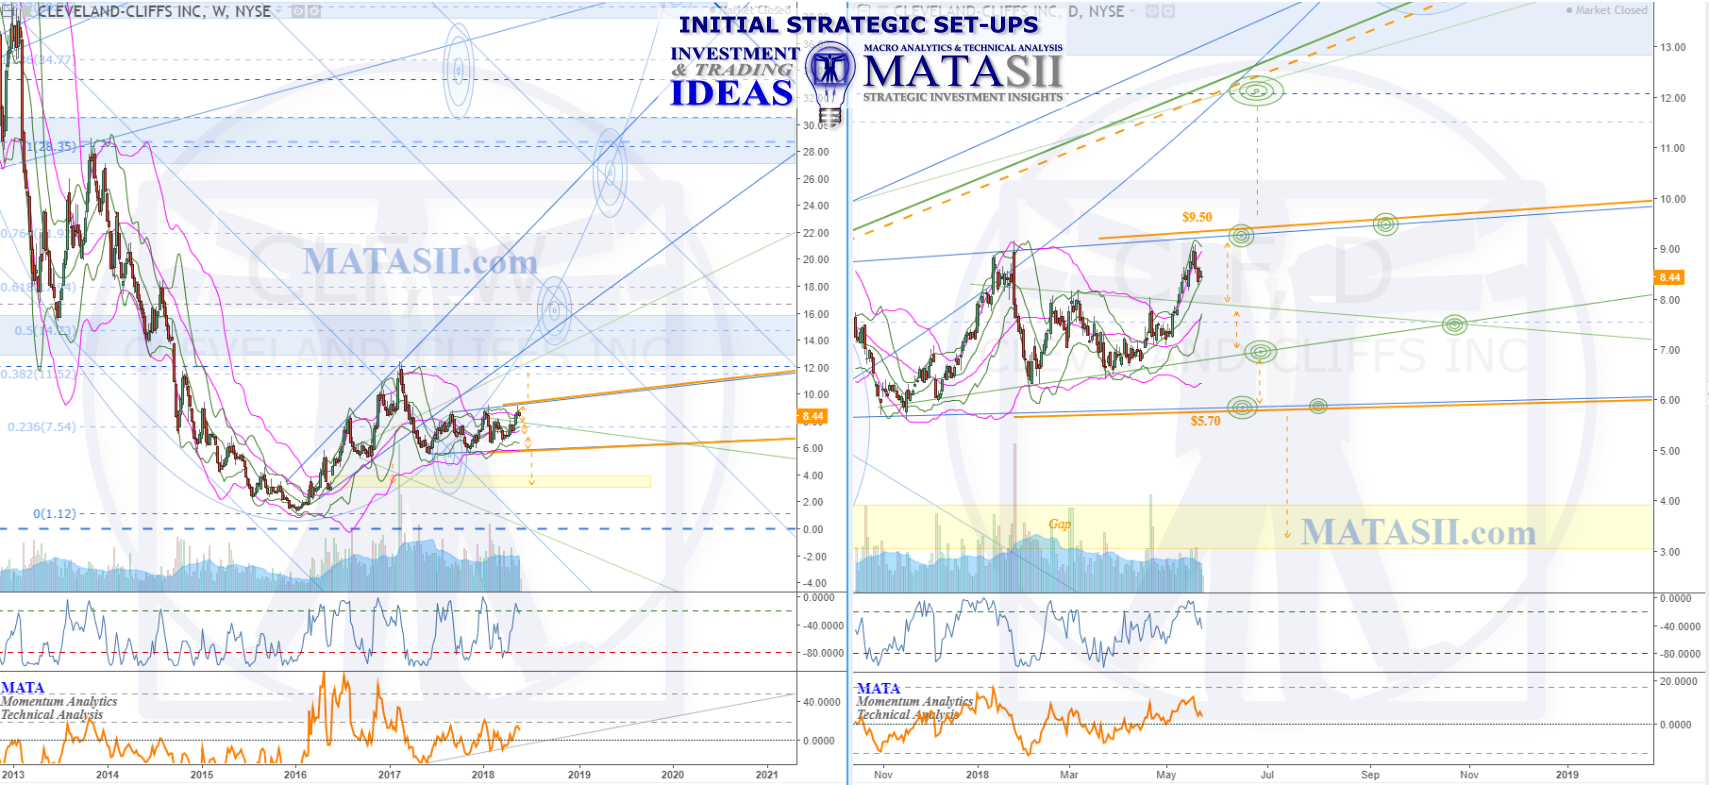
MATASII SII ORIGINAL ANALYSIS: CLF Cliffs Natural Resources: May 23rd, 2018
At the beginning of 2017 CLF broke out of an expanding wedge pattern and moved to a sideways consolidation (weekly chart, left). The boundaries of the sideways move offer potential trigger considerations, and these have been highlighted with solid orange. A price level of $9.50 has been given for the upper boundary, however note that the s/r is on a slight slope, and it is ultimately the break of the resistance that we are watching for. The same is true wrt the lower support and the $5.70 price given.
Previous highs and a blue (weekly) s/r zone above the market are the first target technicals to look towards ($11.50 - $12.00) if the market breaks up. IF we see a fall off and a break down through the lower supporting s/r then we would be looking towards the unfilled gap as a potential target level ($3.00).
Dashed arrows offer technical trigger considerations and potential moves to the next technical. Caution is advised when considering the technicals inside the sideways move as any of them could cause a market reaction (ie. reversal) when met.
OPTION #3
FED FOMC FALLOUT: 9 OUT OF 13 BIGGEST DECLINERS WERE "LENDERS"
A PUBLIC SOURCED ARTICLE FOR MATASII (SUBSCRIBERS-SII & PUBLIC ACCESS) READERS REFERENCE
SII - LENDERS
MATASII SYNTHESIS:
- 9 out of 13 biggest decliners the day after the FOMC Meeting Were SII Lenders,
- 4 of the 9 SII Lenders were already "SHORT" - furthering their gains.

MACRO ANALYTIC COVERAGE INITIATED
BROOKFIELD PARTNERS L.P. (BIP)
A PUBLIC SOURCED ARTICLE FOR MATASII (SUBSCRIBERS-SII & PUBLIC ACCESS) READERS REFERENCE
SII - INFRASTRUCTURE
MATASII SYNTHESIS:
CHART PACKAGE INDEX:
- ORIGINAL IDEA
- CURRENT IDEA CHART
- MACRO ANALYTICS
- PRIMARY INDICATOR - Longer Term: 6 Months - 2 Years
- 12 & 24 Monthly MA Bands
- 5/13/21 Monthly EMA
- SECONDARY INDICATOR - Intermediate Term - 3 Months - 12 Months
- 20/40/80 Weekly - MATA Indicator
- 20/40/80 Weekly MA Bollinger Bands
- TERTIARY INDICATOR - Near Term - Next 1- 3 Months
- 50/100/200 DMA
- 89 DMA w/BB
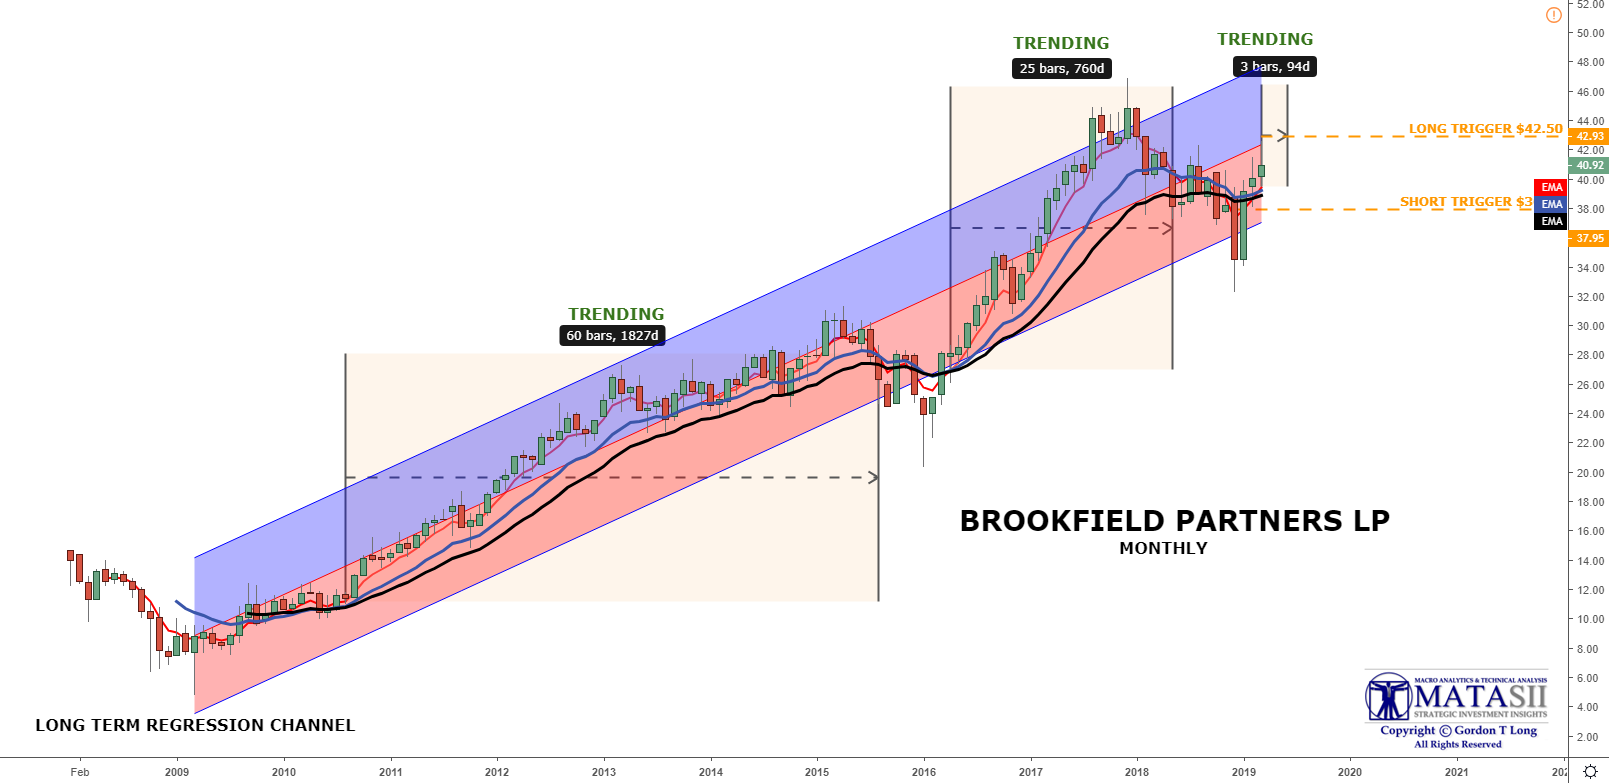
1- ORIGINAL IDEA - PUBLISHED MARCH 19th 2019
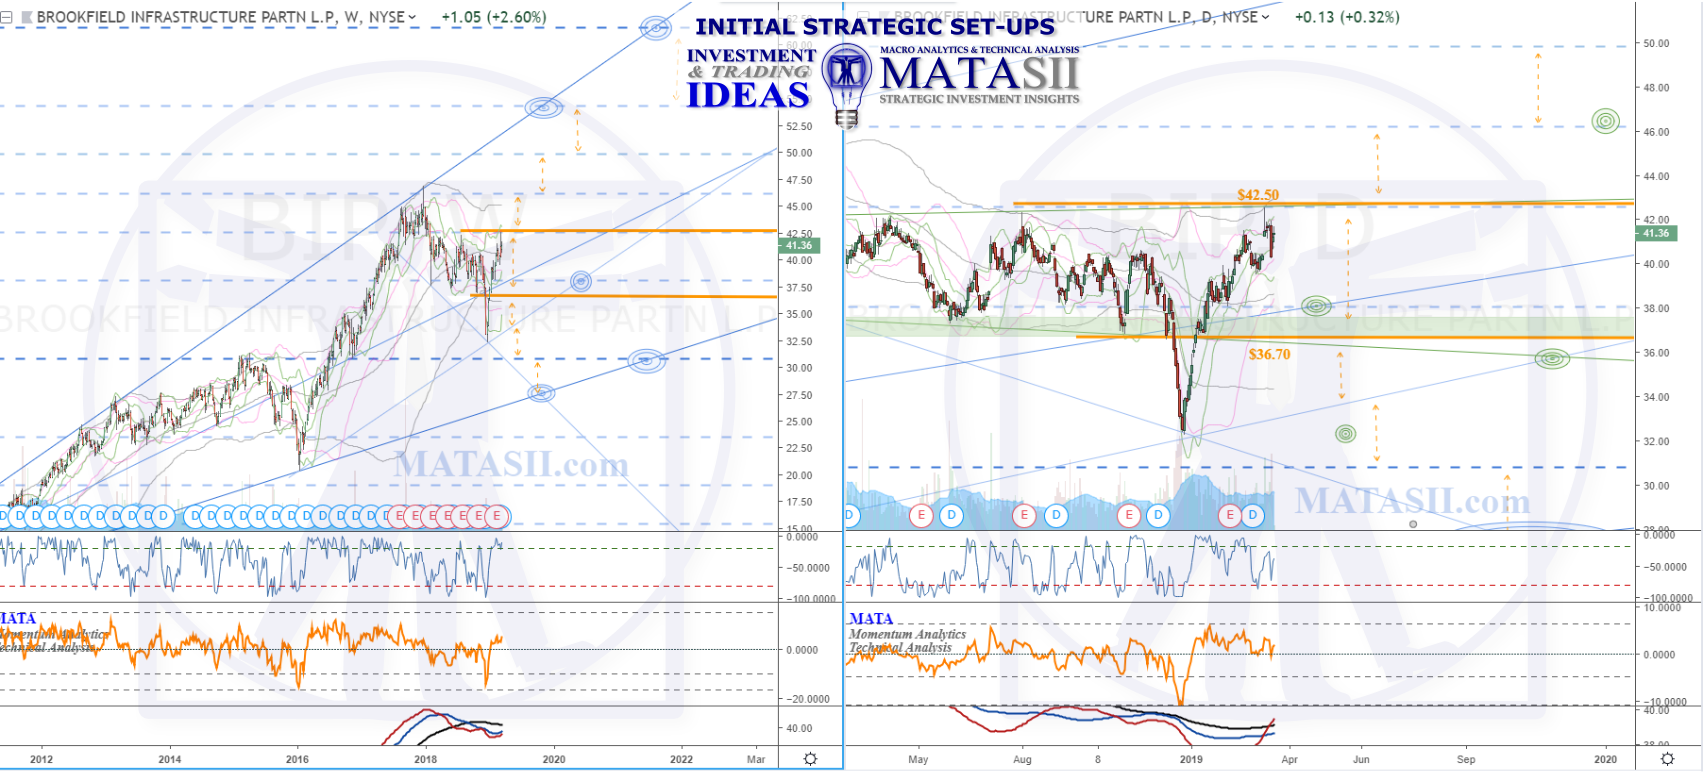
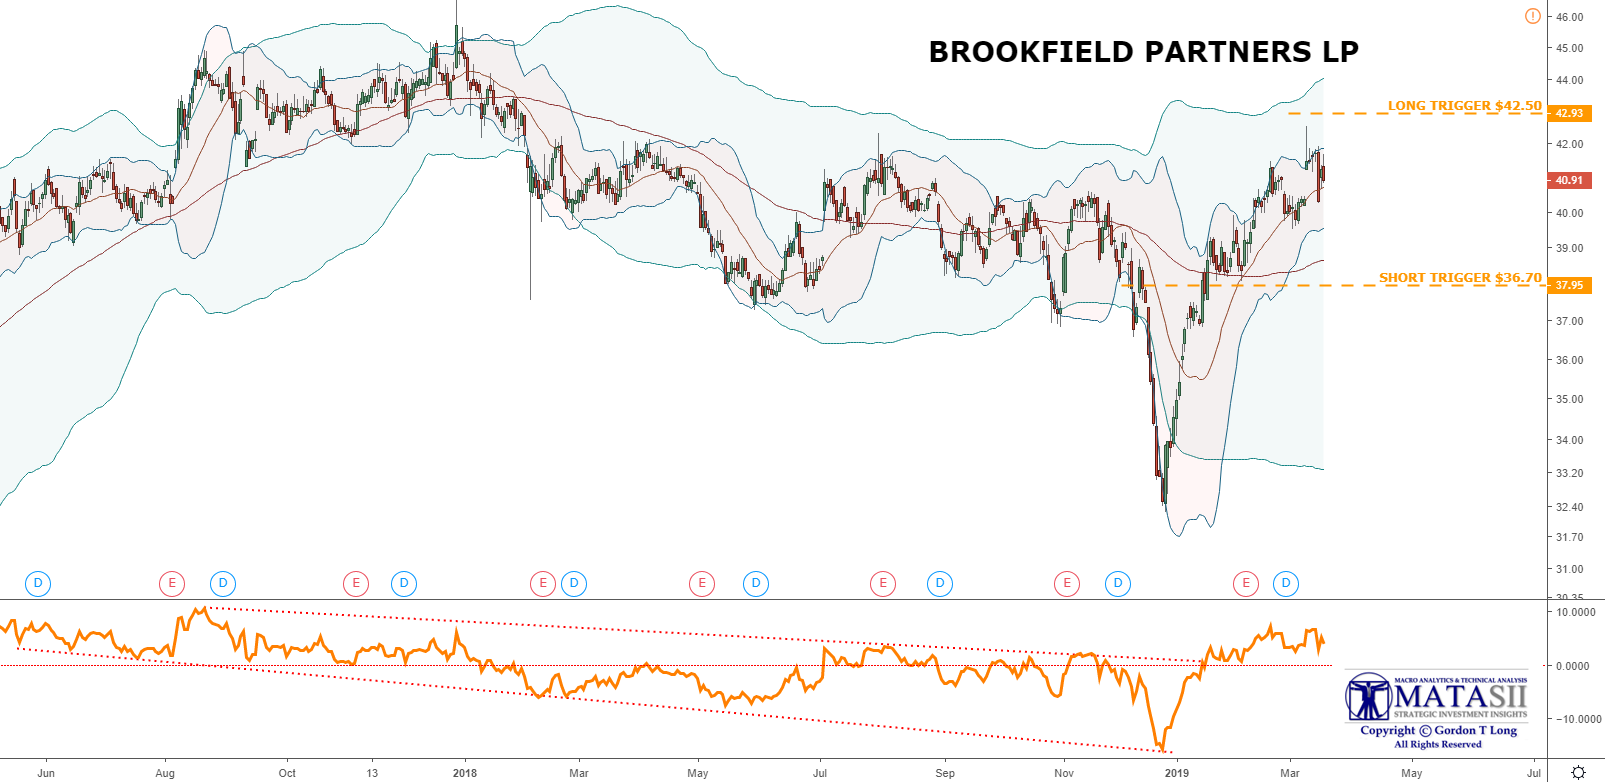
A large rising wedge that starts in 2009 (not shown) can be seen bounding the lift; as of Dec 2017 the market has come off the top resistance of the pattern (weekly chart, left). Note the blue (weekly) horizontal dashed Fibonacci levels - the market has also respected these to some degree, along with the pattern boundaries.
On both the weekly and daily charts we can see a large spike from Dec 2018 taking the market back up to previous resistance, which stopped the market as of March 12th, 2019.
The two solid orange highlighted technical levels identify significant support & resistance that has held a sideways movement since Feb 2018. The last significant spike down broke through the support, however the market is once again back in the previous range - breaking from this could provide potential opportunities. Lifting through the resistance at $42.50 could see a move back to previous highs of the market, and then potentially a continuation of the larger wedge pattern. IF resistance holds and supports fail, then we we would be looking towards the next lower technicals and the wedge patterns support for market reactions.
In general, the charts provide a background Market Road Map that can be used to plan your own personal investment / trading strategies. The charts are not a plan or strategy themselves and should not be used as such. They offer potential considerations for market reactions, that may or may not occur, for you to identify your own entries, exits, stops, etc, around. These charts are constructed with PAST market data, used to forecast potential market influences in the future, however, understand that PAST is NO GUARANTEE of FUTURE, and if the market is going to react at the technicals or not is PURE SPECULATION, and involves RISK. We can not know with any certainty if a technical will be respected or not, all we can do is wait and see what it does do.
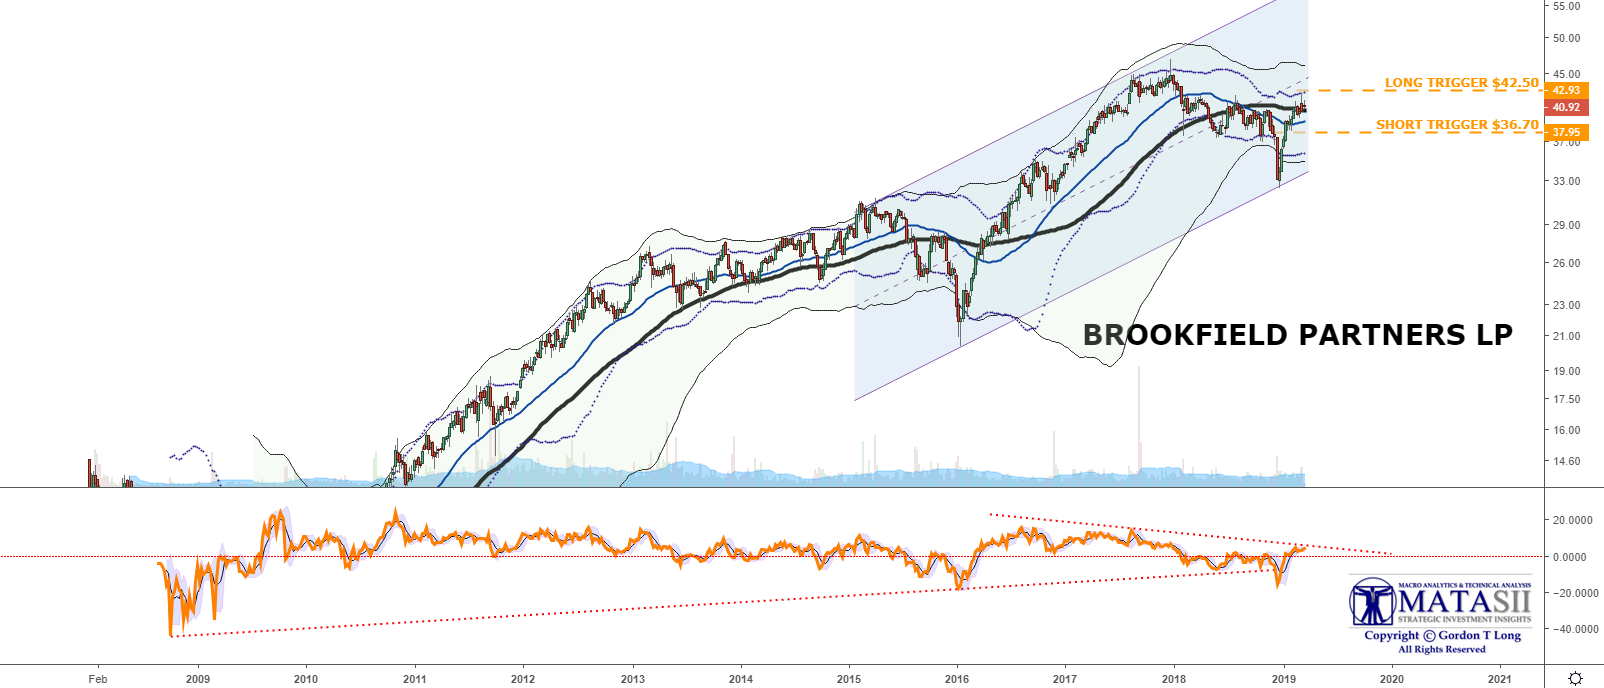
2- CURRENT IDEA CHART
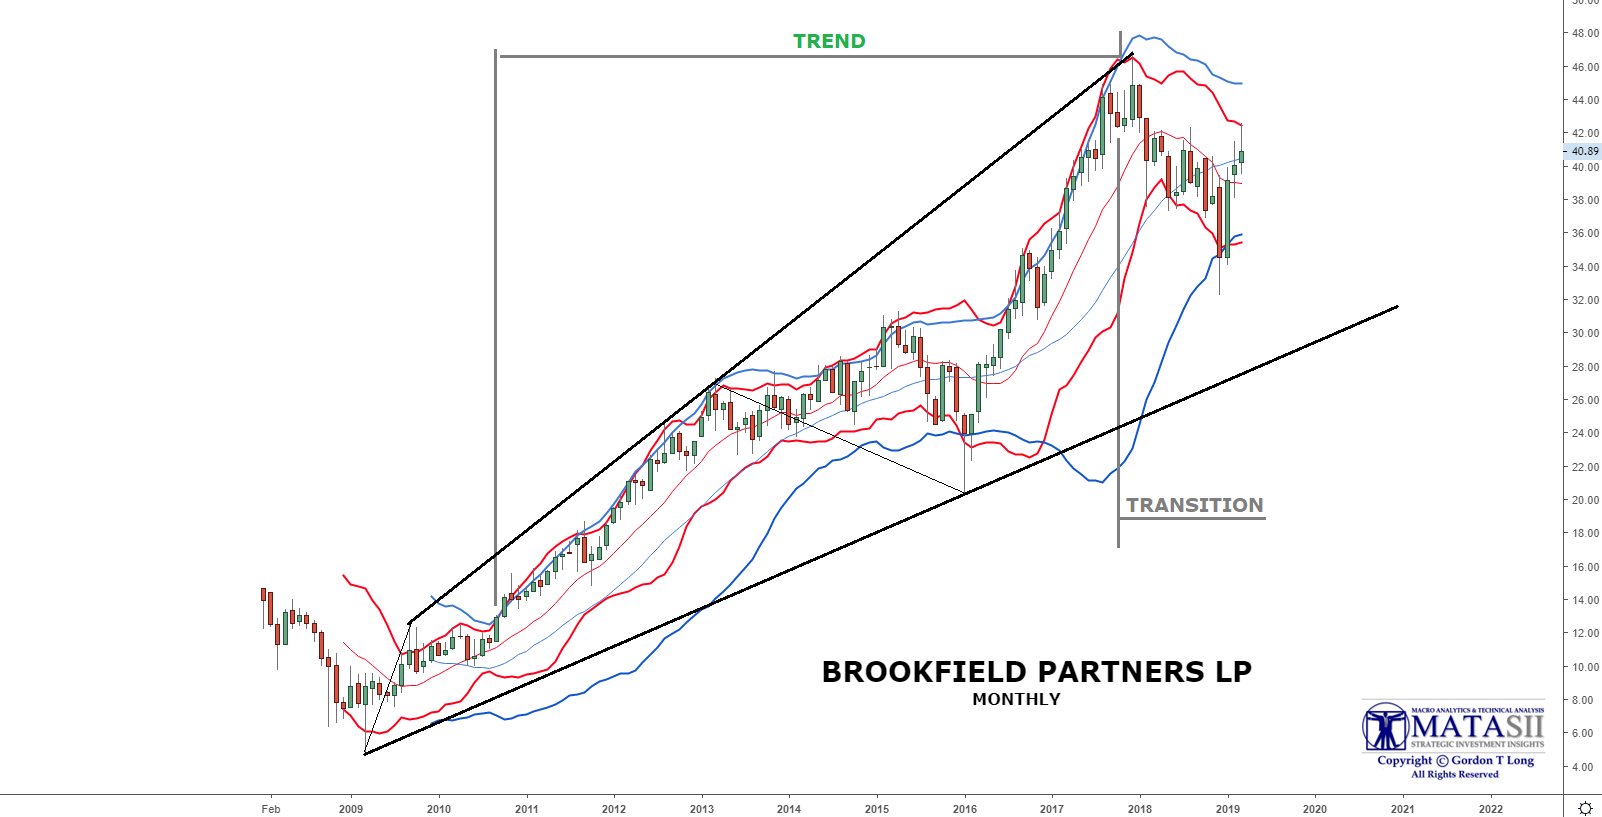
3-PRIMARY INDICATOR - Long Term: 6 Months - 2 Years
TREND VERSUS TRANSITION
- NEUTRAL Bias - In Transition, Not Yet Trending
STACKING
- Positive Bias would occur if the 12 MMA was to be clearly above the 24 MMA
TREND LINES
- Major S/R
REGRESSION
GEOMETRIC 5 / 13 / 21 - STACKING
- We are on the verge of a Positive Bias which would occur if the 13 Monthly EMA (BLUE) was clearly above the 21 Monthly EMA and the 5 EMA was above the 13 EMA - Currently all touching
CANDLESTICKS
TRIGGERS
- Introduce IDEA Triggers
4- SECONDARY INDICATOR - Intermediate Term - 3 Months - 12 Months
MATA INDICATOR
- MATA INDICATOR (Bottom Panel) still NEUTRAL but nearing a Positive Upward Bias if the upper 'dotted' trend line was to be broken to the upside.
CHANNELS
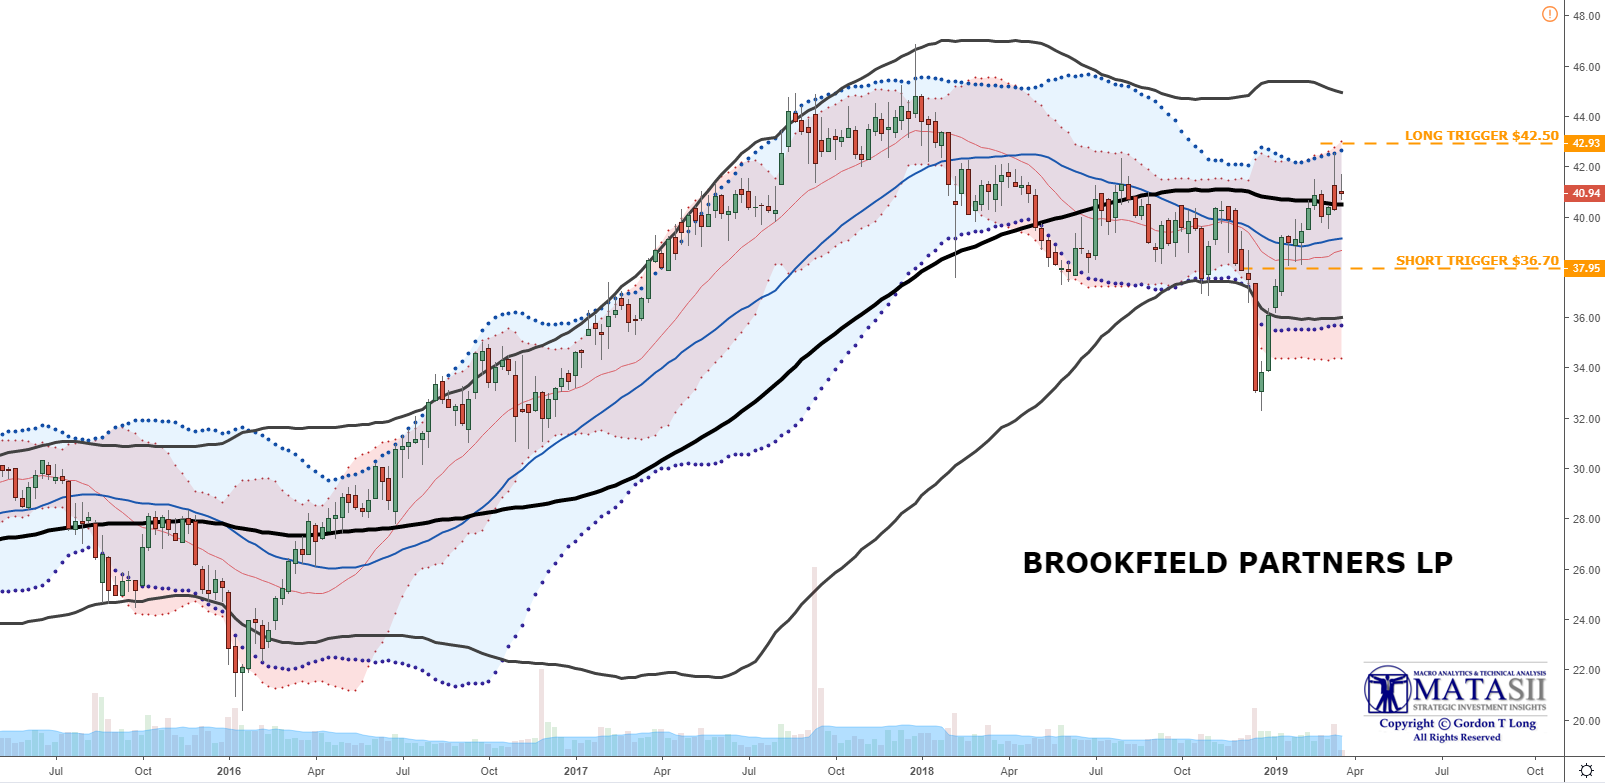
ARITHMETIC 80 & 40 WMA BOLLINGER BAND OVERLAP
BOLLINGER BAND CROSS - SET-UP
ARITHEMTIC 20-40-80 WMA BOLLINGER BAND OVERLAP
STACKING
- We have a Neutral Bias with Price now marginally above the 80 WMA,
- The 20 WMA is approaching a potential upward cross of the 40 WMA. Both are well below the 80 WMA
- We need to see the 20 WMA above the 40 WMA before we could consider a positive bias.
5- TERTIARY INDICATOR - Near Term - Next 1- 3 Months
CHANNELS
STACKING
- The 50 DMA has moved above the 100 & 200 DMA which is generating a short term upward 'counter' channel,
- There is a strong chance that the u[[er Bollinger Band will be achieved which approximates the $42.50 level.
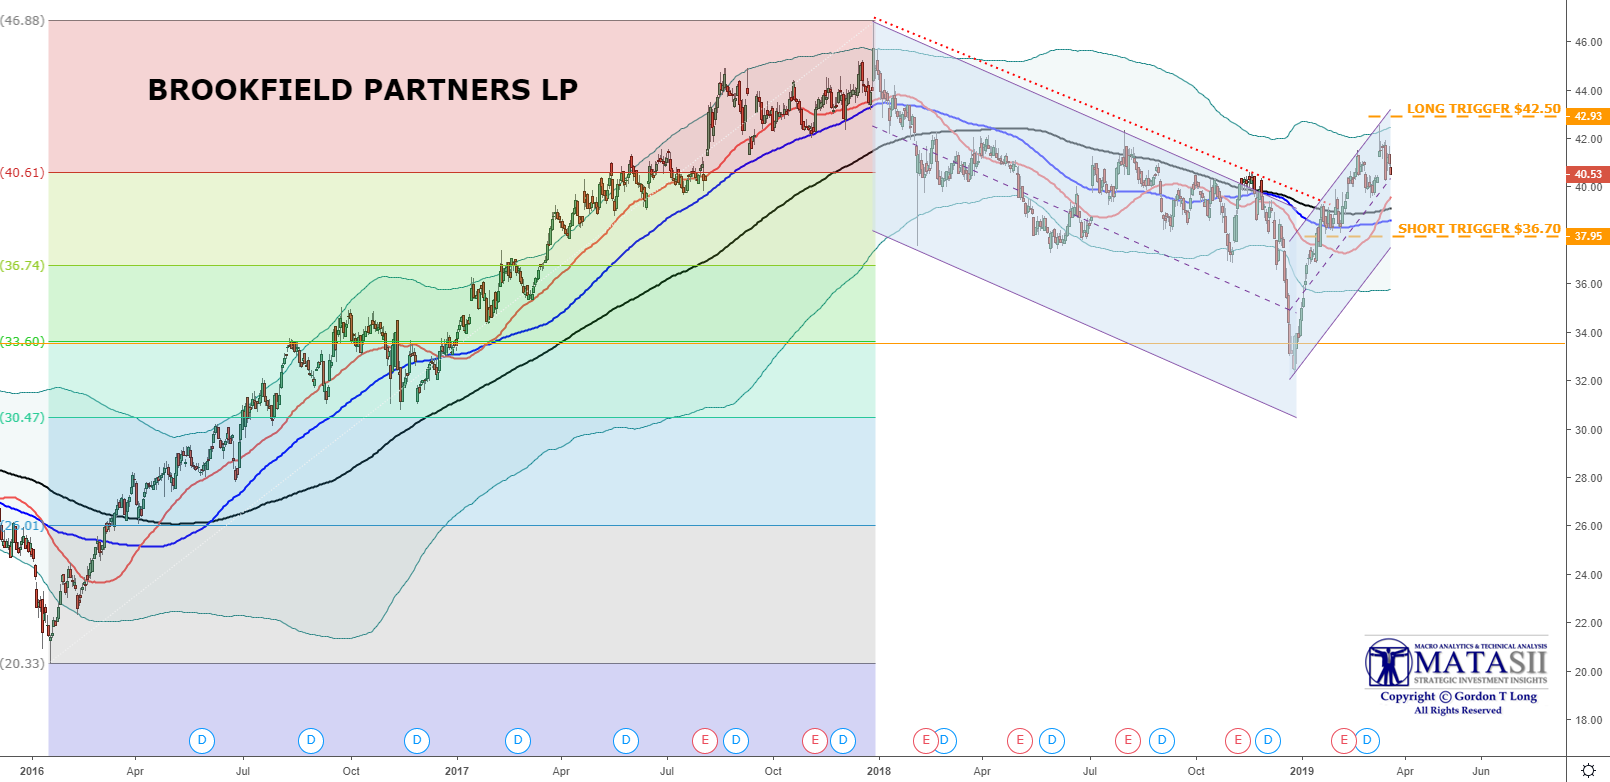
GEOMETRIC 89 & 31 BOLLINGER BANDS
- We will wait to see if our LONG Target at $42.50 is broken.
- We suspect it will
- hold and price will bounce off it.
BOLLINGER CROSSES
MATA INDICATOR
FAIR USE NOTICEThis site contains copyrighted material the use of which has not always been specifically authorized by the copyright owner. We are making such material available in our efforts to advance understanding of environmental, political, human rights, economic, democracy, scientific, and social justice issues, etc. We believe this constitutes a 'fair use' of any such copyrighted material as provided for in section 107 of the US Copyright Law. In accordance with Title 17 U.S.C. Section 107, the material on this site is distributed without profit to those who have expressed a prior interest in receiving the included information for research and educational purposes. If you wish to use copyrighted material from this site for purposes of your own that go beyond 'fair use', you must obtain permission from the copyright owner.
NOTICE Information on these pages contains forward-looking statements that involve risks and uncertainties. Markets and instruments profiled on this page are for informational purposes only and should not in any way come across as a recommendation to buy or sell in these assets. You should do your own thorough research before making any investment decisions. MATASII.com does not in any way guarantee that this information is free from mistakes, errors, or material misstatements. It also does not guarantee that this information is of a timely nature. Investing in Open Markets involves a great deal of risk, including the loss of all or a portion of your investment, as well as emotional distress. All risks, losses and costs associated with investing, including total loss of principal, are your responsibility.
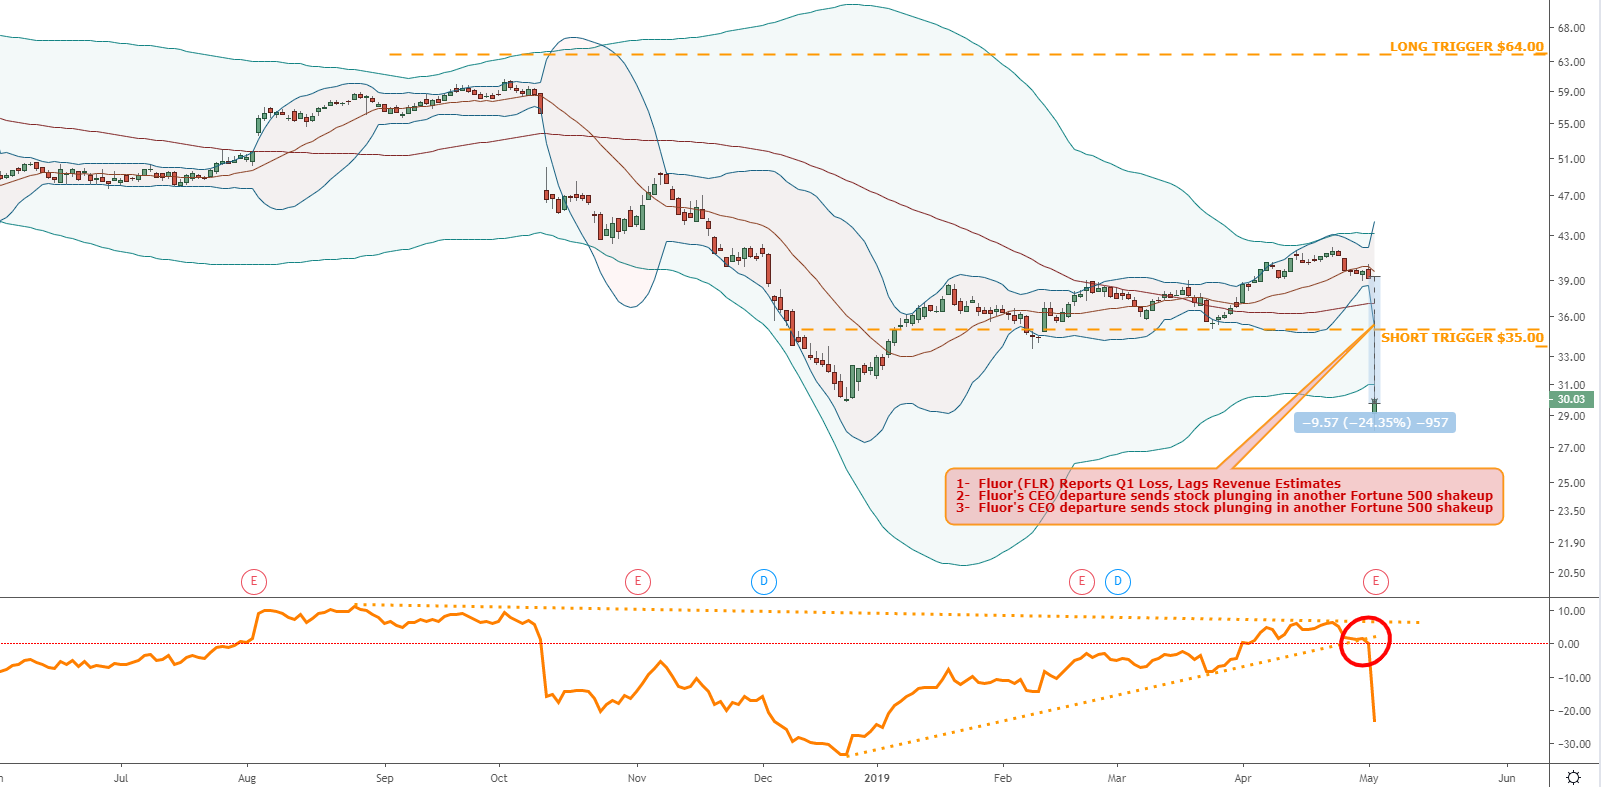
FLUOR (FLR): MATASII SHORT PLUMMETS ~23% IN ONE DAY!!
NEWS
[SITE INDEX -- SII - INFRASTRUCTURE]
A PUBLIC SOURCED ARTICLE FOR MATASII
READERS REFERENCE: (SUBSCRIBERS-SII & PUBLIC ACCESS)
SII - INFRASTRUCTURE
FAIR USE NOTICE This site contains copyrighted material the use of which has not always been specifically authorized by the copyright owner. We are making such material available in our efforts to advance understanding of environmental, political, human rights, economic, democracy, scientific, and social justice issues, etc. We believe this constitutes a 'fair use' of any such copyrighted material as provided for in section 107 of the US Copyright Law. In accordance with Title 17 U.S.C. Section 107, the material on this site is distributed without profit to those who have expressed a prior interest in receiving the included information for research and educational purposes. If you wish to use copyrighted material from this site for purposes of your own that go beyond 'fair use', you must obtain permission from the copyright owner.
NOTICE Information on these pages contains forward-looking statements that involve risks and uncertainties. Markets and instruments profiled on this page are for informational purposes only and should not in any way come across as a recommendation to buy or sell in these assets. You should do your own thorough research before making any investment decisions. MATASII.com does not in any way guarantee that this information is free from mistakes, errors, or material misstatements. It also does not guarantee that this information is of a timely nature. Investing in Open Markets involves a great deal of risk, including the loss of all or a portion of your investment, as well as emotional distress. All risks, losses and costs associated with investing, including total loss of principal, are your responsibility.