RECESSION LIKELY STILL 22 MO AWAY IN 2020 - HOWEVER, FINANCIAL STRESS BEGINS NOW
A PUBLIC SOURCED ARTICLE FOR MATASII (SUBSCRIBERS & PUBLIC ACCESS) READERS REFERENCE

SOURCE: 02-18-19 - Christopher DEMBIK, Head of Macroeconomic Analysis, Saxobank, - ""This Time Is Not Different" - Saxobank Warns The Temporary Calm Won't Last Long"
MATASII SYNTHESIS:
NY FED "RECESSION PROBABILITY TRACKER"
- Stands at 23.62% in January 2019,
- The index stood at just 14.1% in October 2018,
- Still below the threshold of 28% that has been systematically associated with recession over the past 50 years,
RECESSION PROBABILITY: 10-2 VERSUS 10-1
- Most research papers published by the Fed favor the one-year/10-year spread as more relevant,
- Since 1970, each US recession has been preceded by an inversion of the curve,
- Historically, the lag between the inversion of the yield curve and the recession is on average 22 months.
- The likelihood that a recession happens in 2020 is very high,
Over the past few years, it has been very popular among US policymakers to dismiss the curve, both because
- QE has depressed the term premium, thus artificially flattening,
- Because there are distortions caused by a preference for safe-haven assets, notably the US 10-year Treasury bonds (negative risk premium).
OBSERVATIONS
- An inverted yield curve negatively impacts the real economy through the banking sector by hurting banks’ profitability, which leads to more restrictive credit conditions (Occurring - See MATASII Lenders),
- In some cases, it may also signal that the monetary policy is too tight, implying that the neutral rate is lower than what the Federal Reserve believes (Current Belief).
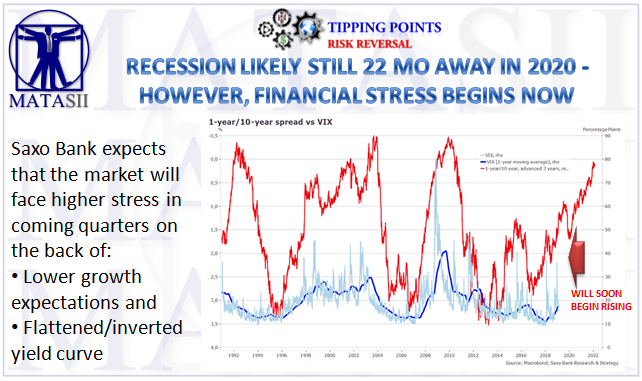
- Saxo Bank expects that the market will face higher stress in coming quarters on the back of
- Lower growth expectations and
- Flattened/inverted yield curve
- The one-year/10-year spread leads VIX by roughly three years.
- Normally, this is the right moment for policymakers to step in to stimulate the economy and reassure investors, but this scenario has low probability to happen due to monetary, fiscal and political constraints.
Except for the People's Bank of China, which may offer new facilities, the G4 central banks are expected to remain in pause mode, which means that G4 global liquidity will continue to slowdown as we slowly but surely enter a new and more dangerous economic period.
Investors seeking to track the probability of an incoming US recession must familiarize themselves with the yield curve, a key indicator.
Based on the market’s favorite indicator, the yield curve, the risk of US recession is becoming increasingly credible. Hopes for growth improvements may vanish quickly if policymakers don’t step in to stimulate the economy
Negative wealth effect due to lower house prices
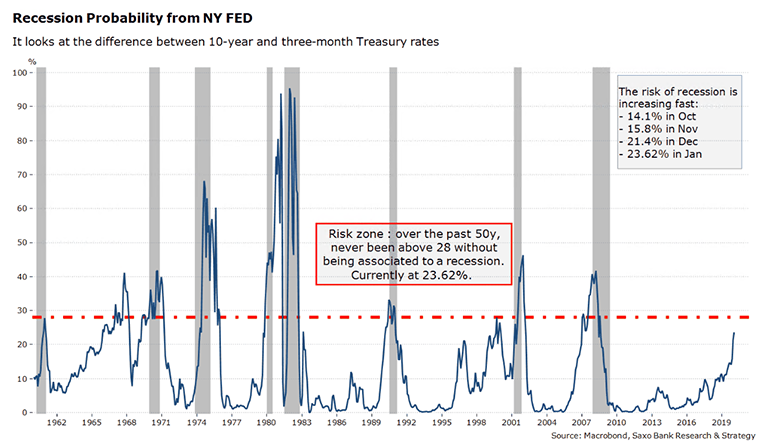
Recession probability models for the US have been all over the place of late. Saxo Bank uses the recession probability tracker from the Federal Reserve Bank of New York, which tracks the difference between 10-year and three-month Treasury rates, to assess the likelihood of an economic downturn. It has recently been updated and stands at 23.62% in January 2019.
Over the past two months, the risk of recession has significantly increased due to market panic linked to the Fed's monetary policy path. The index stood at just 14.1% in October 2018, then moved to 15.8% in November and jumped to 21.4% in December during the market turmoil. It is still below the threshold of 28% that has been systematically associated with recession over the past 50 years, but it is moving quickly towards this level.
To predict the likelihood of a recession, investors usually pay a lot of attention to the two-year/10-year spread, which is the most common indicator used. However, based on most research papers published by the Fed, we favor the one-year/10-year spread as more relevant.
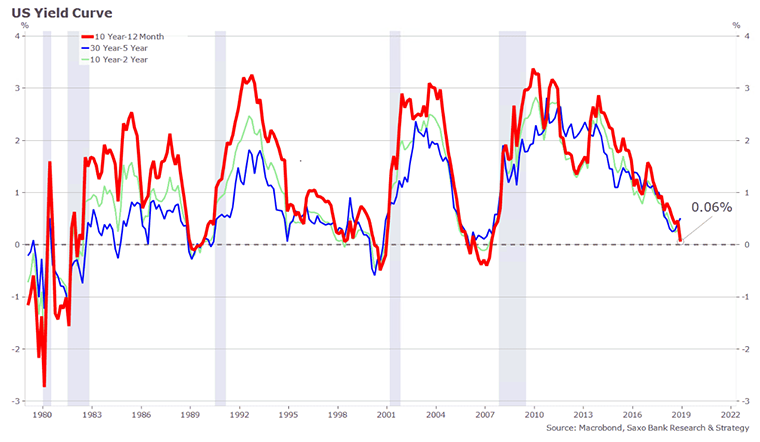
In normal economic conditions, the yield curve sloped upward, with 10-year Treasury bonds paying higher interest rates than the one-year bonds. But during economic downturns, short-term debt tends to have higher rates than long-term debt due to risk aversion.
Since 1970, each US recession has been preceded by an inversion of the curve. Its track record is quite impressive, with few fake signals (the credit crunch in the mid-1960s and the short-term inversion during the 1998 stock market crash).
Looking at the one-year/10-year spread, the curve is not inverted yet. As of today, it stands at +6 basis points but clearly follows a downward trend. That being said, it means that the risk of recession is becoming real but, based on the previous decades, this would only happen in several quarters. Historically, the lag between the inversion of the yield curve and the recession is on average 22 months. If history repeats itself – which is not certain – the likelihood that a recession happens in 2020 is very high.
This time is not different
Asked about the flattening trend in yields in July 2018, Fed chair Powell, like his predecessors Bernanke and Yellen, took a “this time it is different” outlook on signals sent by the bond market, indicating that the shape of the yield curve will not influence normalizing interest rates and the balance sheet. He confirmed at this occasion that “what really matters is what the neutral rate of interest is”.
Over the past few years, it has been very popular among US policymakers to dismiss the curve, both because QE has depressed the term premium, thus artificially flattening, and because there are distortions caused by a preference for safe-haven assets, notably the US 10-year Treasury bonds (negative risk premium).
The influence of these two factors cannot be ignored, but it would be very unwise to overlook the current signals given the reliability of the US yield curve in forecasting recessions. Historically, an inverted yield curve is the sign that:
- Markets expect the economy to deteriorate, as it is the case nowadays (the latest ugly US data, such as December retail sales, confirm a sharp deceleration). An inverted yield curve negatively impacts the real economy through the banking sector by hurting banks’ profitability, which leads to more restrictive credit conditions.
- In some cases, it may also signal that the monetary policy is too tight, implying that the neutral rate is lower than what the Federal Reserve believes. This is one of the criticisms that are beginning to be formulated and which seems to be corroborated by our simple US Monetary Condition Index which points to tight monetary conditions since early 2018.
What’s next?
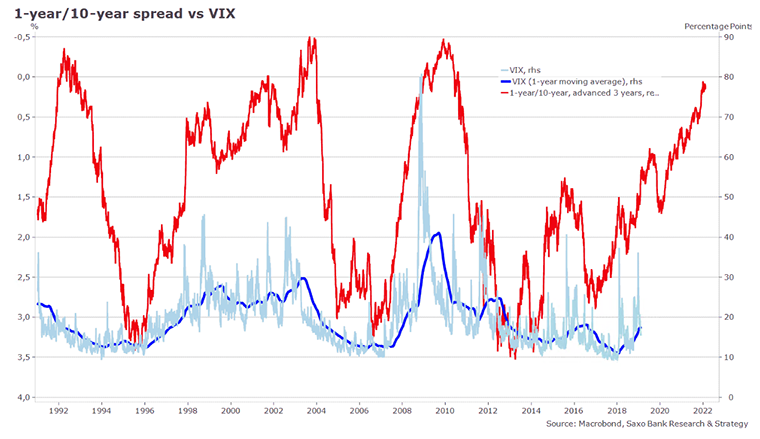
As we believe that the curve is still one of the most important signals regarding the risk of recession, we expect that the market will face higher stress in coming quarters on the back of lower growth expectations and flattened/inverted yield curve. In the chart below, we have plotted the VIX and the one-year/10-year spread.
The temporary calm resulting from the Fed pause is unlikely to last long. Stress will return, as we can see that the one-year/10-year spread leads VIX by roughly three years. Over the past three decades, the steepening of the curve has systematically caused more financial stress due to worries about growth. In other words, the worst is yet to come.
Like it or not, the yield curve inversion will quickly become the Fed’s next problem. Normally, this is the right moment for policymakers to step in to stimulate the economy and reassure investors, but this scenario has low probability to happen due to monetary, fiscal and political constraints. Except for the People's Bank of China, which may offer new facilities, the G4 central banks are expected to remain in pause mode, which means that G4 global liquidity will continue to slowdown as we slowly but surely enter a new and more dangerous economic period.